國
立
交
通
大
學
光電工程研究所
碩 士 論 文
內嵌式光感測器之三維互動立體顯示器
3D Interactive Display with Embedded Optical Sensors
研 究 生:白宗緯
指導教授:謝漢萍 博士
黃乙白 博士
內嵌式光感測器之三維互動立體顯示器
3D Interactive Display with Embedded Optical Sensors
研 究 生: 白宗緯 Student:Tsung-Wei Pai
指導教授: 謝漢萍 Advisor:Han-Ping D. Shieh
黃乙白
Yi-Pai Huang
國 立 交 通 大 學
光 電 工 程 研 究 所
碩 士 論 文
A ThesisSubmitted to Institute of Electro-Optical Engineering College of Electrical and Computer Engineering
National Chiao Tung University in partial Fulfillment of the Requirements
for the Degree of Master
in
Electro-Optical Engineering June 2009
Hsinchu, Taiwan, Republic of China
i
內嵌式光感測器之三維互動立體顯示器
碩士研究生:白宗緯 指導教授:謝漢萍教授
黃乙白助理教授
國立交通大學電機學院 光電工程研究所
摘 要
近年來各顯示器廠商及各研究單位都在積極開發立體顯示器,期望能夠提供 給人們一個更接近真實生活的視覺享受。然而,在既有的立體顯示器系統之下, 如何達成人機的互動,也成為各家廠商與研究單位爭相開發的技術。既有的立體 顯示器人機互動界面大多採用外加光學感測元件以達成互動機制,這個外加光學 元件使得整體系統的體積增加。同時,若是採用電荷耦合元件(CCD)作為光學感 測元件,則會因為收光角度的影響,使得在靠近面板附近的區域無法接收到影像, 而導致無法互動。因此,如何達成互動機制且同時又不增加整體系統的體積將會 是開發立體互動顯示器必須要克服的議題。本論文針對體積的議題提出一新式的 系統架構,主要為在一具有內植光感測器的面板上,貼附上視差遮罩以達到立體 顯示同時又具有互動的功能。由於光感測器是被植入在面板裡面,因此,靠近面 板附近區域的影像能夠被接收到,進而使得人機互動的工作範圍能夠延伸至靠近 面板的區域。 在貼有視差遮罩具有內植光感測器的 2.83 吋面板架構下,實際架設硬體所 得到的可工作範圍在照光模式下為四公分,在擋光模式下為五公分。由於是針對 小尺寸面板的應用來作設計,且現有的立體顯示深度資訊大約在五公分之內,因 此,四公分的工作範圍在小尺寸的面板應用是足夠的。ii
3D Interactive Display with Embedded Optical Sensors
Student: Tsung-Wei Pai Advisor: Dr. Han-Ping D. Shieh Dr. Yi-Pai Huang
Institute of Electro-Optical Engineering National Chiao Tung University
Abstract
In order to achieve more natural 3D sensory images from displays, many studies have been devoted to 3D display technology developments. Furthermore, 3D interaction based on existing 3D display structure is a popular research topic. Most existing 3D interactive displays are composed of a 3D display and extra sensing components which increase interactive system volume. When 3D interactive displays use a camera as the sensing component, 3D interactive displays do not work in the region near the panel because of a limited capturing angle. Therefore, 3D interaction without increasing system volume is an important issue. In this thesis, we propose a novel structure for 3D interactive displays. The 3D interactive display is designed by combining a panel with embedded optical sensors and barriers to display 3D images and produce 3D interaction simultaneously. By using an embedded optical sensors panel, the 3D interactive system can capture the image in the region near the panel. As a result, the interactive range is widened to the region near panel.
In the experimental results, the interactive range was about 4cm in lighting mode and 5cm in blocking mode. These interactive ranges still can be applied to mobile applications whose depth information is within 5cm.
iii
誌 謝
首先誠摯的感謝指導老師謝漢萍教授和黃乙白助理教授,在這碩士兩年的求 學中對於研究態度及英文能力的教導,不僅提供豐富的資源與完善研究環境,使 我得以在碩士生涯提升了專業及英文的能力,並且順利完成此論文。此外,也感 謝各位口試委員所提供的寶貴意見,使本論文更加的完備。 在此特別感謝王國振學長對於論文的指導,其細心的指導方式,嚴謹的研究 態度,讓我不僅只在研究上的學習成長,更在做人處世上受益良多。此外我要感 謝友達光電諸位合作同仁提供我寶貴的意見及實作的協助,讓整個研究進展的更 順利。 在實驗室的日子裡,感謝有鄭榮安、林芳正、楊柏儒、陳均合、莊喬舜、鄭 裕國、許精益、蔡柏全、王奕智等學長們提供各方面的指導與協助,也感謝勝昌、 凌嶢、建良、國振、仁杰、景明、明農、宛徵、其霖等學長姊們讓我的生活更加 精彩。同時感謝育誠,致維,宜如,佑禎,拓江,靖堯,博文,俊賢,浩彣,宜 伶,高銘,益興等同學們在課業、研究、生活上的幫助與分享,並伴我一起度過 兩年碩士班的日子。我也感謝實驗室的學弟妹們與助理小姐,感謝你/妳們的幫 忙及讓實驗室充滿歡愉的氣氛。 最後,對於我的家人與女朋友,我要感謝你們多年來的支持與鼓勵以及生活 上的細心照顧,使我能無後顧之憂的研究與學習,並順利完成碩士學位。這份喜 悅與榮耀我將跟所有我所認識的各位分享。iv
Table of Contents
Abstract (Chinese) ...i
Abstract (English) ... ii
Acknowledgement
...…………...………...………...iiiTable of Contents ... iv
Figure Captions ... vi
Chapter 1 ... 1
1.1 Preface ... 1 1.2 2D Interactive Technology ... 2 1.3 3D Interactive Interface ... 31.4 Motivation and Objective... 6
1.5 Organization of This Thesis ... 8
Chapter 2 ... 9
2.1 Classification of 3D Interactive Systems ... 9
2.1.1 Optical Based Interface ... 9
2.1.2 Machinery Based Interface ... 10
2.2 Algorithm for 3D Interactive Systems ... 11
2.2.1 Algorithm for Optical Based Interface ... 12
2.2.2 Algorithm for Machinery Based Interface ... 15
2.3 Summary of 3D Interactive Systems ... 16
Chapter 3 ... 17
3.1 Structure of 3D Interactive Display ... 17
3.2 Algorithms for 3D Interactive Display... 20
3.2.1 Algorithms for 3D Interactive Display in Lighting Mode ... 21
3.2.2 Algorithms for 3D Interactive Display in Blocking Mode ... 23
3.3 Mathematical Model for 3D Interactive Display ... 24
v
Chapter 4 ... 27
4.1 Simulation Results of 3D Interactive Display ... 27
4.1.1 Simulation Results in Lighting Mode ... 27
4.1.2 Simulation Results in Blocking Mode ... 30
4.2 System Tolerances of the 3D Interactive Display ... 33
4.2.1 Impacts of Lighting Profiles in Lighting Mode ... 34
4.2.2 Impacts of Barrier Misalignments in Blocking Mode ... 35
4.3 Summary ... 36
Chapter 5 ... 37
5.1 Experiments in Lighting Mode ... 37
5.2 Experiments in Blocking Mode ... 42
5.3 Summary ... 47
Chapter 6 ... 48
6.1 Conclusions ... 48 6.2 Future Works ... 49References ... 51
vi
Figure Captions
Fig. 1-1 Auto-stereoscopic display [2]. ... 1
Fig. 1-2 Commercial product with touch function [4]. ... 2
Fig. 1-3 Three types of touch panels. From left to right: resistive [5], capacitive, and optical [6]. ... 2
Fig. 1-4 3D interactive system. ... 3
Fig. 1-5 3D interactive interface. ... 4
Fig. 1-6 Optical based 3D interactive interface [7]. ... 5
Fig. 1-7 Machinery based 3D interactive interface [8]. ... 5
Fig. 1-8 3D map guiding system [9]. ... 7
Fig. 1-9 3D communication system [9]. ... 7
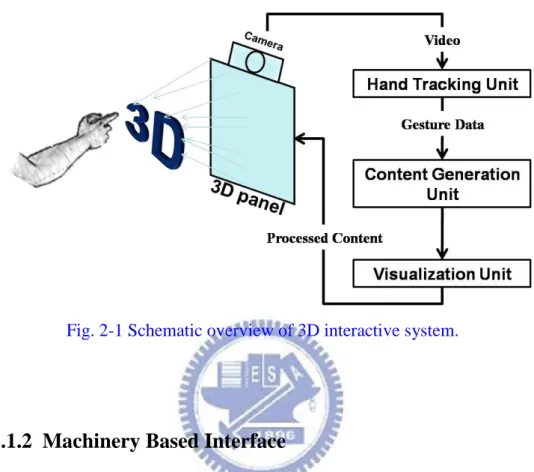
Fig. 2-1 Schematic overview of 3D interactive system. ... 10
Fig. 2-2 Schematic overview of 3D interactive system. ... 11
Fig. 2-3 Algorithm for optical based interface [10]. ... 12
Fig. 2-4 Extracting hand position from reference. From left to right: input image, reference image, output image. ... 12
Fig. 2-5 Stereo image based segmentation. Left: original image. Right: processed image [11]. ... 13
Fig. 2-6 Color segmentation. Left: original image. Right: processed image [12]. ... 13
Fig. 2-7 Contour detection. Left: original image. Right: processed image [13]. ... 14
Fig. 2-8 Connected component algorithm. Left: original image. Right: processed image [14]. ... 14
Fig. 2-9 Algorithm for machinery based interface. ... 15
Fig. 2-10 3D interactive display. ... 16
Fig. 3-1 Cross section view of conventional flat panel display. ... 18
vii
Fig. 3-3 3D barriers. ... 18
Fig. 3-4 Barriers guide the left and right image pixels into different directions... 19
Fig. 3-5 Pixel layout of panel with embedded optical sensors. ... 19
Fig. 3-6 Data mapping processes. ... 20
Fig. 3-7 Operating 3D interactive display. ... 21
Fig. 3-8 Algorithms for 3D interactive display in lighting mode, (a) object height is zero, (b) object height is d, (c) & (d) L-sensor and R-sensor light distributions, (e) & (f) L-sensor and R-sensor light distributions plotted in the same chart. ... 22
Fig. 3-9 Light distributions of two groups of sensors over whole panel. ... 22
Fig. 3-10 Light distribution plotted along direction of barrier strip. ... 23
Fig. 3-11 Algorithms for 3D interactive display in blocking mode, object height is (a) zero, and (b) d. ... 24
Fig. 3-12 A side view of the geometrical structure in lighting mode. ... 25
Fig. 4-1 The simulation model in lighting mode. ... 28
Fig. 4-2 Light distributions received by two groups of sensors in lighting mode. ... 29
Fig. 4-3 Light distribution in lighting mode plotted along the barrier strip direction. 29 Fig. 4-4 The relation between heights and disparities. ... 30
Fig. 4-5 The simulation model in blocking mode. ... 31
Fig. 4-6 Light distribution in blocking mode, object height is (a) zero, and (b) d. ... 32
Fig. 4-7 Light distribution in blocking mode plotted along barrier strip direction. ... 32
Fig. 4-8 The relation between heights and shadow sizes. ... 33
Fig. 4-9 The relation between heights and disparities under the illuminations of different lighting profiles. ... 35
Fig. 4-10 The relation between heights and shadow sizes under different percentages of the misalignment. ... 36
Fig. 5-1 The experimental setup in lighting mode. ... 38
viii
Fig. 5-3 The flowchart of defect elimination. ... 38
Fig. 5-4 Light distributions received by two groups of sensors in lighting mode, object height is (a) 0mm, and (b) 10mm. ... 39
Fig. 5-5 The relation between heights and disparities. ... 40
Fig. 5-6 Light distribution in lighting mode plotted along the barrier strip direction. 40 Fig. 5-7 The relation between heights and disparities. ... 41
Fig. 5-8 The relations between heights and disparities under different illumination intensities. ... 42
Fig. 5-9 The experimental setup in blocking mode. ... 43
Fig. 5-10 The captured image. ... 43
Fig. 5-11 The flowchart of defect elimination. ... 43
Fig. 5-12 Shadows in blocking mode, object height is (a) 15mm, and (b) 35mm. ... 45
Fig. 5-13 The relation between heights and shadow sizes. ... 45
Fig. 5-14 Light distribution in blocking mode plotted along barrier strip direction. ... 46
Fig. 5-15 The relation between heights and shadow sizes. ... 46
Fig. 6-1 3D interactive display operated by different input signals (a) vertical input signals, (b) oblique input signals. ... 49
1
Chapter 1
Introduction
1.1 Preface
The developments of display are motivated by rendering more natural image. Therefore, the next generation of display systems is thought to be auto-stereoscopic (3D) displays. 3D displays provide a new type of visual perception. This display introduces humans to real life images, because 3D images contain three-dimensional coordinate information [1]. Thus, people perceive a life-like image, as shown in Fig. 1-1.
Fig. 1-1 Auto-stereoscopic display [2].
Many displays on the market provide 3D images but few have interactive function. To create a more convenient human-machine interface, the 3D interactive system is considered to be an essential part of future display systems [3]. Thus, 3D displays with 3D interactive function are potential candidates for future display systems.
2
1.2 2D Interactive Technology
More products on the market offer touch functions (as shown in Fig. 1-2). These technologies can be roughly classified into three types: resistive, capacitive, and optical (as shown in Fig. 1-3). However, these technologies are not suitable for 3D interactive applications. 2D interactive technology only recognizes panel coordinates, which means users have to touch panel to operate a computer. Therefore, 2D interactive interfaces cannot offer touch function to 3D displays.
Fig. 1-2 Commercial product with touch function [4].
Fig. 1-3 Three types of touch panels. From left to right: resistive [5], capacitive, and optical [6].
3
3D interactive technologies are used as a human-machine interface between humans and 3D displays (Fig. 1-4). A 3D interactive interface can identify hand position which does not contact with panel through a computer. With this feature, 3D interactive interfaces can interact with 3D display images that contain three-dimensional coordinate information. Conventional 2D touch panels are inadequate for interacting with 3D displays because 2D touch panels recognize only two coordinates. Therefore, 3D interactive technology can give the spatial hand coordinates to machine and provide feedback to the user. With this technology, humans can interact with 3D displays.
Fig. 1-4 3D interactive system.
1.3 3D Interactive Interface
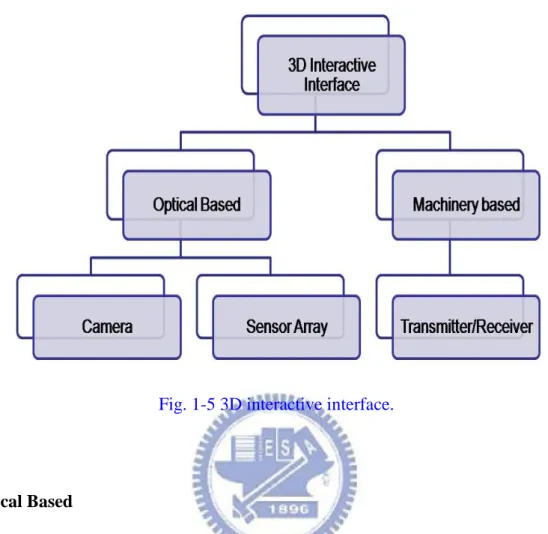
3D interaction can be designed in different ways. Differing from 2D touch panels, the 3D interactive technologies can be classified into two types: optical and machinery based, as shown in Fig. 1-5. Optical based interactive interfaces use cameras or sensor arrays as sensing components while machinery based interactive
4
interfaces use transmitters and receivers as sensing components.
Fig. 1-5 3D interactive interface.
Optical Based
An optical based 3D interactive interface is shown in Fig. 1-6. The optical based interfaces use cameras or sensor arrays to capture images. This characteristic offers users to use their bare hands to operate computer. By analyzing captured images, hand position can be identified. However, there are some issues in this system. The system volume is larger than a flat panel display, and it does not work in the region near panel because of limited capturing angle.
5
Fig. 1-6 Optical based 3D interactive interface [7].
Machinery Based
The machinery based interface uses computerized clothing to recognize physical gestures. Users wear particular computerized clothing to operate a computer. After recognizing these gestures, feedback information is received by users. Finally, these machinery based interfaces (Fig. 1-7) provide users a convenient human-machine interface. Although it provides users a convenient human-machine interface, it still has some issues. The system volume is larger than a flat panel display, and the structure is more complicated than a flat panel display.
6
1.4 Motivation and Objective
The volume is still an issue to an optical and machinery based interactive interface. The system volume is larger than a flat panel display. The system volume is increased, because these conventional 3D interactive interfaces require extra optical sensing components to achieve 3D interaction. Furthermore, when an optical based interactive interface uses a camera as a sensing component, the system cannot work in the region near the panel because of limited capturing angle. As a result, volume and interactive range are key issues when developing 3D interactive technology. Despite these two issues, 3D displays with 3D interactive function can also be used in many applications, such as medical treatment, map guiding (Fig. 1-8), and communication (Fig. 1-9).
In this thesis, we proposed a novel structure for a 3D interactive interface which produced the 3D interaction without increasing system volume and included the region near panels into interactive range simultaneously.
7
Fig. 1-8 3D map guiding system [9].
8
1.5 Organization of This Thesis
The organization of this thesis is as following: some existing technologies are illustrated in Chapter 2. In addition, the drawbacks of existing technologies are also discussed. In Chapter 3, the structure and algorithm of proposed 3D interaction display are presented. After that, the simulation results are discussed in Chapter 4 and the experimental results are discussed in Chapter 5. Finally, the conclusions and future works are in Chapter 6.
9
Chapter 2
Prior Arts of 3D Interactive Systems
Several representative technologies of 3D interactive system will be reviewed and illustrated. The configurations, algorithms, and issues for each technology will be described in detail.
2.1 Classification of 3D Interactive Systems
The main 3D interaction technologies are divided into two types: optical and machinery based. These two technologies have the same merit; 3D interactive displays can be developed by combining 3D interactive systems and displays. Therefore, depending on the application, these two interfaces are used in different fields.
2.1.1 Optical Based Interface
An optical based interactive interface is developed by using one or more optical sensing components. A schematic overview of the 3D interactive system is shown in Fig. 2-1. When users wave their hand in front of panel, the camera captures these images. Continuously captured images are treated as video. Then, this video is analyzed to identify hand and gesture data using a hand tracking unit. After obtaining these data, the content generation unit generates images. Finally, the visualization unit produces content for display. Virtual reality interaction is completed when the processed content is displayed. Thus, users can interact with what they see by using their bare hands just like interacting with real objects. This characteristic offers a more
10
convenient interface to users which can operate a computer without any other device. For this reason, main applications for optical based interfaces are entertainment, communication, and remote control.
Fig. 2-1 Schematic overview of 3D interactive system.
2.1.2 Machinery Based Interface
A machinery based interface is developed by combining computerized clothing with a receiver. The schematic overview is shown in Fig. 2-2. Before users operate a computer, users have to wear specialized components such as a remote control or a data glove to transmit gesture information to the receiver. These components are hand and gesture driven. The interactive unit recognizes these gestures by checking pre-saved image data. After recognizing gestures, the image content generation unit generates images. Finally, the visualization unit produces content for display. Thus, humans can experience events that cannot be perceived in the real world. The main applications for machinery based interface are medical treatments and physical training. In these applications, users need feedback to operate computer more precisely.
11
Fig. 2-2 Schematic overview of 3D interactive system.
According to the structural description of these two interfaces, the system volume issue is common to both types. Because the structure of machinery type is much more complicated than optical type, the machinery based interface can offer users a precise operating interface. However, an optical based interface can allow users to interact with what they see by using their bare hands. The differences in structure also result in differences in algorithm.
2.2 Algorithm for 3D Interactive Systems
The algorithm for 3D interactive systems depends on their structures. Algorithms for optical based interfaces are based on digital image processing. However, algorithms for machinery based interfaces are based on a machine language. Therefore, there are differences in algorithm on these two interfaces.
12
2.2.1 Algorithm for Optical Based Interface
The algorithm for optical based interface is illustrated in Fig. 2-3. First, images are obtained by the sensing component. Second, the region of interest is obtained through an image difference. Third, position and direction of hand are found by finger shape finding. Fourth, hand posture is recognized by checking hand posture classifications. Finally, these posture data are put into the application. In the second and third steps, the hand position is variously identified.
Fig. 2-3 Algorithm for optical based interface [10].
To verify hand position requires extracting hand position from a vast amount of data (Fig. 2-4). Typical hand segmentation techniques are based on stereo information, color, contour detection, connected component algorithms, and image differencing [10].
Fig. 2-4 Extracting hand position from reference. From left to right: input image, reference image, output image.
13 Each technique has its specific features:
Stereo image based segmentation is accomplished by analyzing relative depth
information between the hands and objects in an image, as shown in Fig. 2-5.
Color segmentation uses color as an index to separate hands from the
background, as shown in Fig. 2-6.
Contour detection is accomplished by detecting a hand shaped object in the
captured image, as shown in Fig. 2-7.
Connected component algorithms scan an image and groups its pixels into
components based on pixel connectivity, as shown in Fig. 2-8.
Image differencing analyzes differences between images to find hand position.
Fig. 2-5 Stereo image based segmentation. Left: original image. Right: processed image [11].
14
Fig. 2-7 Contour detection. Left: original image. Right: processed image [13].
Fig. 2-8 Connected component algorithm. Left: original image. Right: processed image [14].
Although these methods are able to identify hand position, there are still disadvantages for each technique:
Stereo image based segmentation requires a hardware setup that is currently
only found in laboratories.
Color segmentation is sensitive to changes in overall illumination. In addition,
it is prone to segmentation errors caused by objects with similar colors in the image.
15
stability is obtained by using a contour model and post-processing.
Connected component algorithms tend to be heavy in computational
requirements, making it impossible to search through the whole image in real-time.
Image differencing generally only works well for moving objects and requires
sufficient contrast between the foreground and background.
As a result, an optical based interface takes several steps to obtain the required data.
2.2.2 Algorithm for Machinery Based Interface
The algorithm for machinery based interface is illustrated in Fig. 2-9. Because users have to wear particular computerized clothing to operate the computer, hand postures can be identified through computerized clothing. Then gestures can be put into applications.
Fig. 2-9 Algorithm for machinery based interface.
Algorithm for machinery based interface takes only one step while the algorithm for optical based interface takes more than three steps. Algorithm differences between these two interfaces result from structural differences. A machinery based interface has a much more complicated structure which helps reduce algorithm complexity. An optical based interface has a much more complicated algorithm which helps reduce structural complexity. As a result, there is a tradeoff between algorithm complexity and structure.
16
2.3 Summary of 3D Interactive Systems
Current algorithms in 3D interactive displays depend on system structures. A simpler structure requires a more complicated algorithm to identify hand position. A more complicated structure requires a simpler algorithm. Therefore, a 3D interactive display is still not able to have a simple structure and a simple algorithm simultaneously. Besides, 3D interactive display volume is larger than a conventional flat panel display, a drawback for consumer applications. Current displays trend toward being thinner and lighter. 3D displays which provide 3D interactive functions and maintain their volume (as shown in Fig. 2-10 ) are what consumers want. The objective of this thesis is to produce 3D interaction without increasing volume. The volume of our 3D interactive display is the same as a flat panel display and uses embedded optical sensor panel. Furthermore, our algorithms match the simplicity of the machinery based interface.
Current depth information provided for 3D displays is only a few centimeters in height, which is very close to 3D panels. The interactive range for 3D interactive systems uses a camera as a sensing component and cannot be applied to the region near panels because of a limited capturing angle. In this thesis, an embedded optical sensor panel captures the image in the region near the 3D panel, which helps overcome the interactive range issue.
17
Chapter 3
Novel 3D Interactive Display
In order to overcome volume issue and interactive range issue, the novel 3D interactive display with embedded optical sensors is proposed. The proposed structure is based on mobile LCD applications. Therefore, the interactive range covers region close to panels.
3.1 Structure of 3D Interactive Display
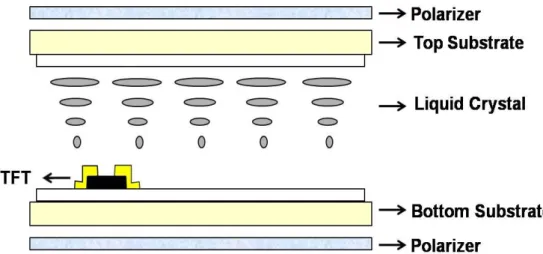
The 3D interactive display is proposed by combining a panel with embedded optical sensors and barriers. The cross section view of conventional flat panel display is shown in Fig. 3-1 and the cross section view of proposed structure is shown in Fig. 3-2. More than a display, there are 3D barrier and embedded optical sensor in the proposed structure. 3D barriers are composed of black strips which are design by using the drawing software (AutoCAD), as shown in Fig. 3-3. Width of these black strips is close to the pixel size which is about two hundred micrometer. This panel is the same as optical 2D touch panel. After adhering barriers to panel, display and interactive systems are completed. Barriers block half pixel from ambient light so that sensors receive different light intensities. In interactive system, barriers not only guide the left and right image pixels into different directions (Fig. 3-4), but also guide ambient light to be received by different sensors. The pixel layout is shown in Fig. 3-5. Each pixel contains four optical sensors: two sensors in blue subpixel and two sensors in green subpixel. By analyzing light distribution obtained from sensors, hand position can be identified without touching panel.
18
Fig. 3-1 Cross section view of conventional flat panel display.
Fig. 3-2 Cross section view of proposed structure.
19
Fig. 3-4 Barriers guide the left and right image pixels into different directions.
20
When humans wave their hands in front of the panel, ambient light is partially blocked. Light distribution on the panel is recorded by optical sensors. This light distribution data is mapped to a 10 bits data. Mapping processes are illustrated in Fig. 3-6. First, optical sensors turn received ambient light illumination into leakage currents. Second, these currents are mapped to voltages. Finally, these voltages are divided into a 10 bits data. Ambient light distribution can be identified by analyzing 10 bits data. A 10 bits data provides more precise hand identification.
Fig. 3-6 Data mapping processes.
3.2 Algorithms for 3D Interactive Display
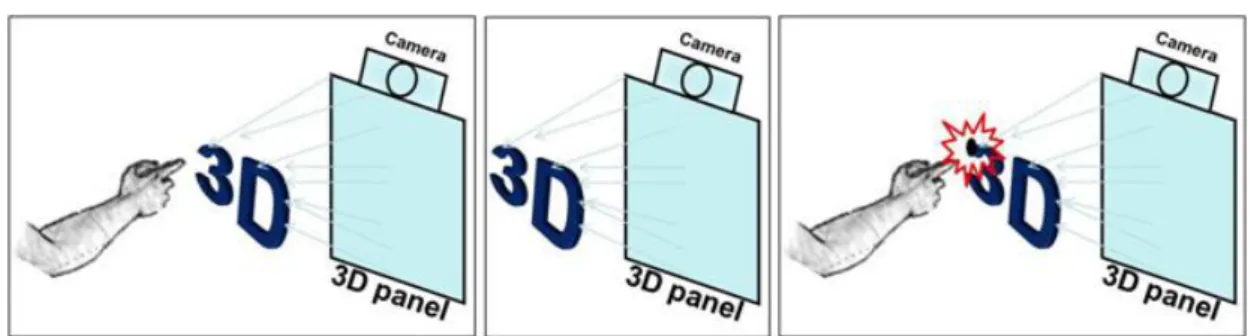
When humans wave their hand to operate a computer, the ambient light received by sensors is partially blocked by a hand and barriers (Fig. 3-7). First step to analyze ambient light is to group sensors into two groups: odd column sensors and even column sensors. We treat these two group sensors as human eyes. Odd column sensors are referred to left-eye sensors (L-sensor) and even column sensors are referred to right-eye sensors (R-sensor). For different environments, ambient light has two different conditions: one is bright state, another one is dark state. Therefore, algorithms for 3D Interactive Display have to be divided into two modes as well. Lighting mode is for dark state and blocking mode for bright state.
21
Fig. 3-7 Operating 3D interactive display.
3.2.1 Algorithms for 3D Interactive Display in Lighting Mode
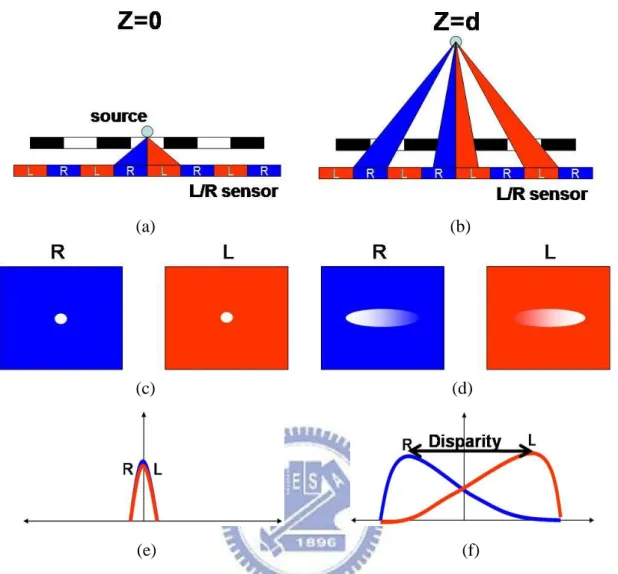
In lighting mode, we operate a computer by using a light source, as shown in Figs. 3-8(a) and (b). When object height is zero, the locations of maximum intensity received by L-sensor and R-sensor are under the light source. If object height increases, the locations of maximum intensity move away from the locations of zero object height. Light distributions of these two groups of sensors are shown in Figs. 3-8(c) and (d). Barriers guide ambient light so that light distributions are different with different object height. After horizontally plotting light distributions of these two groups of sensors in the same chart, these two charts are shown in Figs. 3-8(e) and (f). Each group has a peak in the chart. Distance between L-sensor peak and R-sensor peak is defined as ‘’Disparity’’. There is larger disparity because of higher object height. Light distributions of these two groups of sensors over whole panel are shown in Fig. 3-9. Coordinate z can be identified by disparity and coordinate x can be identified by middle point of these two peaks. Coordinate y can be identified by peak in light distribution plotted along direction of barrier strip (Fig. 3-10).
22 (a) (b) (c) (d) (e) (f)
Fig. 3-8 Algorithms for 3D interactive display in lighting mode, (a) object height is zero, (b) object height is d, (c) & (d) L-sensor and R-sensor light distributions, (e) & (f) L-sensor and R-sensor light distributions plotted in the same chart.
23
Fig. 3-10 Light distribution plotted along direction of barrier strip.
3.2.2 Algorithms for 3D Interactive Display in Blocking Mode
In blocking mode, we operate computer by using hand which blocks ambient light. Shadows increase as object height increases, as shown in Figs. 3-11(a) and (b). Variation in shadow size is enhanced because of barriers. Before barriers are adhered to panel, shadow size varies slowly as object height varies. After barriers are adhered to panel, shadow size varies noticeably as object height varies. Therefore, a minimized shadow size is observed when object height is zero. When object height increases, shadow size increases as well. Object height can be identified by analyzing shadow size. Coordinate x can be identified by middle point of shadow and coordinate y can be identified by a transitional point in light distribution plotted along direction of barrier strip. The transitional point is occurred at where light intensity changes rapidly.
24
(a) (b)
Fig. 3-11 Algorithms for 3D interactive display in blocking mode, object height is (a) zero, and (b) d.
The algorithms for the 3D interactive display depend on the geometrical structure of the 3D interactive display. The geometrical structure can be analytically described by mathematical model. Thus the algorithms for the 3D interactive display can be interpreted further by this mathematical model.
3.3 Mathematical Model for 3D Interactive Display
The algorithms for the 3D interactive display were developed from a geometrical structure. A side view of the geometrical structure in lighting mode is shown in Fig. 3-12 and the object is a light source. There are three parameters in the structure: d, β, and h. The disparity is denoted as d. The angle β is defined by two points where R-sensor and L-sensor receive maximum intensity and a vertex is where the light source is located. The object height is denoted as h which is given in Eq.3-1. In Eq.3-1, the object height is linearly proportional to the disparity because the cotangent
25
of angle β is a constant. Angle β is fixed because of the dependence on the structure. For a given structure and object height, 3D barriers block the major parts of sensors from light illumination. Sensors in a small region beneath the light source are illuminated. The R-sensor and L-sensor receive maximum illumination in this region. The locations of maximum illumination depend on glass thickness and the alignment between barriers and pixels. Illuminated region is larger because of higher object height, which results in a larger disparity. Therefore, the object height can be calculated by applying Eq.3-1.
Fig. 3-12 A side view of the geometrical structure in lighting mode.
h =
d2cot
𝛽2(3-1)
For a 3D interactive display operating in blocking mode, the light source was replaced with our hands and the light illumination was treated as a shadow. However, different objects have different shadow sizes. Instead of observing disparities,
26
variations in shadow size were observed to identify object heights. Therefore, Eq.3-1 was revised to Eq.3-2. When the object height is zero, the shadow size is denoted as D. In Eq.3-2, subtracting D from d provides information to identify object height. As a result, the object height was calculated in lighting and blocking modes.
h =
(d−D)2cot
2β (3-2)3.4 Summary
A panel with embedded optical sensors solved volume and interactive range issues. Algorithms for 3D interactive display in the lighting and blocking modes were developed based on panel structure. A mathematical model was also established to further interpret the algorithms. The panel and algorithms were applied in the following simulations and experiments to verify the proposed structure.
27
Chapter 4
Simulation for 3D Interactive Display
To verify the proposed 3D interactive display, simulations were proceeded. In the simulation results, the 3D interactive display was verified in bright and dark states. Furthermore, system tolerances were analyzed in both states to assure experimental results.
4.1 Simulation Results of 3D Interactive Display
Simulation results of a 3D interactive display operated in both states were completed using optical software (LightTools). A 2.83 inch QVGA panel with a VGA sensing resolution was built in the optical software. The environmental conditions were simplified to verify the proposed algorithms. In simulations, the only variable was the object height.
4.1.1 Simulation Results in Lighting Mode
When a 3D interactive display was operated in lighting mode, a point light source was used as an input device. The simulation model is shown in Fig. 4-1. A 2.83 inch panel with embedded optical sensors was illuminated using a light source. There were barriers on the panel. The barrier aperture ratio was 40% and the width of black and white segment was 354μ m which was twice the pixel size. Rays were guided by barriers so that there were disparities, as shown in Fig. 4-2. Disparities were used to identify z coordinates and the central point of these two peaks was used to identify x coordinates. Light distribution plotted along the barrier strip direction is shown in Fig.
28
4-3. The y coordinates are indicated by maximum light intensity in Fig. 4-3. Therefore, spatial object coordinates were identified by analyzing light distribution. The relation between heights and disparities is shown in Fig. 4-4. The object heights are linearly proportional to the disparities within 0-120mm. When object height exceeded 120mm, there was lack of effective rays in the optical software to analyze the model. Therefore, the object heights were not linearly proportional to the disparities when object height exceeded 120mm.
29
Fig. 4-2 Light distributions received by two groups of sensors in lighting mode.
Fig. 4-3 Light distribution in lighting mode plotted along the barrier strip direction.
0 0.2 0.4 0.6 0.8 1 1.2 1 9 17 25 33 41 49 57 65 73 81 89 97 105 113 121 129 137 145 153 161 169 177 185 193 201 209 217 225 233 241 249 257 265 273 281 289 297 305 In te n si ty (W /m m 2) Position(pixel) Odd Even Disparity(z) Central point(x) R-sensor L-sensor Y(pixel) Intensity(W/mm2) X(pixel) 0 0.2 0.4 0.6 0.8 1 1.2 1 11 21 31 41 51 61 71 81 91 Maximum(y)
30
Fig. 4-4 The relation between heights and disparities.
4.1.2 Simulation Results in Blocking Mode
When a 3D interactive display was operated in blocking mode, a hand was used as an input device. The simulation model is shown in Fig. 4-5. A planar light source whose position was fixed was built to simulate ambient light and a hand size opaque object was built to simulate a hand. The only variable was the hand height. Different shadows resulted from different hand heights, as shown in Figs. 4-6(a) and (b). The barriers enhanced differences between different shadows. When hand height was zero, the shadow size was about the size of a hand. The shadow size increased gradually as the hand height increased. According to the variation in shadow size, hand height was identified. The x coordinates were identified by a central point in the shadow. After the light distribution along barrier strip was plotted, a transitional point was identified, as shown in Fig. 4-7. The transitional point represented for coordinate y. As a result, spatial hand coordinates were identified by analyzing shadows. The relation between heights and variations in shadows is shown in Fig. 4-8. The hand heights were linearly
31
proportional to shadows within 0-45mm. When hand height exceeded 45mm, there was lack of effective rays in the optical software to analyze the model. Therefore, shadows were too blurry to identify hand heights after hand height exceeded 45mm.
32 (a)
(b)
Fig. 4-6 Light distribution in blocking mode, object height is (a) zero, and (b) d.
Fig. 4-7 Light distribution in blocking mode plotted along barrier strip direction.
-0.05 0 0.05 0.1 0.15 0.2 0.25 0 40 80 120 160 200 240 280 320 In te n si ty (W /m m 2) Position(pixel) Shadow -0.05 0 0.05 0.1 0.15 0.2 0 40 80 120 160 200 240 280 320 In te n si ty (W /m m 2 ) Position(pixel) Shadow -0.05 0 0.05 0.1 0.15 0.2 0.25 0 50 100 150 200 250 300 In te n si ty (W /m m 2) Position(pixel) Transitional point
33
Fig. 4-8 The relation between heights and shadow sizes.
The simulation model in blocking mode was more complex than in the lighting mode. Therefore, effective rays in optical software decreased quickly in blocking mode, which increased simulation errors. Interactive ranges were limited by errors. As a result, the interactive range in blocking mode was narrower than that in lighting mode. However, these interactive ranges were adequate for interacting with mobile displays image contents. According to the simulation results, system tolerances should also be taken into consideration.
4.2 System Tolerances of the 3D Interactive Display
Two different system tolerances were analyzed. First, impacts of lighting profiles on the relation between heights and disparities were discussed in lighting mode. For each lighting profile, a relation between the object heights and disparities was identified. The divergent angles of lighting profiles were 5, 14, and 45 degrees. Each divergent angle was aimed to analyze the relationship between divergent angles and maximum interactive ranges. Accordingly, a suitable lighting profile was adopted in experiments and applications.
0 5 10 15 20 25 30 0 10 20 30 40 50 60 70 80 90 100 S h a d o w S iz e( p ix el ) Height(mm)
34
Second, impacts of barrier alignments on relations between heights and shadows were discussed in blocking mode. Misalignments were two different conditions: one was a quarter of pixel size; another was half a pixel size. These analyses helped experiments to be proceeded.
4.2.1 Impacts of Lighting Profiles in Lighting Mode
The relationship between divergent angles and maximum interactive ranges was obtained through simulations using different lighting profiles, as shown in Fig. 4-9. The maximum interactive ranges were 120mm when lighting profiles of 5 and 14 degree divergent angles were used. The ranges were limited by lack of effective rays in the optical software when analyzing the model. However, the maximum interactive range was about 70mm when a lighting profile with 45 degree divergent angle was used. The range was narrower when a lighting profile with 45 degree divergent angle was used. Light distribution was more varied under light illumination with a larger divergent angle. A more varied light distribution resulted in a limitation of maximum interactive range. The light distribution was recorded using optical sensors so that disparities were analyzed to obtain the height of an object. Once maximum disparity was obtained, there was no larger disparity when object heights increased. Therefore, under the light illumination with a 45 degree divergent angle, disparities did not increase when object heights exceeded 70mm. Consequently, a lighting profile with a 14 degree divergent angle was suitable for experiments.
35
Fig. 4-9 The relation between heights and disparities under the illuminations of different lighting profiles.
4.2.2 Impacts of Barrier Misalignments in Blocking Mode
Aligning barriers and the panel differed from the process of adhering barriers to the panel. When aligning barriers and the panel, 0, 25 and 50 percentages of the misalignment were used. The relations between heights and shadow sizes under different percentages of the misalignment are shown in Fig. 4-10. These three curves largely overlapped. The maximum interactive ranges were all 45mm. As a result, the misalignments did not affect maximum interactive ranges.
0 100 200 300 400 500 600 700 0 20 40 60 80 100 120 140 160
D
is
p
a
ri
ty
(
p
ix
el
)
Height (mm)
36
Fig. 4-10 The relation between heights and shadow sizes under different percentages of the misalignment.
In lighting mode, lighting profiles with larger divergent angles had narrower interactive ranges than lighting profiles with smaller divergent angles did. Therefore, the lighting profile with a 14 degree divergent angle was adopted to be used in the experiment. In blocking mode, interactive ranges were the same under different percentages of misalignment. Consequently, misalignments did not affect interactive ranges.
4.3 Summary
Simulation results provided criteria to conduct experiments in lighting and blocking modes. According to simulation results, the maximum interactive ranges were 120mm in lighting mode and 45mm in blocking mode, which were adequate for interacting with mobile displays. Furthermore, system tolerance analyses showed that human factors would not greatly affect experimental results. Thus, these simulation results agreed with the proposed concept. Following these simulations, experiments were conducted to further verify the proposed structure.
0 5 10 15 20 25 0 5 10 15 20 25 30 35 40 45 50 55 60 65 70 75 S h a d o w S iz e (p ix e l)
Height (mm)
0% 25% 50%37
Chapter 5
Experimental Results
After simulations, experiments in lighting and blocking mode were conducted to further verify the 3D interactive display. A 2.83 inch QVGA panel with a VGA sensing resolution was used to capture images. Barriers were adhered to the panel. Experimental hardware was set up on an optical bread board to reduce artificial errors. All the experiments were conducted in a dark room and all the variables were fixed except object height. Thus a relation for identifying object heights was obtained.
5.1 Experiments in Lighting Mode
Experiments in lighting mode were conducted using a 14 degrees divergent angle white LED as an input device. To verify a relation between height and disparity, there was only light illumination from LED. The illumination intensity was about 3500 lux when the LED was driven by 3V. Barriers guided the light illumination so that disparities were observed. The experimental setup is shown in Fig. 5-1. An optical rail was used to help the light source to move vertically. The panel was maintained steadily. Therefore, all the parameters were fixed except object height. Images were captured through the panel, as shown in Fig. 5-2. Before images were analyzed to identify spatial coordinates, some image defects had to be eliminated. An object image minus a background image left a pure light distribution image. The background image was captured through the panel without any illumination. A flowchart of defects elimination is shown in Fig. 5-3.
38
Fig. 5-1 The experimental setup in lighting mode.
Fig. 5-2 The captured image.
Fig. 5-3 The flowchart of defect elimination.
Light Source Optical Rail Panel Light Source Optical Rail Sensors Panel
39
The object heights were identified by analyzing the defects eliminated images. Analyzed light distributions are shown in Figs. 5-4(a) and (b). There was the smallest disparity when object was zero. Disparities increased gradually as object heights increased. Therefore, object heights were identified through disparities. A relation between heights and disparities is shown in Fig. 5-5. The object heights were linearly proportional to disparities within 0-45mm. When object height exceeded 45mm, the illuminated area was larger than the panel. As a result, disparities did not change when object height exceeded 45mm. The central point of disparity represented for x coordinates. The y coordinates were indicated by maximum light intensity in Fig. 5-6. Therefore, spatial object coordinates were identified by analyzing light distribution.
(a)
(b)
Fig. 5-4 Light distributions received by two groups of sensors in lighting mode, object height is (a) 0mm, and (b) 10mm.
0 50 100 150 200 250 0 20 40 60 80 100 120 140 160 180 In te n si ty (G ra y Le v el ) Position(pixel) R-sensor L-sensor Disparity 0 50 100 150 200 250 0 20 40 60 80 100 120 140 160 180 In te n si ty (G ra y Le v el ) Position(pixel) R-sensor L-sensor Disparity
40
Fig. 5-5 The relation between heights and disparities.
Fig. 5-6 Light distribution in lighting mode plotted along the barrier strip direction.
After obtaining the maximum interactive range, 3D interactive display sensing resolution was verified. The sensing resolution was defined as the minimum distinguishable variation in height. In the workable interactive range, object heights were varied by 1mm intervals, as shown in Fig. 5-7. The disparities increased when heights increased by 1mm. Therefore, the sensing resolution was 1mm in lighting mode. 0 50 100 150 200 250 0 20 40 60 80 D is p a ri ty (p ix el ) Height(mm) 0 5 10 15 20 25 30 35 0 50 100 150 200 250 300 350 400 450 500 In te n si ty (G ra y L ev el ) Position(pixel)
41
Fig. 5-7 The relation between heights and disparities.
In addition to the maximum interactive range and the sensing resolution, environmental impact on the 3D interactive display was analyzed by varying the surrounding illumination intensity. Illumination intensities were 0, 50 and 330 lux. The relations between heights and disparities under different illumination intensities are shown in Fig. 5-8. The maximum interactive ranges were 45mm under three different illumination intensities, which resulted from a stable input signal. The input illumination intensity was so bright that surrounding illumination did not decrease input signal. Therefore, environmental impact was slight on the 3D interactive display in lighting mode. 0 15 30 45 60 75 90 0 1 2 3 4 5 6 7 8 9 10 11
D
is
p
a
ri
ty
(p
ix
e
l)
Height(mm)
42
Fig. 5-8 The relations between heights and disparities under different illumination intensities.
5.2 Experiments in Blocking Mode
When the 3D interactive display was verified in blocking mode, the experimental setup was almost the same as in lighting mode except the input device and ambient light condition. The LED was replaced by a hand size opaque object and a table lamp whose illumination intensity was about 700 lux was used to provide planar light illumination. The planar light illumination reduced the ambient complexity. The experimental setup is shown in Fig. 5-9. Images were captured through the panel, as shown in Fig. 5-10. Before images were analyzed to identify spatial coordinates, some image defects had to be eliminated. A background image minus an object image left a pure shadow image. The background image was captured through the panel without any input device. A flowchart of defects elimination is shown in Fig. 5-11. The shading areas became brighter than the illuminated areas due to the defects elimination process. 0 50 100 150 200 0 5 10 15 20 25 30 35 40 45 50 55 60 65 D is p ari ty (p ix el ) Height(mm)
43
Fig. 5-9 The experimental setup in blocking mode.
Fig. 5-10 The captured image.
Fig. 5-11 The flowchart of defect elimination.
Optical Rail Panel Object Table Lamp Table Lamp Optical Rail Sensors Panel Object
-
=
44
The object heights were identified by analyzing the defects eliminated images. Analyzed shadows are shown in Figs. 5-12(a) and (b). Shadows increased gradually as object heights increased. Therefore, object heights were identified through shadows. A relation between heights and variations in shadow sizes is shown in Fig. 5-13. The shadow size was about object size when object height was zero. The shadow sizes changed linearly before object height exceeded 50mm. When object height exceeded 50mm, shadows were too blurry to identify object heights. The x coordinates were identified by a central point in the shadow. After the light distribution along barrier strip was plotted, a transitional point was identified, as shown in Fig. 5-14. The transitional point represented for coordinate y. As a result, spatial hand coordinates were identified by analyzing shadows.
45
(a)
(b)
Fig. 5-12 Shadows in blocking mode, object height is (a) 15mm, and (b) 35mm.
Fig. 5-13 The relation between heights and shadow sizes. 0 20 40 60 80 100 120 140 160 180 0 100 200 300 400 500 600 700 In te n si ty (g ra y le v el ) Position(pixel) Shadow 0 20 40 60 80 100 120 140 160 180 0 100 200 300 400 500 600 700 In te n si ty (g ra y le v el ) Position(pixel) Shadow 0 15 30 45 60 75 90 105 120 0 10 20 30 40 50 60 70 80 S h ad o w S iz e(p ix el ) Height(mm)
46
Fig. 5-14 Light distribution in blocking mode plotted along barrier strip direction.
After obtaining the maximum interactive range, 3D interactive display sensing resolution was verified. In the workable interactive range, object heights were varied by 1mm intervals, as shown in Fig. 5-15. The shadow sizes increased when heights increased by 5mm. Therefore, the sensing resolution was 5mm in blocking mode.
Fig. 5-15 The relation between heights and shadow sizes.
0 20 40 60 80 100 120 140 160 0 50 100 150 200 250 300 350 400 450 500 In te n si ty (G ra y L ev el ) Position(pixel) 0 3 6 9 12 15 0 1 2 3 4 5 6 7 8 9 10 11 S h ad o w S iz e(p ix el ) Height(mm)
47
5.3 Summary
The interactive ranges were 45mm in lighting mode and 50mm in blocking mode, which were adequate for interacting with mobile displays. The lighting profile in lighting mode was more varied than the shadow in blocking mode did. Therefore, a maximum disparity in lighting mode was obtained for a lower height. As a result, the interactive range in lighting mode was slightly narrower than that in blocking mode. In the interactive range, a sensing resolution was inversely proportional to minimum distinguishable height. Therefore, the sensing resolution in lighting mode was higher than that in blocking mode. Furthermore, the 3D interactive display in lighting mode was verified to be workable under different illumination intensities. Consequently, the experimental results agreed with the proposed concept.
48
Chapter 6
Conclusions and Future Works
6.1 Conclusions
The 3D interactive display is a potential future display system, not only displaying 3D images but also providing 3D interactions. Nevertheless, system volume and interactive range are still issues when users operate the 3D interactive display.
In this research, a 3D interactive display system with embedded optical sensors was proposed and demonstrated to overcome system volume and interactive range issues. The experimental results showed that the interactive ranges were 45mm in lighting mode and 50mm in blocking mode. The lighting profile in lighting mode was more varied than the shadow in blocking mode did. Therefore, a maximum disparity in lighting mode was obtained for a lower height. As a result, the interactive range in lighting mode was slightly narrower than that in blocking mode. For mobile LCD applications, these interactive ranges were adequate due to depth information provided by a mobile LCD which was within 50mm [15]. Furthermore, the sensing resolutions were 1mm in lighting mode and 5mm in blocking mode. In lighting mode, a 1mm sensing resolution provided humans a large operational flexibility. However, in blocking mode, a 5mm sensing resolution was adequate for a 3D interactive display to interact with a 5mm finger. As a result, the proposed system produced 3D interaction without increasing system volume and included the region close to the panels into interactive range simultaneously.
49
The proposed system was verified under controlled ambient and experimental conditions. When conducting experiments, input devices were moved vertically in a dark room. Therefore, to implement the proposed system in applications, there must be system and algorithms modifications.
6.2 Future Works
The proposed system was designed to be used in mobile LCD applications. When implementing the proposed system in applications, ambient conditions and object movements will differ from that in experiments. In the experiment, input devices were moved vertically, however, under real conditions, a variety of movements will be required. Therefore, the computer vision technology should be applied in algorithms for lighting and blocking modes to have abilities to analyze oblique input signals [16], as shown in Figs. 6-1(a) and (b).
(a) (b)
Fig. 6-1 3D interactive display operated by different input signals (a) vertical input signals, (b) oblique input signals.
Sensor Barrier
Z
Y
X
Sensor BarrierZ
Y
X
50
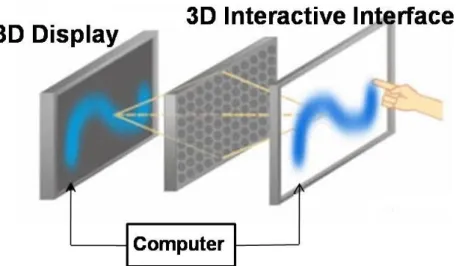
Although the experimental results showed that the proposed system was applicable to mobile LCD applications, there is still room for improvement in blocking mode sensing resolution. Images which were captured by the panel with embedded optical sensors were too blurry to have a higher sensing resolution. A panel with embedded infrared transmitters and receivers (T/R) could capture clearer images by emitting infrared and receiving infrared which is reflected by input devices, as shown in Fig. 6-2. Therefore, the panel with embedded infrared T/R could be a possible solution. As a result, a 3D interactive display using the panel with embedded infrared T/R and applying algorithms will provide humans a more convenient interface in the future.
Fig. 6-2 A panel with embedded infrared transmitters and receivers (T/R) [17].
Transmitter
Receiver
LCD
51
References
[1] N. Holliman, 3D Display Systems, University of Durham, 3, Feb. (2005). [2] 42-inch 3D display, from Philips:
http://www.business-sites.philips.com/3dsolutions/3ddisplayproducts/42inch3ddi splay/index.page.
[3] A. Olwal, S. DiVerdi, N. Candussi, I. Rakkolainen and T. Höllerer, ‘‘An Immaterial, Dual-sided Display System with 3D Interaction,’’ Proceedings of VR
2006 (IEEE Virtual Reality Conference 2006), pp. 279-280, 2006.
[4] Iphone, from Apple: http://www.apple.com/iphone/gallery/#image1.
[5] R. Downs, ‘‘Using resistive touch screens for human/machine interface,’’ Analog
Applications Journal, 2005.
[6] H. Nakamura, T. Nakamura, H. Hayashi, N. Tada, M. Yoshida, M. Ishikawa, T. Motai and T. Nishibe, ‘‘Touch Panel Function Integrated LCD Using LTPS Technology,’’ IDW/AD, pp.1003-1006, 2005.
[7] K. Hopf, ‘‘Novel Autostereoscopic Single-User Displays with User Interaction,’’
Proc. of SPIE, Vol. 6392, 639207, 2006.
[8] Haptic Workstation, from the:
http://www.inition.co.uk/inition/product.php?URL_=product_glove_immersion_ hapticworkstation&SubCatID_=37.
[9] K. Hopf, ‘‘Novel User Interaction Technologies in 3D Display Systems,’’
IMID’07 DIGEST, pp.1227-1230, 2007.
[10] C. Hardenberg and F. Bérard, ‘‘Bare-Hand Human-Computer Interaction,’’
Proceedings of ACM Workshop on Perceptive User Interfaces (PUI), 2001.
[11] Stereo image based segmentation, from the:
http://www.ece.cmu.edu/~ece796/project99/4/segment.html [12] Color Image Segmentation, from the:
http://www.cs.cmu.edu/~dst/Tekkotsu/Tutorial/colorsegment.shtml
[13] C. Grigorescu, N. Petkov, and M. Westenberg, ‘‘Contour Detection Based on Nonclassical Receptive Field Inhibition,’’ IEEE Tran. Image Processing, Vol. 12, pp. 729-739, July 2003.
[14] Connected Components Labeling, from the: http://homepages.inf.ed.ac.uk/rbf/HIPR2/label.htm
[15] G. Jones, D. Lee, N. Holliman, D. Ezra, ‘‘Controlling Perceived Depth in Stereoscopic Images,’’ Proceedings of the SPIE, Vol.4297A, 2001.
52
[16] Computer Vision, from the: http://en.wikipedia.org/wiki/Computer_vision
[17] S. Hodges, S. Izadi, A. Butler, A. Rrustemi and B. Buxton, ‘‘ThinSight: Versatile Multi-touch Sensing for Thin Form-factor Displays,’’ UIST’07, 2007.
![Fig. 1-3 Three types of touch panels. From left to right: resistive [5], capacitive, and optical [6]](https://thumb-ap.123doks.com/thumbv2/9libinfo/8214151.170195/12.892.123.760.876.1019/fig-types-touch-panels-right-resistive-capacitive-optical.webp)
![Fig. 2-5 Stereo image based segmentation. Left: original image. Right: processed image [11]](https://thumb-ap.123doks.com/thumbv2/9libinfo/8214151.170195/23.892.141.756.498.728/stereo-image-based-segmentation-left-original-right-processed.webp)
![Fig. 2-8 Connected component algorithm. Left: original image. Right: processed image [14]](https://thumb-ap.123doks.com/thumbv2/9libinfo/8214151.170195/24.892.139.770.506.745/connected-component-algorithm-left-original-image-right-processed.webp)