於水稻中持續表現植物硫鐵蛋白可增強水稻光合作用碳固定效率
39
0
0
全文
(2) Table of contents Page Table of contents…………………………………………..………………………………1 List of figures…………...………………………………………….…………………………3 Chinese abstract………………………………………………………………………………4 English abstract……………………………………………………………………………….5 Chapter I Introduction………………………………………………………….……………..7 Chapter II Materials and methods…………………………………………………………...10 2.1 Plant materials and growth condition…………………………………………………....10 2.2 Genomic DNA extraction and Genomic DNA PCR…………………………………….10 2.3 RNA extraction, Reverse transcription PCR and Quantitative reverse transcription PCR………………………….…………………………………………..…….………...10 2.4 Determination the content of chlorophyll, protein and western blot analysis…………...11 2.5 Gas exchange rate and chlorophyll fluorescence measurement………............................12 2.6 Soluble sugars and starch contents assay…………………………………………..……12 2.7 Crop yield assay.……………………………………….………………………..……….12 2.8 Bacterial blight inoculation…………………………………………….………………..13 2.9 Statistical analysis.............................................................................................................13 Chapter III Results 3.1 Constitutive expression of pflp in transgenic rice…………….…………………………14 3.2 PFLP can increase the capacity of photosynthetic electron transport…………………...14 3.3 PFLP can enhance rate of photosynthetic gas exchange rate in pflp transgenic lines…………………………………………….……..…………………………………15 3.4 Highly contents of soluble sugar and starch accumulate in transgenic rice results from relative high expression pattern of carbohydrate metabolism related gene……...……15 3.5 Analysis of crop yield in pflp transgenic lines………………………………….……….16 3.6 pflp transgenic lines maintain photosynthetic gas exchange rate after a bacterial 1.
(3) pathogen infection……………………………………………………………………….16 Chapter IV Discussion…………………………………………………………………….18 Chapter V Reference…………………………………………………………..…….………32 Chapter VI Supplemental table……………………………………..………….……………36. 2.
(4) List of figures Page Table I. The efficiency of PSII electron transport………………..……….…………………21 Table II. The crop yield in WT and pflp transgenic lines…………………….……………..21 Fig 1. Isolation and characterization of pflp transgenic lines………………………………..23 Fig 2. Analysis of the expression pattern of osferredoxin-1 in pflp transgenic plants…........24 Fig 3. Electron transport rate in pflp transgenic lines and WT………………………………25 Fig 4. The capacity of gas exchange rate and stomatal conductance in pflp transgenic lines…...…………………………………………………………26 Fig 5. Soluble sugars and starch content in pflp transgenic lines……….…..……………….27 Fig 6. The expression pattern of carbohydrate metabolism related genes………...……...29 Fig 7. The grain starch content in pflp transgenic lines…………...……………………..…30 Fig 8. The pattern of photosynthetic gas exchange rate during the pathogen infection…..…31. 3.
(5) 於水稻中持續表現植物硫鐵蛋白可增強水稻光合作用碳固定效率 指導教授:葛孟杰博士 國立高雄大學生物科技研究所. 學生:鄭執甫 國立高雄大學生物科技研究所 摘要 光合作用主要是植物吸收光能後將二氧化碳固定成各種醣類,例如: 作為能量利用的葡萄糖與果 糖,作為運輸用的蔗糖與儲存用的澱粉。第一型硫鐵蛋白廣泛分布在植物綠色組織中,其主要在電子 傳遞鏈中扮演傳遞電子的角色。從甜椒萃取之植物硫鐵蛋白(Plant Ferredoxin-Like Protein,PFLP)經 蛋白質序列比對後發現,其序列與阿拉伯芥、蕃茄、水稻及菠菜之第一型硫鐵蛋白有高度同源性。先 前研究發現pflp轉殖植物在病原菌感染後可大幅產生過氧化物(Reactive oxygen species, ROS),進而誘 導過敏反應產生。由於PFLP屬於光合作用第一型硫鐵蛋白,此暗示過表現植物硫鐵蛋白於轉殖植物 中可能經由加強光合作用與糖類代謝來增加抵抗病原菌的能力。為了探討上述機制的可能性,花椰菜 鑲嵌病毒35S啟動子(CaMV 35S promoter)被用來大量表現PFLP蛋白於水稻中,並且分析轉殖水稻的光 合作用效率。經由反轉錄聚合酶鏈式反應及西方墨點法確認pflp轉基因以成功表現並累積PFLP蛋白於 轉殖水稻中。實驗結果顯示轉殖水稻具有較高的電子傳遞能力與氣體交換速率。在醣類含量方面,轉 殖水稻均具有高含量的果糖,葡萄糖,蔗糖與澱粉。而轉殖水稻中醣類合成相關基因轉錄活性大多高 於野生型水稻2至4倍。上述結果證實轉殖水稻含有較高之醣類累積是導因於其具有較高電子傳遞效率、 較高氣體交換速率與較強醣類合成相關基因表現。在產量分析方面,轉殖水稻無論是在單株實粒重、 單株分穗數或種子內澱粉含量均高於野生種水稻。此外,以病原菌接種植株後,偵測氣體交換速率變 化,發現轉殖株在此期間可維持氣體交換速率;而野生型之氣體交換速率則明顯的下降。綜合上述結 果,本篇論文指出於水稻中持續表現pflp可增強光合作用碳固定效率,並進而提升水稻產量。 關鍵字:植物硫鐵蛋白,光合作用,產量. 4.
(6) Constitutive Expression of a Plant Ferredoxin-like Protein (pflp) in Transgenic Rice Enhances Capacity of Photosynthetic Carbon Assimilation Advisor: Dr. Mang-Jye Ger Institute of Biotechnology National University of Kaohsiung Student: Chin-Fu Cheng Institute of Biotechnology National University of Kaohsiung Abstract Photosynthesis is the major metabolic pathway that converts carbon dioxide (CO2) into organic compounds, such as fructose, glucose, sucrose, and starch in plant. Ferredoxin-I (Fd-I) protein, known as an electron carrier in photosynthesis, generally exists in green tissue. The protein sequence of the plant ferredoxin – like protein (PFLP), isolated from sweet peppers, shows high homology to the Fd-I sequence of Arabidopsis thaliana, Lycopersicon esculentum, Oryza sativa and Spinacia oleracea. Previous studies reported that constitutive expression of pflp in transgenic plants exhibit host resistance to virulent bacterial pathogens. The disease resistance of transgenic plants result from the induction of reactive oxygen species (ROS) generation. It is possible that PFLP could enhance photosynthetic efficiency. In order to assess this possibility, pflp transgenic rice was generated and studied their capacity of photosynthetic carbon assimilation. In this report, two transgenic lines of rice (pflp-1 and pflp-2) showed that the pflp transgenic rice exhibit highly photosynthesis efficiency. As comparing the photosynthetic gas exchange rate, the pflp-1 and the pflp-2, respectively, exhibited 1.3- and 1.2-fold higher than the wild type (WT). The capacity of photosynthetic electron transport of two transgenic lines are significantly higher than WT. Additionally, the fructose, glucose, sucrose and starch contents in the pflp-1 and pflp-2 transgenic lines were higher than those of the WT. The transcript activity of carbohydrate metabolism related genes in transgenic lines were higher than those that of WT. In crop yield, on grain weight per plant the pflp-1 and the pflp-2 showed 1.7and 1.3-fold higher than WT. As for the number of panicles per plant, the pflp-1 and the pflp-2 are increased 1.4- and 1.5-fold higher than the WT. In addition, we demonstrated that the transgenic rice maintain normal photosynthetic gas exchange rate on the period of pathogen infected. Taken altogether; we 5.
(7) demonstrate that constitutive expression of pflp in transgenic rice could enhance capacity of photosynthetic carbon assimilation and increase crop yield. Keywords: plant ferredoxin – like protein (PFLP), photosynthesis, crop yield. 6.
(8) Introduction Rice (Oryza sativa) is the most important crop in the world for feeding more than half of population in the world. The demand for increasing rice production is particularly urgent, because the population of traditional rice-producing countries will require 70% more rice demand by 2025 year (Swaminathan, 2007). Hence, it is important for increasing the crop yield to meet the growing demand. Photosynthesis is the major metabolic pathway that converts carbon dioxide (CO2) into organic compounds, such as fructose, glucose, sucrose, and starch in plant. During photosynthesis, inorganic CO2 are converted to triose-phosphates and then exported to the cytosol where they were used to synthesize sucrose. Some reduced sugars, like glucose and fructose are retained in the chloroplast to synthesize starch for transient store. In most plants, light absorption by light-harvesting complex II (LHCII) make electron excited and then photosystem II (PSII) would drive subsequent electron transformations in the thylakoid membrane. In PSII, water is oxidized by water:plastoquinone oxidoreductase and then plastoquinone (PQ) are reduced (Kern and Renger, 2007). Electrons are transferred from plastoquinol (PQH) to plastocyanin (PC) by the cytochrome b6f complex (Cyt b6f) (Arnon, 1971). Then, PC carries the electrons from Cyt b6f and then PC reduces P700 of photosystem I (PSI) which lead to the reduction of ferredoxin (Fd) at the stromal side of thylakoid membrane. Electrons are donated to Fd from PSI which is accessible to stromal Fd-dependent enzymes, such as Fd: NADP+ reductase (FNR). FNR generates NADPH which mainly consumes in the calvin cycle (Brettel and Leibl, 2001), and thus forming a linear electron flow. On the other hand, both Fd and NADPH have the capacity which could return electrons to the plastoquinone (PQ) pool, forming a cyclic electron flow (Joliot et al., 2006; Joliot et al., 2002; Munekage et al., 2004). The electron cycles between PSI and PQ pool generates ΔpH gradient, and ΔpH gradient drives ATP synthesis through ATP synthetase. In electron transport chain, photosystem I (PSI) donates the electrons to [2Fe-2S] structure Fd. The electrons are transported through the photosystems for reducing Fd. Reduced Fd interacts with the enzyme ferredoxin: thioredoxin reductase (FTR) and then reduces the thioredoxin (Trx).When the Trx is reduced, it interacts with specific disulfide bonds on target proteins which involve in the Calvin cycle to regulate their activity. Calvin cycle is the metabolism that CO2 was catalyzed to triose-phosphate. At first, ribulose 1, 5-bisphosphate carboxylase/oxygenase (Rubisco) catalyzes CO2 to 3-phosphoglycerate 7.
(9) (3-PGA) .3-PGA would be catalyzed to fructose-1, 6-phosphate (F-1, 6-BP). F-1, 6-BP is catalyzed to fructose-6-phosphate (F-6-P) by plastidic fructose 1, 6- bisphosphatase (pFBPase). F-6-P is converted to erythrose-4-phosphate (E-4-P).E-4-P is catalyzed to sedoheptulose-7- phosphate (S-7-P) by sedoheptulose 1, 7- bisphosphatase (SBPase) in the chloroplast (Schurmann and Buchanan, 2008). Plants utilize the gas exchange capacity to absorb the CO2 which is the substrate for producing sugar synthesis. Six moles of CO2 are catalyzed to two mole of glyceraldehyde-3-phosphate (G-3-P) in Calvin cycle in the chloroplast. The G-3-P is converted to dihydroxyacetone phosphate (DHAP) by triosephosphate isomerase and which would be transported to cytosol. The cytosolic DHAP and G-3-P are catalyzed to F-1, 6-P by cytosolic fructose-1, 6-aldolase, and then F-1, 6-P is dephosphorylated to F-6-P by cytoclic fructose-1, 6-phosphatase (cFBPase). F-6-P is converted sucrose via sucrose phosphate synthase (SPS) in cytosol (Noguchi and Yoshida, 2008). In other hands, F-6-P is converted to glucose-1-phosphate (G-1-P) in the chloroplast via phosphoglucoisomerase and phosphoglucomutase. G-1-P is converted to ADP-glucose via ADP-glucose pyrophosphorylase (AGPase) which is the key enzyme in starch synthesis (Orzechowski, 2008). AGPase have several isoforms in different tissue. In the plastid of leaf, AGPS2a and AGPL3 are responsible for starch synthesis (Lee et al. 2007). Sucrose is the major transport form; it is catalyzed to free hexose (glucose and fructose) via invertase (Koch, 2004; Lunn and MacRa, 2003). The free hexose is phosphated by hexokinase (HXK) and then it will be utilized starch synthesis or other metabolism (Gibson, 2000). PFLP (plant ferredoxin-like protein) was isolated from sweet pepper which contains an N-terminal signal peptide responsible for chloroplast targeting and a putative 2Fe-2S domain. PFLP shows high homology to the ferrdoxin-I (Fd-I) sequence of arabidopsis thaliana (54%), maize (48%), oryza sativa (56%) and spinacia oleracea (54%) (Dayakar et al., 2003). Constitutive expression of the pflp in transgenic plants, such as tobacco, arabidopsis, calla lily, oncidium orchid and rice, which could enhance host resistance to virulent bacterial pathogens (Dayakar et al., 2003; Chan et al.,2005; Yip et al., 2007; Tang et al., 2001; Liau et al., 2003). The disease resistance of transgenic plants results from the induction of reactive oxygen species (ROS) generation. It has been reported that sucrose was catalyzed to glucose which could play a role as signal to regulate PR gene expression, via hexokinase-dependent pathway and glycolysis-dependent 8.
(10) pathway (Xiao et al., 2000, Biemelt and Sonnewald, 2006). Cho et al., (2009) reported that osHXK5 and osHXK6 play a role as glucose sensors. It will interest to reveal the role of PFLP in improving disease resistant activity through enhancing photosynthesis efficiency to influence sugar metabolism. Some reports indicated that decreasing the content of Fd changes electron distribution, limits photosynthesis and retards the growth (Hanke and Hase, 2008; Holtgrefe et al., 2003; Voss et al., 2008). Yamamoto et al. (2006) indicated that over-expression of Atferredoxin-2 in tobacco could stimulate cyclic electron flow as well as enhancing non-photochemical quenching of chlorophyll fluorescence. These studies only emphasized the function of Fd in the photosynthetic electron transport flow. There is few report indicates that altering Fds expression level would influence sugar metabolism and subsequently affect crop yield. In order to assess the possibility that PFLP may increase photosynthesis efficiency and sugar metabolism, pflp transgenic rice were generated and studied their capacity of photosynthetic carbon assimilation. Two transgenic lines, pflp-1 and pflp-2, were used to determine whether transgene pflp could promote photosynthetic carbon assimilation. The electron transport efficiency and gas exchange rate in pflp transgenic lines were higher than those of WT. Both of two pflp transgenic lines contained higher contents of glucose, fructose and sucrose compared with WT. The transcription level of carbohydrate metabolism related genes, including HXK, FBPase, SBPase, AGPase and SPS in pflp transgenic lines increased 2~4 fold higher than those of WT. Two pflp transgenic lines, but not WT, exhibited that it maintain photosynthetic gas exchange rate after pathogen infection. In this report, we demonstrate that constitutive expression pflp in transgenic rice can increase photosynthesis efficiency, capacity of sugar synthesis and crop yield.. 9.
(11) Materials and methods Plant materials and growth condition Greenhouse grown rice (Oryza sativa, ‘Tainung 67’Japonica, Taiwan) was mainly used in following experiments. Plants grew under natural sun light at 28°C to 34°C, and treated 40 - 50% relative humidity in the greenhouse of Southern Taiwan Science Park and Institute of Plant and Institute of Plant and Microbial Biology in Academia Sinica. In institute of biotechnology at National University of Kaohsiung, plants were grown at 16/8 h day - night cycles at 30°C in growth chambers. Plant grew in the greenhouse of Southern Taiwan Science Park and Institute of Plant and Institute of Plant and Microbial Biology in Academia Sinica which was used to measured the capacity of electron transport and photosynthetic gas exchange rate. Plant grew in the greenhouse of Southern Taiwan Science Park which was used to detect the crop yield.. Genomic DNA extraction and Genomic DNA PCR Genomic DNA was extracted from flag leaf by using DNeasy Plant Maxi Kit (Qiagen, Turnberry Lane, USA). For genomic DNA amplification, 0.1μg genomic DNA was used for 30 μl PCR reaction per tube. The PCR conditions were that the first cycle at 95°C for 5 min, then the 30 cycle numbers each gene product 1 min at 95°C, 1 min at 55°C and 1 min at 72°C. The final extension was 7 min 72°C for extending PCR products. The PCR products were visualized on a 1.5% (W/V) agarose gel.. RNA extraction, Reverse transcription PCR and Quantitative reverse transcription PCR Total RNA was isolated from the flag leaves of rice (0.5 g fresh weight) using Trizol reagent according to the RNA extraction manual (Molecular research center, Cincinnati, USA). To eliminate any DNA contamination, total RNA was treated with DNase I. The total RNA was reverse transcripted into cDNA using ImProm-IITM Reverse Transcription System (Promage, Madison, USA) with an oligo dT primer. For cDNA amplification, 2 μg cDNA was used for 20 μl PCR reaction per tube. The RT-PCR condition was the first cycle at 95°C for 5 min, and then the optimized cycle numbers for each gene product followed 30 sec at 95°C, 1 min at appropriate temperature and 40 sec at 72°C. The final extension was at 72°C for 7 min. HXK5, HXK6 and SBPase underwent 22 cycles of PCR. AGPL3 underwent 10.
(12) 23 cycles of PCR. AGPS2a, cFBPase, pFBPase and α-tubulin underwent 25 cycles of PCR. PCR products were visualized on 2% (W/V) agarose gel. The Q-PCR was performed with an Applied Biosystems StepOne Real Time PCR System (Applied Biosystems Inc., Foster, USA), using the Power SYBR Green PCR Master Mix (Applied Biosystems Inc., Foster, USA). 2 μg cDNA was used for 20 μl Q-PCR reaction per tube. The PCR program was the first cycle at 95°C for 10 min, and then following 15 sec at 95°C, 30 sec at appropriate temperature underwent 35 cycles for each gene product. Melting curve program was 15 sec at 95°C, 30 sec at 55°C. The represented values refer to Livak and Schmittgen (2001). α-tubulin set to 1 and used as an internal control.. Determination the content of chlorophyll, protein and western blot analysis Chlorophyll a and chlorophyll b was extracted from the second leaf, which is the apex was sampled, with 80% acetone. Determination of total chlorophyll a/b content was according to Lichtenthaler (1987) and then measuring the absorbance of extraction solution at 663.2 nm, 646.8 nm and 470 nm. Chlorophyll a = (2× ((12.7×OD663)-(2.69×OD645)) /weight of sample (mg) Chlorophyll b = (2× ((22.9×OD645)-(4.68×OD663)) /weight of sample (mg) Total proteins were isolated from flag leaves (1 g fresh weight) using 0.5 M Tris-HCl buffer (20 mM Tris-HCl, pH 8.0, 1 mM EDTA, 2% (V/V) β-mercaptoethanol, 1mM phenylmethlsulfonyl (PMSF), 1% (W/V) PVP40 (Polyvinylpyrrolidone), 20mM MgCl2 and 0.05 % (W/V) SDS). Grind leaf tissue on liquid nitrogen and incubate on ice for 15 min. Spinning the pellet down at 13000 rpm for 15 min at 4°C and collecting the aqueous phase to a new tube. Determining the protein content using Bio-Rad Protein assay (Bio-Rad, Philadelphia, USA) and measuring the protein concentration by spectrophotometer (BioTek, Winooski, Vermont, USA), detecting the absorbance at 595 nm after 20 min. Bovine serum albumin (BSA) was used to standard curve. Proteins were separated on 15% SDS-PAGE and electrophoretically transferred onto PVDF-plus membrane (Micron Separations). Blots were probed with 500-diluted anti-PFLP polyclonal antibody and according to the western blot AP system manual (Invitrogen, Taipei, Taiwan) to visualize the signal.. 11.
(13) Gas exchange rate and chlorophyll fluorescence measurement Gas exchange rate was measured with an LI-COR 6400 Infrared gas analyzer (LI-6400, Li-Cor Inc., Lincoln NE, USA) in the second leaf. The light source was a blue-red light emitting diode (6400-02, Li-Cor Inc., Lincoln NE, USA). External air scrubbed CO2 and mixed with a supply of pure CO2 to result in a reference concentration of 400 μmol m-2s-1. Flow rate was 500 μmol m-2s-1. Temperature of the leaf chamber maintained at 30°C and relative humidity maintained about 40-50% (Scafaro et al., 2010). Electron transport chain was measured by using a portable chlorophyll fluorometer (PAM-210 WALZ, Germany). Leaf was kept in the dark at 10 mins before measurement. The maximum quantum efficiency of PSII photochemistry (Fv/Fm), PSII maximum efficiency (Fv’/Fm’), photochemical quenching (qP), nonphotochemical quenching (NPQ) and electron transport rate (ETR) were calculated according to Baker (2008).. Soluble sugars and starch contents assay Soluble sugar (sucrose, glucose, fructose and starch) were extracted from the second leaf of 3-month-old plants. For determining soluble sugar content, the leaf were homogenized and extracted by a hot 80% ethanol as described by Wang et al., (2000) Sugars were separated on an HPAEC-PAD (Dionex Corporation, Sunnyvale, CA, USA) with a Dionex CarboPac PA10 column (2 mm diameter) using 18 mM NaOH as eluant and quantified by a Dionex Pulsed Amperometric Detector (Wang et al., 2008). For leaf and seed starch content determination are according to Chen et al., (2008). The 2, 2-azino-bis-3-ethylbenzthiazoline-6-sulfonic acid (ABTS) (Sigma, Steinheim, Germany) is used to determination of starch content and potato starch (Sigma, Steinheim, Germany) as standard for the color reaction and then measuring the absorbance of the reaction at 405 nm. Crop yield assay The filled grains were took apart at 3.5-month-old plants, independently counted and weighed. The following agronomic traits were scored: number of tillers, number of panicles, weight of panicles (g), and total grain weight (g). The results were separately analyzed by one-way ANOVA from independent lines and compared with WT.. 12.
(14) Bacterial blight inoculation Xanthomonas campestris pv. oryzae (Xoo) was used in this study. The isolate was grown at 30°C for 72 hours on peptone sucrose agar medium (Tsuchiya et al., 1982). Xoo were cultured in NB (nutrient broth) medium containing 0.5% beef extract, 0.1% peptone, 0.2% NaCl at 28°C and 24 hours with shaking at 175 rpm. The culture was allowed to grow to A600 = 1.0. Three-month-old pflp transgenic plants with merging flag leaves were cut 3 cm from the tip of fully expanded leaves using scissors dipped in a bacterial suspension.. Statistical analysis When applying statistics a one-way ANOVA was used with a 5% LSD Means Test in cases of multiple comparisons. The statistical analysis was carried out using Cohort statistical analysis software (Ver.6, Cohort). Values based on the means ± SE of 3–8 experimental replicates.. 13.
(15) Results Constitutive expression of pflp in the transgenic rice The constructed pflp cDNA for transformation was designated as pBISPFLP (Huang et al., 2004). The transgenic rice seeds were supplied from the laboratory of Dr. Feng (Institute of Plant and Microbial Biology, Academia Sinica). Two lines, pflp-1 and pflp-2, were subjected to genomic PCR analysis for the presence of the pflp transgene transgenic lines. Fig. 1A indicated that pflp transgene was integrated into genomic DNA of two transgenic lines. Individual seeding were selected and further screened using PCR to detect the presence of transformed pflp gene. Only confirmed transformants were selected for further analysis. Total RNA were extracted from two transgenic lines and subjected to RT-PCR and Q-PCR analysis to monitor pflp gene expression levels. The expression of pflp is detectable in two transgenic lines but not WT (Fig. 1B). Q-PCR analysis showed that pflp transgene exhibited 0.2% and 0.1% expression level compared of itself osα-tubulin in pflp-1 and pflp-2 (Fig. 1C). Because pflp belongs to ferredoxin-1 (Dayakar et al., 2003), it is possible that constitutive expression of pflp in transgenic rice would influence endogenous osferredoxin-1 expression. RT-PCR and Q-PCR analysis were performed to detect expression level of osferredoxin-1. As shown in Fig 2A and B, the expression level of osferredoxin-1 was no significant difference between WT and transgenic lines. Protein gel blot analysis showed the accumulation of PFLP protein in both transgenic lines, and barely detectable in WT (Fig. 1D). These results indicate that pflp indeed expressed at both transcription and translation levels in pflp transgenic lines.. PFLP can increase the capacity of photosynthetic electron transport The measurement of leaf chlorophyll fluorescence is the convince tool to examine the capacity of photosynthetic electron transport in vivo (Baker, 2008). The leaf chlorophyll fluorescence of pflp transgenic lines could determine the capacity of photosynthetic electron transport. The Fv/Fm ratio was 0.715 ± 0.008 in WT, 0.736 ± 0.016 in pflp-1 and 0.744 ± 0.018 in pflp-2. At Fv/Fm ratio, there is no significant difference between WT and pflp transgenic plants (Table I). It illustrated WT and pflp transgenic plants lines under 14.
(16) non-stresses condition. At the Fv’/Fm’ ratio, both of pflp-1 and pflp-2 were 1.1-fold higher than WT. The qP of pflp-1 and pflp-2 were 1.3- and 1.5 - fold compared with WT (Table I). At electron transport rate, both of pflp transgenic plants were higher than WT in 1250 (μmol m-2s-1) photosynthetically active radiation (PAR) (Fig. 3). Above results show PFLP could increase the capacity of photosynthetic electron transport in two transgenic lines.. PFLP can enhance photosynthetic gas exchange rate in pflp transgenic lines Photosynthetic gas exchange rate, the response of CO2 uptake to stomatal conductance has been used to parameterize leaf photosynthesis (Farquhar et al., 1980). In order to confirm PFLP could enhance photosynthetic gas exchange rate. The photosynthetic gas exchange rate of two pflp transgenic lines was detected. The CO2 uptake in two pflp transgenic lines was about 1.3- and 1.2- fold higher than that of WT (Fig. 4A). Besides, in stomatal conductance, pflp transgenic lines also exhibited 1.5- and 1.4-fold compared with WT (Fig. 4B). These results demonstrate that pflp transgenic lines possess the higher photosynthetic gas exchange rate and stomatal conductance than these of WT. The chlorophyll content is highly associates with photosynthesis (Chida et al., 2007). The chlorophyll a and chlorophyll b of two transgenic lines show no significance compared with WT (Fig. 4C). It indicated that PFLP doesn’t affect the chlorophyll synthesis. These results indicate that PFLP increase CO2 uptake in transgenic lines, it is not through altering chlorophyll content.. Highly contents of soluble sugar and starch accumulate in transgenic rice results from relative high expression pattern of carbohydrate metabolism related gene Leaf sugar contents reflect the capacity of photosynthetic electron transport rate and photosynthetic gas exchange rate (Arnon, 1971). The sugar contents were detected both in pflp transgenic lines and WT. Our data showed that the contents of soluble sugars (fructose, glucose and sucrose) are significantly increased in two pflp transgenic lines compared with WT. In fructose, pflp-1 exhibited 2.8-fold and pflp-2 exhibited 1.8-fold higher than WT (Fig. 5A). In glucose, pflp-1 and pflp-2 exhibited 2.4- and 2.1-fold compared with WT (Fig. 5B). In sucrose, both two pflp transgenic lines exhibited 1.2-fold higher than WT (Fig. 5C). In 15.
(17) starch, pflp-1 and pflp-2 exhibited 1.8- and 1.5-fold higher than WT (Fig. 5D). Above results demonstrate pflp transgenic lines accumulate highly sugar and starch contents than these of WT, no matter for energy-utilized (fructose and glucose), transportation (sucrose) and storage forms (starch). Due to the reasons that pflp transgenic rice contains highly sugar contents, some carbohydrate metabolism related gene were also be monitored. The free hexoses were phosphated to hexose-6-phosphate by hexokinase and then it was utilized for producing other metabolic precursors, HXK5 and HXK6 transcript activity were monitored. . cFBPase is the enzyme which involve in sucrose synthesis. In chloroplast, AGPase contains large subunit (AGPL3) and small subunit (AGPS2α) which is the key enzyme in starch synthesis pathway. SPS is the key enzyme in sucrose synthesis pathway. pFBPase and SBPase participated in Calvin cycle, and it was regulated by ferredoxin-thioredoxin system. In Calvin cycle, pFBPase and SBPase showed 1.5- ~2-fold higher in pflp transgenic lines than those of WT. In HXK expression, HXK5 showed about 2-fold higher in pflp transgenic lines than those of WT and HXK6 showed 4-fold higher in pflp transgenic lines than those of WT. In starch synthesis, AGPL3 and AGPS2α showed 2- ~4-fold higher in pflp transgenic lines than those of WT. In sucrose synthesis, SPS and cFBPase showed 1.5- ~2-fold higher in pflp transgenic lines than those of WT. These results demonstrate that PFLP could indirectly induce carbohydrate metabolism related gene expression and result highly sugar accumulation in transgenic lines.. Analysis of crop yield in pflp transgenic lines In rice, crop yield is determined by three component traits: number of panicles, number of grains per panicle, and grain weight (Zhang, 2007). The grain weights of pflp-1 and pflp-2 increased 1.7- and 1.3-fold than that of WT (Table II). Counting the number of panicles, pflp-1 and pflp-2 are 1.4- and 1.5-fold compared with WT (Table II). Additionally, the grain starch synthesis result that sucrose was imported form source leave, and then catalyzed fructose and glucose by invertase. Glucose and fructose were synthesized to starch in grain by AGPase in seed for long-term storage (Balmer et al., 2006; Nagai et al., 2009; Weschke et al., 2000).The grain starch contents of pflp-1 and pflp-2 were 1.1- and 1.2-fold than that of WT (Fig.7A and B). These results demonstrate that crop yield of pflp transgenic lines are higher than WT.. 16.
(18) pflp transgenic lines maintain photosynthetic gas exchange rate after a bacterial pathogen infection Numbers of studies reported when plant infected by pathogens, the photosynthetic efficiency would be reduced (Bonfig et al., 2006; Scholes et al., 1994; Swarbrick et al., 2006). It also been reported excess sugar could induce the expression of PR gene (Ehness et al., 1997). It had been proved that PFLP could increase the photosynthesis efficiency and accumulate the high content of soluble sugar in transgenic lines. In order to indentify the relationship between photosynthesis and disease resistance, the transgenic rice would be infected with Xanthomonas campestris pv. oryzae and the photosynthetic gas exchange rate were detected. The photosynthetic gas exchange rate of WT was decreased gradually after the infection of bacterial pathogens. However, the transgenic rice maintain normal photosynthetic gas exchange rate on successive days (Fig. 8).. 17.
(19) Discussion Genetic engineering has proven to be a powerful tool for improving crop production. Different genetic strategies have been proposed to modify plant metabolism condition, such as enhancing photosynthesis, promoting biotic and abiotic resistances, increasing the nutrient-use efficiency and to increase grain yield (Zhang, 2007; Ishimaru, 2003; Reynolds et al., 2009). In this report, we demonstrate constitutive expression pflp in transgenic rice can enhance their photosynthesis efficiency and increase crop yield. The electron transport capacity (Fig.3) and photosynthetic gas exchange rate (Fig.4A) of the two transgenic lines are significantly higher than these of WT. Sugar contents of both of pflp transgenic lines are higher compared with WT (Fig.5A-C). The transcript activities of carbohydrate metabolism related genes in transgenic lines were higher than these of WT (Fig.6). In crop yield, pflp transgenic lines can generate more grains than WT (Fig.7). In photosynthesis, electron transport chain is divided into linear electron flow and cyclic electron flow (Brettel and Leibl, 2001; Joliotet al., 2006). Number of reports indicated that cyclic electron flow would drive when linear electron flow was limited to avoid ROS generation (Asada 1999, Ort and Baker 2002, Rumeau et al., 2007). Yamamoto et al. (2006) reported expressing Atfd-2 in chloroplasts of tobacco leaf could stimulate cyclic electron flow and enhance NPQ. The enhancement of cyclic electron flow results from abundant reduced AtFd-2 which would return the electron to the ferredoxin-quinone oxidoreductase for forming cyclic electron flow rather than reducing NAPDH for forming linear electron flow (Bukhov and Carpentier, 2004). Cyclic electron flow would dissipate excess photon energy as heat as well as inducing NPQ (Miyake and Yokota, 2000). Two pflp transgenic rice showed lower NPQ than WT (Table 1). In addition, the ratios of Fv’/Fm’ and qP are higher in pflp transgenic plants compared with WT. These results suggest that linear electron flow is not limited, but it become more efficient in pflp transgenic lines. And all of our results indicated the capacity of electron transport in PFLP which preferred the linear electron flow rather than the cyclic electron flow. Photosynthetic gas exchange rate is one of the markers for determining the capacity of photosynthesis (Farquhar et al., 1980). Stomatal conductance is a regulatory factor of gas exchange between the inside of the leaf and the external environment (Farquhar and Sharkey, 1982; Lawson, 2009). Several studies reported there is positive relationship between the stomatal conductance and photosynthetic gas exchange rate (Baroli 18.
(20) et al., 2008; Lawson, 2009; Wong et al., 1985). In pflp transgenic rice, the electron transport efficiency (Fig3, Table 1), capacity of CO2 uptake (Fig.4A) and stomatal conductance (Fig.4B) were higher than WT. These results suggest PFLP can enhance the capacity of photosynthesis. In photosynthesis, plants convert light energy to generate ATP and NADPH, and then synthesize carbohydrates in Calvin cycle. Several studies reported that the high efficiency of electron transport capacity and the enhancement of photosynthetic gas exchange rate could promote sugar synthesis because of abundant NADPH, ATP and enough CO 2 uptake (Sun et al., 2002; Sun et al., 1999). Our results have been indicating that PFLP can increase CO2 uptake and electron transport efficiency. Additionally, there are higher soluble sugar contents including sucrose, fructose, glucose and starch in pflp transgenic rice plants compared with WT (Fig.5A-D). It indicates that PFLP elevates the soluble sugar synthesis as a result of the more efficient electron transport capacity and photosynthetic gas exchange rate. Several studies illustrated that sugar could play a role as signals to regulate the expression of carbohydrate metabolism related gene, such as sucrose treatment could induce the expression of AGPase (Akihiro et al., 2005; Li et al., 2002). Ferredoxin–Thioredoxin system regulates the activities of some carbohydrate metabolism related enzymes in the post-translation level (Geigenberger et al., 2005; Schurmann and Buchanan 2008). For example, pFBPase, SBPase and AGPase were activated when their disulfide bonds of regulatory domain were reduced by ferredoxin–thioredoxin system in chloroplast (Jacquot et al., 1997; Dunford et al., 1998; Fu et al., 1998). Although these carbohydrate metabolism related enzymes activities were not analyzed in this study, but the expressions of pFBPase, SBPase and AGPase were upregulated in pflp transgenic line (Fig.6A and B). Lee et al (2008) indicated that loss of cytosolic fructose-1, 6-bisphosphatase would limit sucrose synthesis. It illustrates cFBPase response for sucrose synthesis. We showed the expression level of cFBPase and SPS in pflp transgenic plants is also higher than that of WT (Fig.6A and B).It suggests that PFLP indirectly upregulate the expression of sugar synthesis genes via enhancing photosynthesis. The results indicated that high sugar content accumulation in pflp transgenic lines was due to higher expression level of carbohydrate metabolism gene. The activities of carbohydrate metabolism related genes are highly associated with plant defense mechanism. HXK is involved in the upregulation of PR gene by glucose-hexokinase pathway (Xiao et al., 19.
(21) 2007). When pathogens invade plant, sucrose will be catalyzed to glucose by cell wall invertase (cw-Inv), and then utilized as nutrient sources by pathogens (Biemelt et al., 2006). However, excess glucose binds to HXK, and it leads HXK conformation change. The glucose-HXK complex will induce PR1 and PR5 expression through glycolysis-dependent pathway (Xiao et al., 2007). The pflp transgenic lines exhibits higher HXK expressional level compared with WT under normal condition (Fig.6A and B). In addition, pflp transgenic lines maintain photosynthetic gas exchange rate during the period of pathogen infected. These results reveal that disease resistance of pflp transgenic lines may come from highly glucose contents to upregulate the expression of PR gene. Some studies indicate photosynthesis and growth were promoted by overexpressing the photosynthesis related gene (Feng et al., 2007; Lefebvre et al., 2005; Miyagawa et al., 2001; Chida et al., 2007). For example, Lefebvre et al. (2005) reported overexpression of SBPase in tobacco could enhance photosynthesis and stimulate plant growth. Feng et al. (2007) indicated overexpression of SBPase in rice could enhance CO2 uptake when it expose to high temperature stress. Chida et al. (2007) showed that enhancement of the capacity of electron transport and growth of plants by introducing algal cytochrome c6 gene. To date, few reports reveal that increase the crop yield through genetic engineering. In rice, crop yield is depended on several component traits: number of panicles, number of grains per panicle, and grain weight (Zhang, 2007). In number of panicles and grain weight, pflp transgenic lines are higher than these of WT (Fig7A, Table 2). In addition, grain quality is mostly determined content of the grain starch. The grain of pflp transgenic lines also contains more starch (Fig.7B). Taken altogether, we report that constitutive expression of pflp in transgenic rice can enhance capacity of photosynthetic carbon assimilation and increase crop yield.. 20.
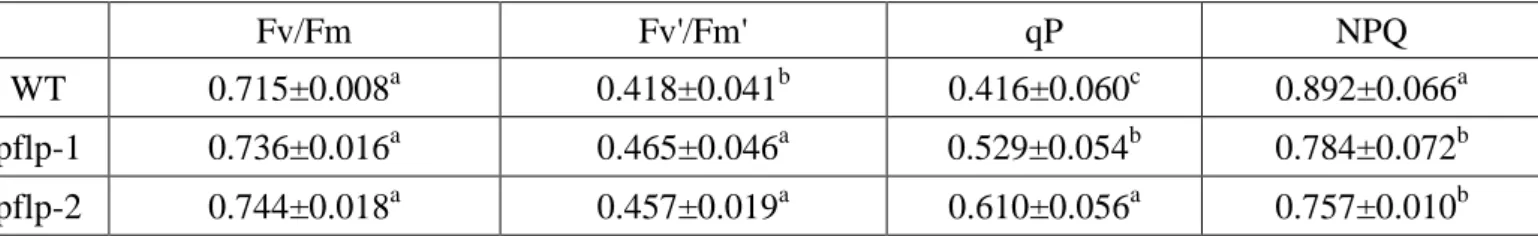
(22) Table I. The efficiency of PSII electron transport Fv/Fm. Fv'/Fm'. qP. NPQ. WT. 0.715±0.008a. 0.418±0.041b. 0.416±0.060c. 0.892±0.066a. pflp-1. 0.736±0.016a. 0.465±0.046a. 0.529±0.054b. 0.784±0.072b. pflp-2. 0.744±0.018a. 0.457±0.019a. 0.610±0.056a. 0.757±0.010b. Fv/Fm, Fv'/Fm', qP and NPQ were determined in the second leaf from 1.5-month-old WT and two pflp transgenic lines. Error represent SE of the means of at least 8 independent plants. The values of the pflp transgenic lines show significantly difference from the WT (P < 0.05) according to one-way ANOVA LSD Means Test.. 21.
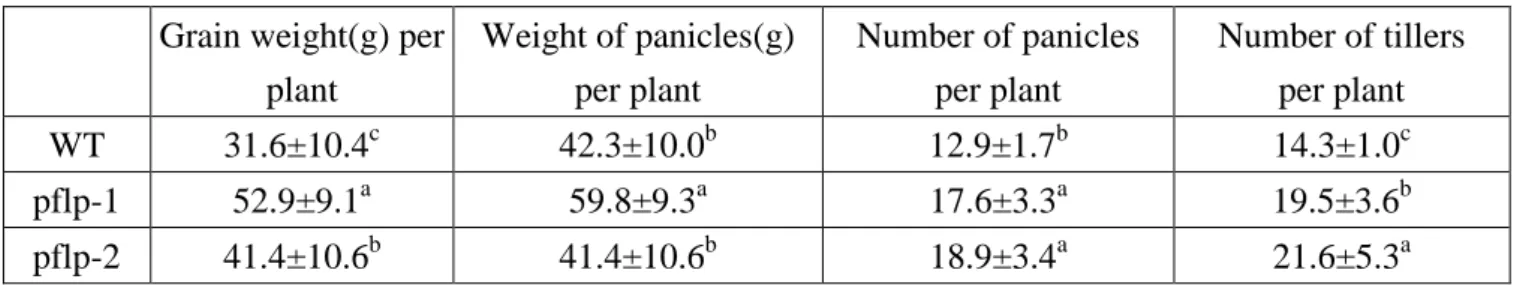
(23) Table II: The crop yield in WT and pflp transgenic lines Grain weight(g) per plant. Weight of panicles(g) per plant. Number of panicles per plant. Number of tillers per plant. WT. 31.6±10.4c. 42.3±10.0b. 12.9±1.7b. 14.3±1.0c. pflp-1. 52.9±9.1a. 59.8±9.3a. 17.6±3.3a. 19.5±3.6b. pflp-2. 41.4±10.6b. 41.4±10.6b. 18.9±3.4a. 21.6±5.3a. Comparison of crop yield is between 3.5-month-old WT and two pflp transgenic lines. The values of the pflp transgenic lines differ significantly from the WT according to one-way ANOVA LSD Means Test (P < 0.05). Values are given as means ± SD. 22.
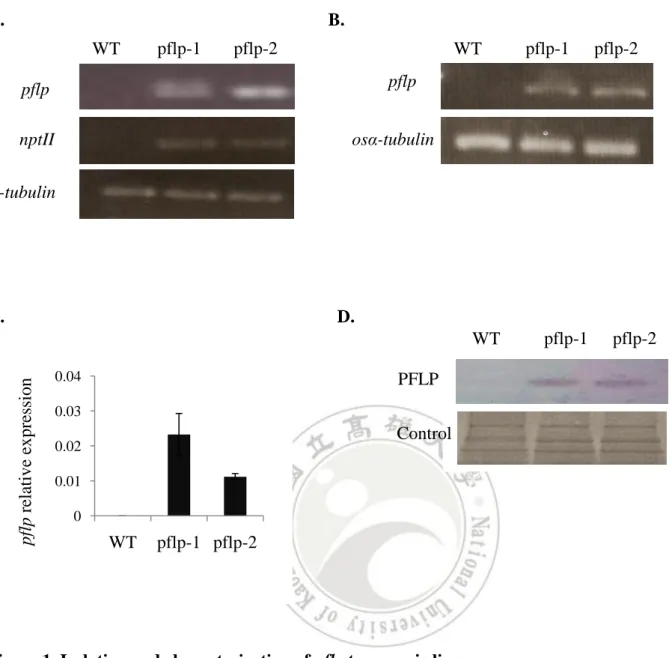
(24) A.. B. WT. pflp-1. pflp-2. WT. pflp-1. pflp-2. pflp. pflp nptII. osα-tubulin. osα-tubulin. C.. D.. pflp relative expression. WT 0.04. pflp-1. pflp-2. PFLP. 0.03. Control. 0.02 0.01 0. WT. pflp-1 pflp-2. Figure 1. Isolation and characterization of pflp transgenic lines (A) Gemonic DNA PCR for detecting pflp existance from 3-month-old wild type and two transgenic lines were performed and utilized osα-tubulin as an internal control. The amplified 231bps fragment of pflp and 365bps fragment of nptII were only detectable in two transgenic lines. (B) RT-PCR and (C) Q-PCR analysis for detecting pflp expression from 3-month-old WT and two transgenic lines were performed and expression of osα-tubulin as an internal control. (D) Western blot for detecting PFLP expression pattern of pflp transgeic lines. Total proteins were extracted from mature leaf for 3-month-old WT and two transgenic lines. The specific band for PFLP is 22kD only found in two transgenic lines on PVDF membrane.. 23.
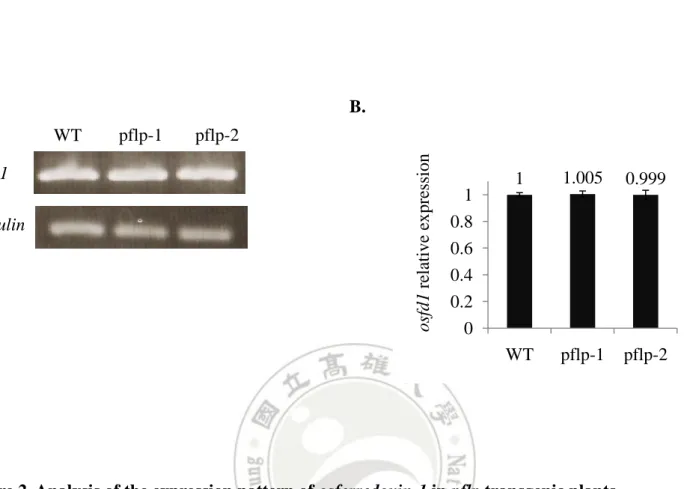
(25) A.. B. pflp-1. pflp-2 osfd1 relative expression. WT osfd-1 osα-tubulin. 1. 1.005. 0.999. WT. pflp-1. pflp-2. 1 0.8 0.6 0.4 0.2 0. Figure 2. Analysis of the expression pattern of osferredoxin-1 in pflp transgenic plants (A) RT-PCR and (B) Q-PCR analysis for detecting osferredoxin-1 expression pattern from 3-month-old WT and two transgenic lines were performed and utilized the expression of osα-tubulin as an internal control. The amplified 435 bps fragment of pflp was detectable both in WT and two transgenic lines. Values are given as means±SD (n = 3 separate plants).. 24.
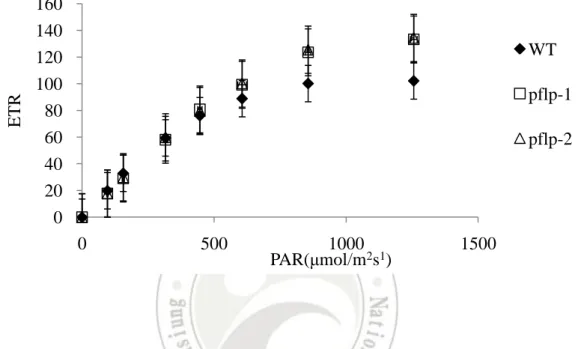
(26) ETR. 160 140 120 100 80 60 40 20 0. WT pflp-1 pflp-2. 0. 500. 1000 PAR(μmol/m2s1). 1500. Figure 3. Electron transport rate (ETR) in pflp transgenic lines and WT Electron transport rate measured in the second leaf from 1.5-month-old WT and two transgenic lines following a 10 mins dark adaptation period treated. Error represent SE of the means of at least 3 independent plants. PAR: photosynthetically active radiation, ETR: electron transport rate. 25.
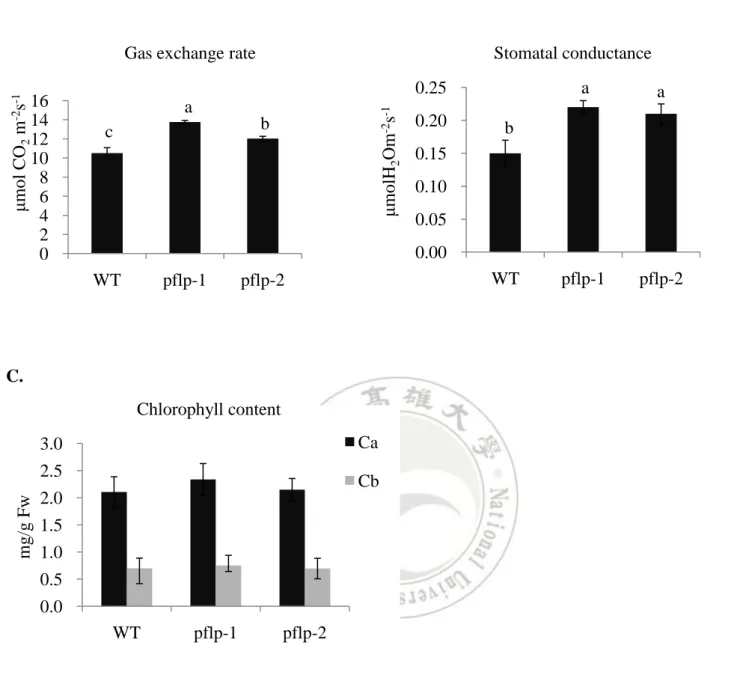
(27) A.. B.. 16 14 12 10 8 6 4 2 0. Stomatal conductance a. a. pflp-1. pflp-2. 0.25 a. μmolH2Om-2s-1. μmol CO2 m-2s-1. Gas exchange rate. b. c. 0.20. b. 0.15 0.10 0.05 0.00. WT. pflp-1. WT. pflp-2. C. Chlorophyll content Ca. 3.0 mg/g Fw. 2.5. Cb. 2.0. 1.5 1.0 0.5 0.0 WT. pflp-1. pflp-2. Figure 4. The capacity of gas exchange rate and stomatal conductance in pflp transgenic lines (A) Gas exchange rate; (B) Stomatal conductance; (C) Chlorophyll contents were determined in the second leaf from 1.5-month-old WT and pflp transgenic lines. The values of the pflp transgenic lines differ significantly with the WT according to one-way ANOVA LSD Means Test (P < 0.05). Error represent SE of the means of at least 8 independent plants. Ca: Chlorophyll a, Cb: chlorophyll b. 26.
(28) A.. B.. mg/gFw. b. c. WT. pflp-1. mg/gFw. Fructose a. 8 7 6 5 4 3 2 1 0. Glucose. 8 7 6 5 4 3 2 1 0. a a. b. pflp-2. WT. C.. pflp-1. pflp-2. D.. Sucrose. Starch 6. 120 ab. 80. b. 60 40. 3. 0. 0 pflp-2. c. 2 1. pflp-1. b. 4. 20 WT. a. 5. a mg/gFw. mg/gFw. 100. WT. pflp-1. pflp-2. Figure 5. Soluble sugars and starch content in pflp transgenic lines (A) Fructose; (B) Glucose; (C) Sucrose; (D) Starch contents were determined in the second leaf from 3-month-old WT and pflp transgenic lines. The values of the pflp transgenic lines differ significantly from the WT according to one-way ANOVA LSD Means Test (P < 0.05). The results are given as means ± SD (n=5 separate plants).. 27.
(29) A. pflp-1. WT. pflp-2. osHXK5 osHXK6 osAGPL3 osAGPS2α osSPS oscFBPase ospFBPase osSBPase osα-tubulin B.. pflp-1 pflp-2. Realative intensity. 5 4 3 2 1. WT. 0. osHXK5. osHXK6. osAGL3 osAGPS2a. 28. osSPS. oscFBPase ospFBPase osSBPase.
(30) Figure 6. The expression pattern of carbohydrate metabolism related gene ( A) RT-PCR and (C) Q-PCR PCR analysis for detecting pflp expression in the second leaf from 3-month-old WT and two transgenic lines were performed and expression of osα-tubulin as an internal control. RNA was initially extracted from flag leave determined from 1.5-month-old WT and pflp transgenic lines. Abbreviated gene names are; osHXK5 (hexokinase 5), osHXK6 (hexokinase 6), osAGPL3 (ADP-glucose pyrophosphorylase large subunit), osAGPS2α (ADP-glucose pyrophosphorylase small subunit), osSPS (sucrose phosphate synthetase), ospFBPase (plastidic fructose-1, 6-bisphosphatase), oscFBPase (cytosolic fructose-1, 6-bisphosphatase), osSBPase (sedoheptulose-1, 7-bisphosphatase). Values are given as means ± SD (n = 3 separate plants). 29.
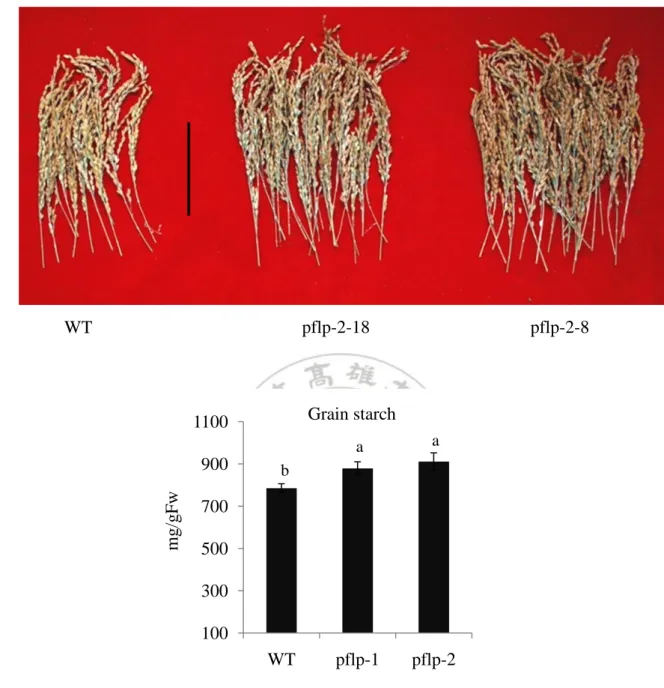
(31) A.. pflp-2-18. WT. pflp-2-8. B. Grain starch. 1100. mg/gFw. 900. a. a. pflp-1. pflp-2. b. 700 500 300 100. WT. Figure 7. The grain starch content in pflp transgenic lines (A) The phenotype of grain with WT and pflp transgenic lines. Photograph was taken from the seed after harvested. Bar = 10cm (B) The grain starch contents with WT and pflp transgenic lines. The grain starch contents were determined from mature seed. The values of the pflp transgenic lines differ significantly from the WT (P < 0.05) according to one-way ANOVA LSD Means Test. The results are given as means ± SD (n = 3 separate plants).. 30.
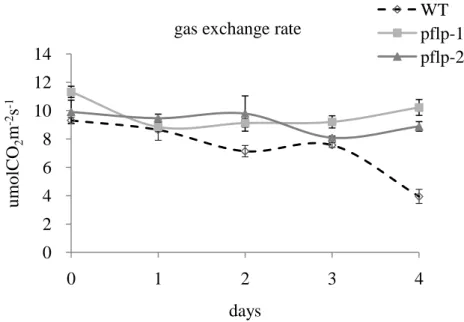
(32) WT pflp-1 pflp-2. gas exchange rate 14 umolCO2m-2s-1. 12 10 8. 6 4 2 0 0. 1. 2. 3. 4. days. Figure 8. The pattern of photosynthetic gas exchange rate during the pathogen infected WT and pflp transgenic plants challenged in the second leaf with Xanthomonas campestris pv. oryzae during 4 days. Gas exchange rate is measured from flag leaf of pathogen-infected 4 days in 3-month-old WT and two transgenic lines. Error represent SE of the means of at least 8 independent plants.. 31.
(33) Reference Akihiro T, Mizuno K, Fujimura T (2005) Gene expression of ADP-glucose pyrophosphorylase and starch contents in rice cultured cells are cooperatively regulated by sucrose and ABA. Plant Cell Physiol 46: 937–946 Arnon DI (1971) The light reactions of photosynthesis. Proc Natl Acad Sci 68: 2883-2892 Asada K (1999) The water–water cycle in chloroplasts: scavenging of active oxygens and dissipation of excess photons. Annu Rev Plant Physiol Plant Mol Biol 50: 601–639 Baker NR (2008) Chlorophyll fluorescence: A probe of photosynthesis in vivo. Annu Rev Plant Biol 59: 89–113 Balmer Y, Vensel WH, Cai N, ManieriW, Schu¨rmann P, Hurkman WJ, Buchanan BB (2006) A complete ferredoxin-thioredoxin system regulates fundamental processes in amyloplasts. Proc Natl Acad Sci 103: 2988–2993 Baroli I, Price GD, Badger MR, Caemmerer S (2008) The contribution of photosynthesis to the red light response of stomatal conductance. Plant Physiol 146: 737–747 Biemelt S, Sonnewald U (2006) Plant–microbe interactions to probe regulation of plant carbon metabolism. Journal of Plant Physiol 163: 307-318 Bonfig KB, Schreiber U, Gabler A, Roitsch T, Berger S (2006) Infection with virulent and avirulent P. syringae strains differentially affects photosynthesis and sink metabolism in arabidopsis leaf. Planta 225: 1–12 Brettel K, Leibl W (2001) Electron transfer in photosystem I. Biochim.Biophys. Acta. 1507:100–114 Bukhov N, Carpentier R (2004) Alternative Photosystem I-driven electron transport routes: mechanisms and functions. Photosynth Res 82: 17–33 Chan YL, Lin KH, Sanjaya, Liao LJ, Chen WH, Chan MT (2005) Gene stacking in Phalaenopsis orchid enhances dual tolerance to pathogen attack. Transgenic Res14:279–288 Chen WH , Tseng YC , Liu YC , Chuo CM , Chen PT, Tseng KM, Yeh YC , Ger MJ , Wang HL (2008) Cool-night temperature induces spike emergence and affectsphotosynthetic efficiency and metabolizable carbohydrate and organic acid pools in Phalaenopsis aphrodite. Plant Cell Rep 27: 1667-1675 Chida H, Nakazawa A, Akazaki H, Hirano T, Suruga K, Ogawa M, Satoh T, Kadokura K, Yamada S, Hakamata W, Isobe K, Ito T, Ishii R, Nishio T, Sonoike K, Oku T (2007) Expression of the algal cytochrome c6 gene in arabidopsis. Enhances photosynthesis and growth. Plant Cell Physiol. 48:948–95 Cho Jl, Ryoo N, Eom JS, Lee DW, Kim HB, Jeong SW, Lee YH, Kwon YK, Cho MH, Bhoo SH, Hahn TR, Park YI, Hwang I, Sheen J, Jeon JS (2009) Role of the rice hexokinases osHXK5 and osHXK6 as glucose sensors Plant Physiol 149: 745–759 Dayakar BV, Lin HJ, Chen CH, Ger,MJ ,Lee BH, Pai CH, Chow D, Huang HE, Hwang SY, Chung MC , Feng TY (2003) Ferredoxin from sweet pepper (Capsicum annuum L.) intensifying harpinpss-mediated hypersensitive response shows an enhanced production of active oxygen species (AOS). Plant Molecular Biol 51: 913–924 Dunford RP, Durrant MC, Catley MA, Dyer T (1998) Location of the redox-active cysteines in chloroplast sedoheptulose-1,7-bisphosphatase indicates that its allosteric regulation is similar but not 32.
(34) Identical to that of fructose-1,6-bisphosphatase. Photosynth Res 58: 221–230 Ehness R, Ecker M, Godt DE, and Roitsch T (1997) Glucose and stress independently regulate source and sink metabolism and defense mechanisms via signal transduction pathways involving protein phosphorylation. The Plant Cell 9: 1825-1841 Farquhar GD, Caemmerer SV, Berry JA (1980) A Biochemical Model of Photosynthetic CO2 assimilation in leaf of C3 Species. Planta 149:78-90 Farquhar GD, Sharkey TD (1982) Stomatal conductance and photosynthesis. Ann Rev of Plant Physiol 33: 317–345 Feng L, Wang K , Li Y, Tan Y, Kong J , Li H, Li YS, Zhu Y (2007) Overexpression of SBPase enhances photosynthesis against high temperature stress in transgenic rice plants. Plant Cell Rep 26: 1635–1646 Fu Y, Ballicora MA, Leykam JF, Preiss J (1998) Mechanism of reductive activation of potato tuber ADP-glucose pyrophosphorylase. J Biol Chem 273: 25045–25052 Geigenberger P, Kolbe A, Tiessen A (2005) Redox regulation of carbon storage and partitioning in response to light and sugars. J Exp Bot 56: 1469–1479 Gibson SI (2000) Plant sugar-response pathways Part of a Complex Regulatory Web. Plant Physiol 124:1532–1539 Hanke GT, Hase T (2008) Variable photosynthetic roles of two leaf-type ferredoxins in arabidopsis, as revealed by RNA interference. Photochem Photobiol 84: 1302–1309 Holtgrefe S, Bader KP, Horton P, Scheibe R, Schaewen A ,Backhause JE (2003) Decreased content of leaf ferredoxin changes electron distribution and limits photosynthesis in transgenic potato plants. Plant Physiol 133:1768–1778 Huang HE, Ger MJ, Yip MK, ChenCY ,Pandey AK, Feng TY (2004) A hypersensitive response was induced by virulent bacteria in transgenic tobacco plants overexpressing a plant ferredoxin-like protein (PFLP). Mol Plant Pathol. 64: 103–110 Ishimaru K (2003) Identification of a locus increasing rice yield and physiological analysis of its function. Plant Physiol 133:1083–1090 Jacquot JP, Lopez JJ, Miginiac MM, Lemaire S, Cherfils J, Chueca A, Lopez GJ (1997) Cysteine-153 is required for redox regulation of pea chloroplast fructose-1,6-bisphosphatase. FEBS Lett. 401: 143–147 Joliot P, Joliot A (2006) Cyclic electron flow in C3 plants. Biochim et Biophys Acta. 1757: 362–368 Joliot P, Joliot A (2002) Cyclic electron transfer in plant leaf. Proc Natl Acad Sci 99: 10209–10214 Kern J, Renger G (2007) Photosystem II: Structure and mechanism of the water:plastoquinone oxidoreductase. Photosynth Res 94:183–202 Koch K (2004) Sucrose metabolism: regulatory mechanisms and pivotal roles in sugar sensing and plant development. Cur Opin in Plant Biol 7:235–246 Lawson T (2009) Guard cell photosynthesis and stomatal function. New Phytologist 181: 13–34 Lee SK, Hwang SK, Han M, Eom JS, Kang HG, Han Y, Choi SB, Cho MH, Bhoo SH, An G, Hahn TR, Okita TW, Jeon JS (2007) Identification of the ADP-glucose pyrophosphorylase isoforms essential for starch synthesis in the leaf and seed endosperm of rice (Oryza sativa L.) Plant Mol Biol 65:531–546 Lee SK, Jeon JS , Bornke F, Voll L, Cho JI, Goh CH, Jeong SW, Park YI, Kim SJ, Choi SB, Miyao A, Hirochika H, An G, Cho MH, Bhoo SH, Sonnewald U, Hahn TR (2008) Loss of cytosolic 33.
(35) fructose-1,6-bisphosphatase limits photosynthetic sucrose synthesis and causes severe growth retardations in rice (Oryza sativa). Plant, Cell and Environment 31:1851–1863 Lefebvre S, Lawson T, Zakhleniuk OV, Lloyd JC, Raines CA (2005) Increased sedoheptulose-1,7-bisphosphatase activity in transgenic tobacco plants stimulates photosynthesis and growth from an early stage in development. Plant Physiol 138: 451–460 Li X, Xing J, Gianfagna TJ, Janes HW (2002) Sucrose regulation of ADP-glucose pyrophosphorylase subunit genes transcript levels in leaves and fruits. Plant Sci 162: 239–244 Liau CH, Lu JC, Prasad V, Hsiao HH, You SJ, Lee JT, Yang NS, Huang HE, Feng TY, Chen WH Chan MT (2003) The sweet pepper ferredoxin-like protein (pflp) conferred resistance against soft rot disease in Oncidium orchid. Transgenic Res 12: 329–336 Lichtenthaler HK (1987) Chlorophylls and cartenoids. In methods in enzymology Academic Press Inc. 350-382 Livak KJ, Schmittgen TD (2001) Analysis of relative gene expression data using real-time quantitative PCR and the 2∆∆CT method. Methods 25: 402–408 Lunn JE and MacRae E (2003) New complexities in the synthesis of sucrose. Curr Opin Plant Biol.6: 208-214 Miyagawa Y, Tamoi M, Shigeoka S (2001) Overexpression of acyanobacterial fructose-1, 6-/sedohetulose-1, 7-bisphosphatase in tobacco enhances photosynthesis and growth. Nat Biotechnol 19:965–969 Miyake C, Yokota A (2000) Determination of the rate of photoreduction of O2 in the water–water cycle in watermelon leaves and enhancement of the rate by limitation of photosynthesis. Plant Cell Physiol 41: 335–343 Munekage Y, Hashimoto M, Miyake C, Tomizawa K, Endo T, Tasaka M, Shikanai T (2004) Cyclic electron flow around photosystem I is essential for photosynthesis. Nature 429: 579–582 Nagai YS, Sakulsingharoj C , Edwards GE , Satoh H, Greene TW ,Blakeslee B ,Okita TW (2009) Control of starch synthesis in cereals: metabolite analysis of transgenic rice expressing an up-regulated cytoplasmic ADP-glucose pyrophosphorylase in developing seeds. Plant Cell Physiol 50: 635–643 Noguchi K, Yoshida K (2008) Interaction between photosynthesis and respiration in illuminated leaves. Mitochondrion 8: 87–99 Ort DR, Baker NR (2002) A photoprotective role for O(2) as an alternative electron sink in photosynthesis? Curr Opin Plant Biol 5: 193–198 Orzechowski S (2008) Starch metabolism in leaves Acta Biochimica Polonica 55: 435–445 Reynolds M, Foulkes MJ, Slafer GA, Berry P, Parry MAJ, Snape JW, Angus WJ (2009) Raising yield potential in wheat. J Exp Bot 60: 1899–1918 Rumeau D, Peltier G, Cournac L (2007) Chlororespiration and cyclic electron flow around PSI during photosynthesis and plant stress response. Plant, Cell and Environment 30: 1041–1051 Scafaro AP, Haynes PA, Atwell BJ (2010) Physiological and molecular changes in Oryza meridionalis Ng., a heat-tolerant species of wild rice. J Exp Bot 61: 191–202 Scholes JD, Lee PJ, Horton P, Lewis DH (1994) Invertase understanding changes in the photosynthetic and carbohydrate metabolism of barley leaves infected with powdery mildew. New Phytologist 126:213–222. 34.
(36) Schurmann P, Buchanan BB (2008) The ferredoxin/thioredoxin system of oxygenic photosynthesis. Antioxid Redox Signal. 10: 1236-1274 Sun J, Gibson KM, Kiirats O, Okita TW, Edwards GE (2002) Interactions of nitrate and CO2 enrichment on growth ,carbohydrates, and rubisco in arabidopsis starch mutants. Significance of starch and hexose. Plant Physiol 130:1573–1583 Sun J, Okita TW, and Edwards GE (1999) Modification of carbon partitioning, photosynthetic capacity and O2 sensitivity in arabidopsis plants with low ADP-glucose pyrophosphorylase activity. Plant Physiol 119: 267–276 Swaminathan MS (2007) Can science and technology feed the world in 2025? Field Crops Res 104: 3-9 Swarbrick PJ, Schulze LP, Scholes JD (2006) Metabolic consequences of susceptibility and resistance in barley leaves challenged with powdery mildew. Plant, Cell and Environment 29: 1061–1076 Tang K , Sun X , Hu Q , Wu A, Lin CH,Lin HJ , Twyman RM, Christou P , Feng TY (2001) Transgenic rice plants expressing the ferredoxin-like protein (AP1)from sweet pepper show enhanced resistance to Xanthomonas oryzae pv. oryzae. Plant Sci 160: 1035–1042 Tsuchiya K, Mew TW, Wakimoto S (1982) Bacteriological and pathological characteristics of wild types and induced mutants of Xanthomonas oryzae pv. oryzae. Phytopathology 72:43–46. Voss I, Koelmann M, Wojtera J, Holtgrefe S, Kitzmann C, Backhausen JE, Scheibe R (2008) Knockout of major leaf ferredoxin reveals new redox-regulatory adaptations in arabidopsis thaliana. Physiol Plant.133: 584–598 Wang CY, Chiou CY, Wang HL, Krishnamurthy R, Venkatagiri S ,Tan J, Yeh KW (2008) Carbohydrate mobilization and gene regulatory profile in the pseudobulb of oncidium orchid during the flowering process. Planta 227: 1063–1077 Wang HL, Lee PD, Chen WL, Huang DJ, Su JC (2000) Osmotic stress-induced changes of sucrose metabolism in cultured sweet potato cells. J Exp Bot 51:1991-1999 Weschke W, Panitz R, Sauer N, Wang Q, Neubohn B, Weber H, Wobus U (2000) Sucrose transport into barley seeds: molecular characterization of two transporters and implications for seed development and starch accumulation. Plant j 21: 455-467 Wong SC, Cowan IR, Farquhar HD (1985) Leaf conductance in relation to rate of CO2 assimilation. Plant Physiol 78: 826-829 Xiao W, Sheen J, Jang JC (2000) The role of hexokinase in plant sugar signal transduction and growth and development. Plant Mol Biol 44: 451–461 Yamamoto H, Kato H , Shinzaki Y, Horiguchi S , Tomizawa Toshiharu KI, Miyake C(2006) Ferredoxin limits cyclic electron flow around PSI (CEF-PSI) in higher plants-Stimulation of CEF-PSI enhances non-photochemical quenching of Chl fluorescence in transplastomic tobacco. Plant Cell Physiol. 47: 1355–1371 Yip MK, Huang HE, Ger MJ, Chiu SH, Tsai YC, Lin CI, Feng TY (2007) Production of soft rot resistant calla lily by expressing a ferredoxin-like protein gene (pflp) in transgenic plants. Plant Cell Rep 26: 449–457 Zhang Q (2007) Strategies for developing green super rice. Proc Natl Acad Sci 104: 16402–16409. 35.
(37) Supplemental table: PCR primers Protein. Primer sequences. Tm. pflp (F) 5-ACTGAAACTTATCACACCTGACG-3. Plant Ferredoxin-like Protein(PFLP). 52℃ pflp(R) 5-GGATAAGCAACACAAGTTAGCAC-3 NPTII (F) 5-AATATCACGGGGTAGCCAACG-3. Neomycin phosphotransferase II (nptII). 55℃ NPTII (R) 5-TGCTCCTGCCGAGAAAGTAT-3 Fd-1(F) 5-GTACAACGTGAAGCTGATCACAC-3. Ferredoxin-1(Fd-1). 53℃ Fd-1(R) 5-CACGCCTGTGTTTGTTATCTC-3 HXK5 (F)5-AAAACTGTTGGAGCTAAGCTAAAG-3. Hexkinase 5 (HXK5). 55℃ HXK5(R) 5-CAACTGCTGAACTTCTTGTAATGT-3 HXK6 (F) 5-GATACCTCACATGATCTGAAACAC-3. Hexkinase 6 (HXK6). 54℃ HXK6(R) 5-GTAATGCTCATAGAGACCACCATC-3. ADP-Glucose pyrophosphorylase small subunit 2α (AGP2α). AGPS2α (F) 5-TGTGCTTGGAATCATTCTTG-3. 50℃ AGPS2α(R) 5-TTCAACGAACCCTTCATTCT-3. ADP-Glucose pyrophosphorylase small subunit large subunit 3 AGPL3 (F) 5-CTCCCTTATCCAACCAGAAA-3 (AGPL3). 50℃ AGPL3(R) 5-TTTCTTCGCCTGCAGATTAC-3 cFBP1 (F) 5-CATCAAGGCGTGCGAATGG-3. Cytosolic fructose-1,6-bisphosphatase (cFBPase). 52℃ cFBP1(R) 5-GCCTGACGAATCATGCATGTT-3 pFBP (F) 5-GAGCTACATGGACAGCCTCAAG-3. Plastid fructose-1,6-bisphosphatase (pFBPase). 52℃ pFBP (R) 5-GACGAGGCTGCCGATGT-3 SBP1 (F) 5-CTCTTGATGGGTCCAGCATT-3. Sedoheptulose-1,7-bisphosphatase (SBPase). 54℃ SBP1(R) 5-AGTAGTGCGAGGGCCATAGA-3 SPS (F) 5-GTCAACATCCCGAGCAATATCA-3. Sucrose phosphate synthetase (SPS). 53℃ SPS (R) 5-ATCGCTACCACTGTTGCATATGA-3. α-tubulin. α-tubulin (F)5-TCAGATGCCCAGTGACAGGA-3 α-tubulin (R)5- AAAGTTGTTAGCTGCATCCTC-3. 36. 55℃.
(38) Supplemental table List of Abbreviation AGPase: ADP-glucose pyrophosphorylase AGPL3: ADP-glucose pyrophosphorylase large subunit AGP2α: ADP-glucose pyrophosphorylase small subunit BSA: Bovine serum albumin CO2: Carbon dioxide cFBPase: Cytoclic fructose-1, 6-phosphatase Cyt b6f: Cytochrome b6f complex DHAP: Dihydroxyacetone phosphate ETR: Electron transport rate Fd: Ferredoxin F-1, 6-P: Fructose-1, 6-phosphate Fd-1: Ferredoxin I FNR: Fd: NADP+ reductase FTR: Ferredoxin: thioredoxin reductase Fv/Fm: Maximum quantum efficiency of PSII photochemistry Fv’/Fm’: PSII maximum efficiency G-1-P: Glucose-1-phosphate G-3-P: Glyceraldehyde-3-phosphate HXK5: Hexkinase 5 HXK6: Hexkinase 6 LHCII: Light-harvesting complex II NPQ: Nonphotochemical quenching PAR: Photosynthetically active radiation PC: Plastocyanin pFBPase: Plastidic fructose1,6-bisphosphatase PFLP: Plant ferredoxin-like protein PMSF: Phenylmethlsulfonyl PQ: Plastoquinone PQH: Plastoquinol PR gene: Pathogenesis related gene PSI: Photosystem I PVP40: Polyvinylpyrrolidone Q-PCR: Quantitative reverse transcription PCR qP: Photochemical quenching ROS: Reactive oxygen species RT-PCR: Reverse transcriptase PCR Rubisco: Ribulose 1, 5-bisphosphate carboxylase/oxygenase SBPase: Sedoheptulose 1, 7- bisphosphatase SPS: Sucrose phosphate synthase 37.
(39) Trx: Thioredoxin. 38.
(40)
數據
+6

相關文件
It’s (between/next to) the church and the
Listen - Check the right picture striped hat polka dotted hat.. Which hat do
Play - Let’s make a big family How many people are in your family1. Write it
Sam: I scraped my knee and bumped my head.. Smith: What happened
straight brown hair dark brown eyes What does he look like!. He has short
While Korean kids are learning how to ski and snowboard in the snow, Australian kids are learning how to surf and water-ski at the beach3. Some children never play in the snow
I am writing this letter because I want to make a new friend in another country.. Maybe you will come to Gibraltar
Sam: It’s really nice, but don’t you think it’s too expensive.. John: Yeah, I’m not going to buy it, but I wish I could
