Contents lists available atSciVerse ScienceDirect
Journal of Power Sources
j o u r n a l h o m e p a g e :w w w . e l s e v i e r . c o m / l o c a t e / j p o w s o u r
Effects of the PdO nanoflake support on electrocatalytic activity of Pt
nanoparticles toward methanol oxidation in acidic solutions
Chung-Shou Chen, Fu-Ming Pan
∗Department of Materials Science and Engineering, National Chiao Tung University, Hsinchu 30010, Taiwan, ROC
a r t i c l e i n f o
Article history:Received 6 January 2012
Received in revised form 2 February 2012 Accepted 3 February 2012
Available online 11 February 2012 Keywords:
Palladium oxide Platinum
Direct methanol fuel cells Methanol oxidation reaction
a b s t r a c t
We prepared PdO nanoflake thin films on carbon cloths by reactive sputtering deposition, and studied electrocatalytic performance of Pt nanoparticles electrodeposited on the PdO thin film in methanol oxi-dation reaction (MOR) in acidic media. The PdO nanoflake thin film exhibits a cyclic voltamperometric (CV) behavior similar to metallic Pd electrodes because a metallic Pd surface layer is formed on the PdO thin film electrode under the CV measurement condition. The nanoflake morphology of the PdO elec-trode provides a large surface area for Pt nanoparticle loading, resulting in a large electrochemical active surface area (ESA). The Pt/PdO electrode has a high electrocatalytic activity toward MOR, and the good electrocatalytic performance of the Pt/PdO electrode is ascribed to a high CO tolerance and the large ESA. We suggest that the high CO tolerance of the catalyst on the Pt/PdO electrode is a result of the syner-gism of the bifunctional mechanism and the electronic effect. XPS analyses indicate that negative charge transfer occurs from the PdO support to the Pt nanoparticles, indicating the presence of the electronic effect. Pt nanoparticles on the PdO support can greatly alleviate the nanoflake damage during the CV measurement, which results from anodic dissolution of metal Pd from the PdO support in acidic media.
© 2012 Elsevier B.V. All rights reserved.
1. Introduction
Platinum has a superior electrocatalytic activity toward methanol oxidation reaction (MOR) and, therefore, Pt or Pt-based alloys is presently the most preferred catalyst used in direct methanol fuel cells (DMFCs). However, practical commercialization of DMFCs using Pt as the catalyst is impeded by many materi-als difficulties, such as degraded electroactivity of MOR due to CO poisoning, sluggish oxygen reduction reaction, methanol crossover and the high cost of the Pt catalyst. As far as MOR is concerned, the most widely studied subject in DMFC research is how to enhance the electrocatalytic activity of the anode with a minimized Pt load-ing. Researchers try to reduce the size and optimize the distribution of Pt nanoparticles to minimize the use of the precious Pt catalyst and concurrently increase the electroactivity surface area (ESA) for methanol oxidation. In addition, Pt-based alloys, such as Pt–Ru, Pt–Ni and Pt–Pd, have been synthesized to improve the electro-catalytic performance of the anode for MOR[1–8]. Metal oxides, such as TiO2, RuO2and CeO2, were also used as the Pt support to
enhance the electrocatalytic efficiency of the Pt catalyst[9–12]. In previous works, we used nanostructured TiO2and NiO thin films as
the support of Pt nanoparticles and studied the effect of the oxide supports on the enhancement of the electrocatalytic activity of the
∗ Corresponding author. Tel.: +886 3 5131322; fax: +886 3 5724727. E-mail address:[email protected](F.-M. Pan).
Pt catalyst toward MOR[11,13]. We ascribed the observed elec-troactivity enhancement to the synergism of the electronic effect and the bifunctional mechanism, which is a combination result of electronic and chemical interactions between the hydrous oxides and Pt nanoparticles. This synergism widely occurs to electrodes using transition metal oxides as the Pt nanoparticle support. We are therefore interested in the enhancement effect of different metal oxide supports on electrocatalytic activity of Pt nanoparti-cles toward MOR. In this study, we prepared PdO nanostructured thin films, which have a large surface area, by reactive sputter depo-sition (RSD), and investigated their influence on the electrocatalytic performance of Pt nanoparticles in MOR in acidic media.
Electrochemical properties of PdO is rarely reported in the liter-ature although electrochemical behavior of metallic Pd has been extensively documented [14–25]. However, because the Pd/PdO redox reaction is the primary electrochemical process in the cyclic voltamperometry (CV) test of Pd electrodes, electrochemical prop-erties of PdO may be well interpreted in terms of the CV of metallic Pd. Pd exhibits a high electrocatalytic activity toward MOR and, therefore, has been considered a possible catalyst replacement for Pt in MOR. Since Pd has a much higher dissolution rate than Pt in acidic electrolytes[26,27], MOR electrocatalyzed by the Pd elec-trode was mostly studied in alkaline solutions. Anodic dissolution of the Pd electrode occurs in acidic media when repetitive Pd oxide formation and reduction take place on the anode during a CV test [28–30]. As a consequence, only a very few reports on MOR cat-alyzed by Pd-based anodes in acidic media are available in the
0378-7753/$ – see front matter © 2012 Elsevier B.V. All rights reserved. doi:10.1016/j.jpowsour.2012.02.009
literature[16,31,32]. In this study, we pulse-electrodeposited Pt nanoparticles on the PdO thin film electrode (denoted by Pt/PdO), and found that the electrodeposited Pt nanoparticles could greatly reduce the anodic dissolution of the PdO electrode in the acidic electrolyte. Moreover, the PdO support can enhance the electrocat-alytic activity of Pt nanoparticles toward MOR in the acidic solution; the enhancement is ascribed to the synergism of the bifunctional mechanism and the electronic effect.
2. Experimental
PdO nanoflakes were deposited on carbon cloths at room tem-perature in a radio frequency magnetron sputter deposition system. Before the PdO deposition, the carbon cloth was immersed in the aqueous solution of 5 M HNO3at 25◦C for 5 h, followed by a rinse
with deionized (DI) water. The RSD condition for the PdO nanoflake thin film has been described in detail previously[33]. The palladium target was 2 in. in diameter with a purity of 99.99%. The RSD was performed with a gas mixture of Ar (20 sccm) and O2(20 sccm) at
the working pressure of 9× 10⁻³torr and an RF power of 50 W.
The as-deposited PdO nanoflake thin film was directly used for electrochemical study without further film treatment.
Pt nanoparticles were electrodeposited on the PdO nanoflake thin film in a mixed aqueous solution of 0.001 M H2PtCl6at room
temperature by galvanostatic pulse plating in a two-electrode cell system. The PdO nanoflake support was used as the working elec-trode and a Pt disk (1.5 cm in diameter) as the counter elecelec-trode. During the pulse electrodeposition, the time durations for the pos-itive current pulse (5 mA) and the negative current pulse (−10 mA) were 1 and 2 ms, respectively. A total of 400 pulse cycles were per-formed to deposit Pt nanoparticles on the PdO nanoflake support. For comparison, we also pulse-electrodeposited Pt particles on the carbon cloth support (denoted by Pt/C), and prepared a 10 nm thick Pt thin film on the carbon cloth by e-beam deposition (denoted by blanket-Pt). For the preparation of the Pt/C electrode, following Pt electrodeposition conditions were used: the DC pulse current: −1.0 mA, the pulse duration: 100 ms, the cycle period: 200 ms, and the total number of pulse cycles: 200. The Pt loading of the electrodes was determined by inductively coupled plasma mass spectrometry. Under the sample preparation conditions described above, the Pt/PdO, the Pt/C and the blanket-Pt electrodes had a Pt loading of 0.076, 0.031 and 0.081 mg cm−2, respectively.
Electrochemical measurements were performed at room tem-perature in a three electrode cell system with a saturated calomel reference electrode (SCE). The Pt/PdO electrode was used as the working electrode and a Pt disk as the counter electrode. All aqueous solutions were prepared with DI water. The cyclic voltam-perometry measurement of methanol oxidation was conducted in a deaerated solution of 0.5 M H2SO4 and 1 M CH3OH within the
potential range from−0.2 to 0.9 V with a scan rate of 20 mV s−1.
The CO stripping measurement was conducted in a 0.5 M H2SO4
solution with a scan rate of 20 mV s−1. The CO adsorption on the Pt catalyst was performed by flowing a 10% CO/N2gas mixture in
the 0.5 M H2SO4aqueous solution at 0.1 V for 30 min. Before the CO
stripping measurement, the solution was purged with pure N2gas
for 10 min to remove CO remaining in the solution. The chronoam-perometric measurement for methanol oxidation was carried out in the solution of 0.5 M H2SO4+ 1 M CH3OH at 0.5 V for 3600 s.
Surface morphology was studied by scanning electron microscopy (SEM, JEOL JSM-6500F). The chemical composi-tion of electrode samples was examined by X-ray photoelectron spectroscopy (XPS, Thermo VG 350). The energy calibration for XPS spectra was performed using the Au (4f) and the Pt (4f) binding energies as the references. The microstructure of the PdO thin film and Pt nanoparticles was studied by transmission electron
Fig. 1. SEM images of (a) the as-deposited PdO nanoflakes on a carbon fiber selected
from the carbon cloth shown in the inset; and (b) a magnified SEM image of PdO nanoflakes deposited on the carbon fiber.
microscopy (TEM, JEOL JEM-3000F) and X-ray diffractometry (XRD, PANalytical X’Pert Pro) with the Cu K␣ source. TEM specimens were prepared by mechanical separating nanoflakes from the carbon cloth using ultrasonic agitation in ethanol.
3. Results and discussion
3.1. Electrochemical properties of the PdO thin film electrode Fig. 1(a) shows the SEM image of as-deposited PdO nanoflakes on a carbon fiber selected from the carbon cloth shown in the inset. The uniform PdO thin film sputter-deposited on the carbon cloth is composed of continuously interconnected flake-like nanos-tructures as shown by the magnified SEM image inFig. 1(b). The PdO nanoflakes are very thin with a flake thickness of∼15–20 nm according to the SEM image, and XRD analysis (not shown) indicates that the room-temperature deposited PdO thin film is amorphous. Pd is generally regarded as a precious metal and, there-fore, the use of the PdO support may be considered costly for practical DMFC applications. However, since the height of PdO nanoflakes on the sample is less than 150 nm according to the cross-sectional SEM image (not shown), the consumption of Pd is reasonably low. The nanoflake-like morphology of the as-deposited PdO thin film results in a large surface area, providing enormous electrochemical active sites. Because PdO, a p-type semiconduc-tor, has a low electrical resistivity, we had little difficulty in the
Fig. 2. The cyclic voltammogram of the PdO nanoflake thin film in the aqueous
solution of 0.5 M H2SO4. The scan rate was 20 mV s−1.
electrodeposition of Pt nanoparticles and electrochemical mea-surements on the PdO nanoflake thin film.
3.1.1. Electrochemical measurements of the PdO electrode in aqueous H2SO4solutions
To study the electrocatalytic activity of the PdO nanoflake thin film toward MOR in acidic media, we first performed CV measure-ments of the thin film in an aqueous solution of 0.5 M H2SO4, and
the CV result is shown inFig. 2. The CV measurement has a scan potential range between−0.2 and 0.9 V vs. SCE with the scan rate at 20 mV s−1. The cyclic voltammogram shows that, after the first cycle scan, the PdO thin film exhibits a CV behavior characteristic for metallic Pd. To examine if metallic Pd was electrochemically formed on the PdO nanoflake thin film in the acidic solution, we studied chemical states present on the PdO thin film by XPS.Fig. 3 shows Pd 3d XPS spectra of the PdO thin film before and after the CV measurement. For comparison, the Pd 3d spectrum of a metallic
Fig. 3. Pd (3d) spectra of (a) the as-deposited PdO thin film, (b) the PdO thin film
after the first CV scan cycle, (c) a metallic Pd thin film deposited on the carbon cloth and cleaned with Ar sputtering for 400 s, and (d) the PdO thin film polarized at 0.1 V for 30 min in the 0.5 M H2SO4aqueous solution.
Pd thin film, which was sputter-deposited on the carbon cloth, is also presented in the figure. Curve fitting was performed assuming that the Pd0peak has an asymmetric shape and the Pd2+and Pd4+
peaks have a Gaussian profile. The dashed lines in the figure mark the binding energies of the Pd(0), Pd(II) and Pd(IV) states, which are referred to the literature[34–36]. The as-deposited nanoflake thin film has the Pd 3d5/2peak maximum at 336.5 eV, suggesting that
the PdO is the primary chemical state on the film surface. The curve fitting of the broad Pd 3d doublet indicates that PdO2is also present
in the as-deposited film. After the first cycle of the CV scan, the film surface is greatly reduced to metal Pd as shown by the dramatic change in the shape of the Pd 3d peak profile, which has a large signal component situated at 335.2 eV. Because the Pd 3d signals of the PdO and/or Pd(OH)2states are more intense than that of the
metal Pd, the metallic Pd surface layer electrochemically formed on the PdO thin film has a thickness much less than the probe depth of the Pd 3d photoelectron, which is about 5 nm when the Mg K␣line is used for the XPS analysis. Although thin, the metallic Pd surface layer must decisively govern the CV behavior of the PdO nanoflake thin film after the first CV cycle.
For CV curves with the scan cycle number larger than one, the anodic and cathodic peaks below 0 V vs. SCE are due to hydrogen desorption and adsorption reactions, respectively, on the metallic Pd surface layer. Palladium has CV responses in acidic media simi-lar to platinum[16,30,37]. In a cyclic voltammogram of metallic Pd in the H2SO4solution, three pairs of CV peaks at potentials below
0.9 V can be observed; the three peak pairs are associated with three redox reactions: hydrogen adsorption/desorption, hydrogen absorption/evolution and Pd oxidation/PdO reduction. Metallic Pd has a great hydrogen absorption capability; the cathodic and anodic peaks due to the hydrogen absorption/evolution reactions may span a large potential range (−0.1 to 0.3 V vs. SCE) depending on the thickness of the metallic Pd layer, and overlap the peaks due to hydrogen adsorption/desorption reactions[38–40]. The anodic wave beginning around 0.45 V results from oxidation of the metallic Pd surface layer during the positive sweep. Since the CV scan limit (0.9 V vs. SCE) is far below the potential required for the formation of PdO2(1.4 V)[29,30,41], the Pd(II) state must be the primary
oxi-dation state on the PdO thin film in the potential range between 0.45 and 0.9 V. Electro-oxidation of metal Pd in acidic media has been proposed to proceed via the following reactions[29,30,36]:
Pd+ H2O→ PdO + 2H++ 2e−, (1)
Pd+ 2H2O→ Pd(OH)2+ 2H++ 2e−. (2)
As to be discussed below, the presence of the surface hydrox-ide is important to the enhancement in the electrocatalytic activity of Pt nanoparticles, which were electrodeposited on the PdO thin film, toward MOR. The cathodic peak between 0.15 and 0.45 V in the reverse sweep is due to the reduction of the surface oxide and hydroxide which are formed during the preceding positive sweep. 3.1.2. Methanol electro-oxidation on the PdO electrode
Fig. 4shows a cyclic voltammogram of the PdO thin film in an aqueous solution of 1 M CH3OH + 0.5 M H2SO4. After the first scan
cycle, the CV profile of the PdO thin film is very similar to that of a Pt electrode. In addition to the hydrogen peaks below 0 V, two anodic peaks are situated in the potential range between 0.2 and 0.8 V. We have performed a CV measurement for the as-deposited PdO thin film in the potential range between 0.4 and 0.9 V, where PdO reduction is unimportant, and the result shown in the inset ofFig. 4 indicates that PdO has little electrocatalytic activity toward MOR. Therefore the anodic peak situated at 0.58 V must be due to MOR occurring on metallic Pd sites, which are produced as a result of the PdO reduction during the potential sweep from−0.2 to 0.45 V. Pre-vious study shows that Pd has an electrocatalytic behavior similar
Fig. 4. The cyclic voltammogram of the PdO thin film in the aqueous solution of 1 M
CH3OH + 0.5 M H2SO4. The inset shows a CV curve with a scan range of 0.4–0.9 V at
the tenth scan cycle. The scan rate was 20 mV s−1.
to Pt for electro-oxidation of methanol, ethanol and formic acid in acidic or alkaline media[42–44]. Methanol chemisorption can take place on these metal Pd sites, and MOR starts around 0.33 V. The MOR current density increases with the CV cycle number during the first 5 CV cycles, indicating that the repetitive PdO reduction and Pd oxidation during the CV scan increase the number of Pd elec-trocatalytic sites on the PdO electrode. The XPS analysis does show that the amount of metal Pd increases with the cycle number of the CV scan (the Pd 3d spectrum of the PdO electrode after 10 cycles of the CV scan is similar to that ofFig. 3(d)). The current density becomes independent on the CV cycle number after the sixth CV cycle, suggesting that the surface of the PdO electrode is saturated with active metal Pd sites as a result of the repetitive CV scan. The MOR current density increases by a factor of 1.54 after 10 cycles of the CV scan as compared with the first CV cycle.
In the reverse sweep, an anodic peak starts at 0.65 V with the peak maximum at 0.46 V. For Pt electrodes, the anodic peak in the reverse sweep is generally ascribed to oxidation of carbonaceous adspecies, which are incompletely oxidized intermediates formed in the forward sweep[11,12,45,46]. However, some previous stud-ies proposed that the anodic peak in the reverse scan resulted from methanol oxidation on metal Pt sites, which were reactivated dur-ing the reverse sweep from the upper limit potential of the CV scan [24,47,48]. Because metal Pd sites are absent on the PdO electrode at potentials above 0.45 V in the acidic solution and, as discussed above, the PdO electrode has little electrocatalytic activity toward MOR between 0.4 and 0.9 V, the large anodic current density
measured in the potential range of 0.4–0.65 V (in the reverse sweep) is unlikely due to methanol oxidation on the PdO electrode. There-fore, we believe that the anodic peak in the reverse CV sweep is a result of oxidation of carbonaceous adspecies on the PdO electrode. Accompanied with the anodic peak is a shoulder peak with the peak maximum around 0.33 V, which is close to the peak potential of the PdO reduction (Fig. 2). Note that the MOR anodic peak in the posi-tive sweep has a shoulder feature as well, which is especially obvi-ous for the tenth CV cycle; the shoulder peak is around the onset potential (0.45 V) of the Pd oxidation on the nanoflake thin film. We thus believe that the observation of the shoulder features for both the forward and the reverse anodic peaks is associated with the Pd/PdO redox reaction on the PdO electrode in the acidic solution. 3.2. Electrocatalytic activity of the Pt/PdO electrode toward MOR
Fig. 5(a) shows the SEM image of the PdO thin film after the pulse-electrodeposition of Pt nanoparticles. The Pt nanoparticle-loaded PdO thin film has a flake shape much less sharp than the as-deposited PdO thin film shown inFig. 1because of the accu-mulation of Pt nanoparticles on the ridge of the nanoflake. The nanoparticle accumulation is likely due to that the electric field is concentrated around the ridge area during the electrodeposi-tion, resulting in a higher deposition rate of Pt nanoparticles on the ridge than on the sidewall. The XRD spectrum of the Pt/PdO thin film is shown inFig. 5(b). The two diffraction peaks situated at 40.2◦ and 68.3◦correspond to the Pt (1 1 1) and the (2 2 0) lattice planes, respectively. The other diffraction peaks shown in the XRD spec-trum are due to the hexagonal lattice structure of graphite[49]. The average particle size of Pt nanoparticles on the PdO nanoflakes thin film is 5.5 nm according to the Debye-Scherrer calculation based on the peak width of the Pt (1 1 1) diffraction peak[2,43]; the derived particle size is very close to the size observed in high resolution TEM (HRTEM) images discussed below.
Fig. 6(a) shows the bright field TEM image of electrodeposited Pt nanoparticles on PdO nanoflakes, which were separated from the Pt/PdO electrode by ultrasonic agitation in the ethanol solu-tion. Spots of dark contrast are densely distributed on the PdO nanoflakes. The HRTEM images of the edge of a nanoflake (Fig. 6(b) and (c)) indicate that the dark spots are due to Pt nanocrystals; the two lattice spacings labelled by A and B correspond to the Pt (1 1 1) and (2 0 0) lattice planes, respectively. The size of most Pt nanopar-ticles is in the range between 3.0 and 5.5 nm, which is reasonably in agreement with the average size derived from the XRD analysis. The Pt nanoparticles uniformly spread over the PdO nanoflake although particle aggregation occurs in some areas. Because of the nanoscale size and the good dispersion of Pt nanoparticles on the PdO nanoflake, a large portion of Pt surface atoms on the nanoparticles
Fig. 6. (a) Bright field TEM image of electrodeposited Pt nanoparticles on PdO nanoflakes; (b) HRTEM image of the edge of a nanoflake; and (c) HRTEM image of the squared
area in (b).
must locate in the peripheral area that adjoins the PdO substrate. As a consequence, numerous Pt electrochemical active sites are sub-ject to strong local chemical and electronic modifications induced by the PdO substrate. These modifications can greatly influence the electrocatalytic activity of the Pt nanoparticles toward MOR. 3.2.1. Methanol electro-oxidation on the Pt/PdO electrode
The cyclic voltammogram of the Pt/PdO electrode in the aqueous solution of 1 M CH3OH and 0.5 M H2SO4 is shown in
Fig. 7. For comparison, the figure also presents CV curves of an
Fig. 7. Cyclic voltammograms of the Pt/PdO, the Pt/C and the blanket-Pt electrodes
in the aqueous solution of 1 M CH3OH + 0.5 M H2SO4. The CV curves shown in the
figure are for the fourth CV cycle. The scan rate was 20 mV s−1.
electron-beam deposited Pt thin film and electrodeposited Pt parti-cles; both types of the Pt electrocatalyst were deposited directly on the carbon cloth, and we refer to the Pt thin film and the Pt particle electrodes thereafter as blanket-Pt and Pt/C, respectively. The MOR peak of the Pt/PdO electrode has the peak maximum around 0.62 V with the onset potential at 0.45 V. The Pt/PdO electrode has both the MOR peak potential and the onset potential less positive than the Pt/C and the blanket-Pt electrodes, indicating that the Pt/PdO electrode has a lower overpotential for methanol electro-oxidation. Moreover, the Pt/PdO electrode has a much larger intensity ratio of the MOR peak (denoted by If) to the anodic peak in the reverse
scan (denoted by Ib) than the other two electrodes. The If/Ibratio
of the Pt/PdO electrode is 1.87, and the ratio for the Pt/C and the blanket-Pt electrodes is 1.28 and 1.22, respectively. We may use the If/Ib ratio as an index to describe the resistance of the
elec-trocatalyst against CO poisoning in MOR. The larger If/Ib ratio of
the Pt/PdO electrode indicates that Pt nanoparticles on the PdO support have a higher CO tolerance. The efficient removal of CO adspecies is crucial for improving the electrochemical performance in DMFCs. To examine the CO tolerance of the Pt/PdO electrode, we performed the CO stripping measurement for the electrode and the result is presented inFig. 8. Also shown in the figure are the CO stripping CVs of the Pt/C, the blanket Pt and the as-deposited PdO thin film electrodes. The onset and the peak potentials of the CO stripping peak are listed inTable 1. The Pt/PdO electrode has the CO oxidation peak potential smaller than the PdO thin film elec-trode by 0.12 V. According to the Pd 3d3/2spectrum (Fig. 3(d)), the
PdO thin film is extensively reduced after being polarized at 0.1 V in the 0.5 M H2SO4solution (i.e., the polarization condition for the CO
Fig. 8. CO stripping CV curves for the Pt/PdO, the PdO thin film, the Pt/C and the
blanket Pt electrodes. The scan rate was 20 mV s−1.
PdO thin film electrode actually stems from metal Pd surface sites. The large difference in the stripping potential between the Pt/PdO and the PdO thin film electrodes suggests that the CO stripping peak of the Pt/PdO electrode has a trivial contribution from metal Pd sites. Compared with the Pt/C and the blanket-Pt electrodes, the Pt/PdO electrode has smaller CO stripping peak potential and onset potential, indicating that CO adspecies are easier to be oxidized on the Pt/PdO electrode.
The electrochemical surface area (ESA) of a Pt based catalyst is often determined by the total charge in the hydrogen adsorption (or desorption) region in a CV voltammogram. However, metal Pd has a great capacity of hydrogen absorption, the ESA of the Pt catalyst on the PdO support might be overestimated if the hydrogen region is used to calculate the ESA. We thus used the CO stripping peak to estimate the ESA of the studied electrodes, which is calculated by the following equation:
ESA= SR MPt =
QCO
0.484 × MPt
(3) where SR is the real surface area of the catalyst, MPt
repre-sents the Pt loading (mg) on the electrode, QCO (mC) is the total
charge calculated from the CO stripping peak, and the value 0.484 (mC cm−2) corresponds to the charge density required for the electro-oxidation of one monolayer of CO adspecies on the Pt sur-face[50]. The calculated ESA and the real surface area of the three Pt-based electrodes are listed inTable 1. The Pt/PdO electrode has a much larger SR(14.409 cm2) than the other two electrodes and
thus exhibits a much higher electrocatalytic activity toward MOR as shown by the CV curves inFig. 7. The large SRof the Pt/PdO electrode
is ascribed to the uniform distribution of dense Pt nanoparticles
Table 1
The onset and peak potentials of CO electro-oxidation, the If/Ibratio of methanol
electro-oxidation peaks and the electrochemical active surfaces area (SRand ESA)
for the Pt/PdO, the Pt/C, the blanket-Pt and the PdO electrodes.
Pt/PdO Pt/C Blanket-Pt PdO Onset potential (V) 0.49 0.52 0.52 0.59 Peak potential (V) 0.55 0.58 0.63 0.67 If/Ib 1.87 1.28 1.22
Real area (SR) (cm2) 14.409 2.548 4.228 12.500
ESA (cm2mg−1) 189.6 82.2 52.2 a
aThe PdO electrode was used as the Pt support, and hence only its S Ris given
here.
on the PdO nanoflake substrate, which provides a large surface area (12.50 cm2 as listed inTable 1) for the Pt loading. Note that
the SR of the PdO substrate, which was also determined by CO
stripping CV measurement, may not truly represent the Pt loading area because the surface PdO was reduced to metallic Pd during the CV measurement and the nanoflake geometry could be significantly modified. However, the large loading area of Pt nanoparticles can still be realized by the measured SRof the PdO nanoflake support.
3.2.2. Synergism of the bifunctional mechanism and the electronic effect
Compared with the two electrodes without the PdO support, the Pt/PdO electrode has a lower overpotential for MOR and a high CO tolerance, suggesting that the PdO nanoflake must play an important role in the enhancement of the electrocatalytic performance of the Pt nanoparticles. The enhancement in the electrocatalytic activity of Pt catalysts toward MOR is generally explained by the bifunctional mechanism and the electronic effect models[1,5,7,11,13,51]. The bifunctional mechanism is widely used to describe how hydroxyl surface groups oxidize CO adspecies on neighboring Pt adsorption sites, thus avoiding the CO poisoning. For the Pt/PdO electrode, Pt nanoparticles are surrounded by abun-dant Pd-OH surface groups, which are produced when metal Pd sites are oxidized in the acidic electrolyte via Eq.(2). CO adspecies on the periphery of a Pt nanoparticle are readily oxidized by neigh-bouring Pd-OH surface groups because of immediate interactions of the CO adspecies with Pd-OH groups surrounding the Pt nanopar-ticle[11,13]. This CO oxidation is via a reaction mechanism just like the widely accepted bifunctional mechanism occurring to Pt based binary alloys, such as Pt–Pd and Pt–Ru. Further adsorption of OH species on free Pt sites on the nanoparticle may occur by means of OH adspecies migration from the PdO support and/or dissocia-tive adsorption of H2O molecules from the electrolyte. These OH
adspecies can progressively oxidize CO adspecies in the inner sur-face area of the nanoparticle via the Langmuir–Hinshelwood (L–H) reaction mechanism, which describes that two diffusing surface reactants collide with each other to form the product in a surface reaction. The CO oxidation reaction can free more Pt electrocat-alytic sites on the nanoparticle, thereby allowing further methanol adsorption and oxidation. A smaller Pt nanoparticle should be less susceptible to the CO poisoning because the bifunctional mecha-nism and the L-H mechamecha-nism can be more kinetically active on the nanoparticle that has a large peripheral region and short diffusion distance.
Besides the bifunctional mechanism, electronic interactions between Pt nanoparticles and the PdO support can also improve the electrocatalytic activity of the Pt catalyst toward MOR. The electronic interaction may modify the electronic structure of the Pt nanoparticle and thus alter the chemisorption behavior of CO adspecies on the nanoparticle. If the adsorption strength of CO adspecies becomes weaker as a result of the electronic structure modification of the Pt nanoparticle, the oxidation of CO adspecies by surrounding OH adspecies may be kinetically favored, leading to a better catalytic activity of the Pt nanoparticle toward MOR. Fig. 9shows Pt 4f spectra of the Pt/PdO, the Pt/C and the blanket-Pt electrodes before the electrochemical measurement. The Pt 4f7/2
peak of the Pt/PdO electrode is situated at 70.8 eV, which negatively shifts from that of the blanket Pt thin film (71.4 eV) by∼0.6 eV. Previous studies have shown that the binding energy of core level electrons of metal nanoparticles shifts positively from that of the bulk counterpart as a function of the particle size[52–55]. The binding energy shift due to the nanosize effect generally increases with decreasing the size of metal nanoparticles, and the size effect on the energy shift becomes unimportant when the particle size is larger than 3 nm[54]. Therefore, the large negative shift in the Pt 4f7/2 binding energy is unlikely to result from the nanosize
Fig. 9. Pt 4f spectra of the Pt/PdO, the Pt/C and the blanket-Pt electrodes before the
electrochemical measurement.
effect but is caused by an electronic interaction between the Pt nanoparticle and the PdO support. The negative binding energy shift indicates that negative charge transfer from the PdO support to Pt nanoparticles must occur. The Pt/C electrode has the Pt 4f peak maximum at 71.2 eV; the less negative Pt 4f energy shift compared with the Pt/PdO electrode indicates that Pt particles on the Pt/C electrode are subject to a smaller electronic modification. In combination with the CV measurements, the XPS analyses clearly show the importance of the PdO substrate to the elec-tronic effect, which can enhance the electrocatalytic activity of Pt nanoparticles toward MOR. The electronic effect must be prevailing in the periphery of a nanoparticle. Surface atoms in the periph-eral region of a smaller Pt nanoparticle should experience a larger electronic modification than those in the inner area as a result of their close proximity to the interface between the Pt nanoparti-cle and the PdO support, at where the charge transfer takes place [11,13]. A smaller Pt particle size will result in a stronger electronic effect because the peripheral Pt surface atoms occupy a large por-tion of the surface area of the particle. Most Pt particles on the Pt/C electrode have a size in the order of a few tens of nanome-ters. The poorer electrochemical performance of the Pt/C electrode compared with the Pt/PdO electrode may be partly due to the larger particle size.
3.2.3. Electrochemical stability of the Pt/PdO electrode in acidic media
To study the electrocatalytic stability of the Pt/PdO electrode in the solution of 1 M CH3OH + 0.5 M H2SO4, we carried out
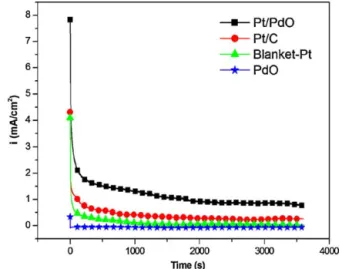
chronoam-perometric test at 0.5 V. The chronoamperograms shown inFig. 10 clearly demonstrates that the Pt/PdO electrode has a much better chronoamperometric performance than the Pt/C and the blanket-Pt electrodes. The blanket-Pt/PdO electrode has a gradual decrease in the current density within the first 30 min, and then its current density keeps steady at∼0.8 mA cm−2. On the other hand, the Pt/C and the
blanket-Pt electrodes show a low current density of 0.27 mA cm−2 and 0.02 mA cm−2, respectively, after one hour of the chronoamper-ometric test. The much better chronoamperchronoamper-ometric performance of the Pt/PdO electrode can be attributed to the better CO toler-ance of Pt nanoparticles. Metal Pd is liable to anodic dissolution in acidic electrolytes and, therefore, is considered an unsuitable electrocatalyst in DMFCs[27,29,30]. The occurrence of anodic dis-solution of a Pd electrode during a CV measurement is due to that the surface PdO and Pd(OH)2, which are formed on the Pd
electrode in the forward sweep, is reduced in the reverse sweep, producing Pd2+ions in the solution[29,30]. Since the PdO nanoflake
has a CV behavior similar to metal Pd, the anodic dissolution is
Fig. 10. Chronoamperograms of the Pt/PdO electrode, the Pt/C, the blanket-Pt and
the PdO electrodes in the aqueous solution of 1 M CH3OH + 0.5 M H2SO4at room
temperature for 1 h. The oxidation potential was kept at 0.5 V vs. SCE.
also expected to occur to the PdO nanoflake electrode. However, the observation that the Pt/PdO electrode has a steady current density after 30 min of the chronoamperometric test suggests that the electrode has a better chemical stability in the acidic
solu-Fig. 11. SEM images of (a) the PdO nanoflake electrode and (b) the Pt/PdO electrode
tion.Fig. 11(a) shows the SEM image of a PdO nanoflake electrode after 10 CV cycles in the solution of 1 M CH3OH + 0.5 M H2SO4.
The nanoflake morphology of the PdO/C electrode was severely damaged after the CV test, indicating vigorous anodic dissolution of Pd occurred. In contrast, the electrodeposited Pt nanoparticles seem to be able to suppress the anodic dissolution of the PdO sup-port.Fig. 11(b) shows that the nanoflake feature of the Pt/PdO electrode after 10 cycles of the CV exhibits a trivial change from that of the as-prepared electrode shown in the SEM image inFig. 5. It has been reported that the change in the surface chemical composition of Pd-containing alloys can affect the electrodissolution behavior of the alloys[30,56,57]. The electrodeposition of Pt nanoparticles may electrochemically stabilize the PdO nanoflake surface, thereby alleviating the anodic Pd dissolution during the CV measurement. Besides, the chronoamperometric test was performed at 0.5 V, which is above the potential range where the PdO reduction takes place. Therefore, active anodic Pd dissolution as a result of the PdO reduction was unlikely to occur in the test, and a stable chronoam-perometric behavior was thus obtained. This argument is supported by the chronoamperometric result of the as-deposited PdO thin film electrode shown inFig. 10. The PdO electrode is completely inactive under the experimental condition, indicating the absence of metal Pd sites on the electrode. It is likely that the electrochemical sta-bility of the Pt/PdO electrode depends on the amount of Pt loading, and hence an optimal ratio of Pt to PdO (or the surface coverage of Pt nanoparticles on PdO) may exist, which can lead to desir-able electrochemical performance and stability of the electrode in the acidic electrolyte. This dependence requires further study, and we are undertaking the study using atomic layer deposition, instead of electrodeposition, to better control the Pt loading on the substrate.
4. Conclusion
We prepared PdO nanoflake thin films on carbon cloths by reactive sputtering deposition, and pulse-electrodeposited Pt nanoparticles on the PdO thin films. The nanoflake morphology of the PdO support provides a large surface area for Pt nanopar-ticle loading, resulting in a large ESA. The electrocatalytic activity of the PdO thin film and the Pt/PdO electrode toward MOR was studied in acidic media. The PdO nanoflake thin film has a CV behavior similar to a metallic Pd electrode. According to XPS anal-ysis, a thin metallic Pd surface layer is produced on the PdO nanoflake thin film after the first cycle of the CV test in the aque-ous H2SO4solution. Because of the repetitive PdO reduction and
Pd oxidation in the acidic solution, methanol electro-oxidation on the PdO nanoflake thin film exhibits a CV feature that is closely related to the Pd/PdO redox reaction. The Pt/PdO electrode has a higher electrocatalytic activity toward MOR than the Pt/C and the blanket-Pt electrodes. The much better electrocatalytic perfor-mance of the Pt/PdO electrode is ascribed to a high CO tolerance and the large ESA. The high CO tolerance of the Pt–PdO electrode is a result of the synergism of the bifunctional mechanism and the electronic effect. The XPS study shows that negative charge transfer occurs from the PdO support to the Pt nanoparticles. The electronic interaction may modify adsorption properties of adspecies on the Pt nanoparticles, and thus affect electrochemi-cal properties of the Pt/PdO electrode. The nanoflake morphology of the as-deposited PdO thin film is seriously damaged after the CV test because of the anodic dissolution of metal Pd in acidic media. However, the anodic dissolution is greatly alleviated when Pt nanoparticles are electrodeposited on the PdO nanoflake thin film.
Acknowledgments
This work was supported by the National Science Council of R.O.C. under Contract No. NSC97-2221-E-009-016-MY3. The technical support from National Nano Device Laboratories is grate-fully acknowledged.
References
[1] J.M. Léger, S. Rousseau, C. Coutanceau, F. Hahn, C. Lamy, Electrochim. Acta 50 (2005) 5118–5125.
[2] K.W. Park, J.H. Choi, B.K. Kwon, S.A. Lee, Y.E. Sung, H.Y. Ha, S.A. Hong, H. Kim, A. Wieckowski, J. Phys. Chem. B 106 (2002) 1869–1877.
[3] S. Papadimitriou, S. Armyanov, E. Valova, A. Hubin, O. Steenhaut, E. Pavlidou, G. Kokkinidis, S. Sotiropoulos, J. Phys. Chem. C 114 (2010) 5217–5223. [4] P. Waszczuk, G.Q. Lu, A. Wieckowski, C. Lu, C. Rice, R.I. Masel, Electrochim. Acta
47 (2002) 3637–3652.
[5] G.Y. Zhao, C.L. Xu, D.J. Guo, H. Li, H.L. Li, J. Power Sources 162 (2006) 492–496. [6] M.C. Tsai, T.K. Yeh, C.H. Tsai, Electrochem. Commun. 8 (2006) 1445–1452. [7] E. Antolini, Appl. Catal. B 74 (2007) 337–350.
[8] Y.W. Lee, A.R. Ko, S.B. Han, H.S. Kim, K.W. Park, Phys. Chem. Chem. Phys. 13 (2011) 5569–5572.
[9] Y.J. Gu, W.T. Wong, J. Electrochem. Soc. 153 (2006) A1714–A1718.
[10] B.E. Hayden, D. Pletcher, J.P. Suchsland, L.J. Williams, Phys. Chem. Chem. Phys. 11 (2009) 1564–1570.
[11] C.S. Chen, F.M. Pan, Appl. Catal. B 91 (2009) 663–669.
[12] M.A. Scibioh, S.K. Kim, E.A. Cho, T.H. Lim, S.A. Hong, H.Y. Ha, Appl. Catal. B 84 (2008) 773–782.
[13] C.S. Chen, F.M. Pan, H.J. Yu, Appl. Catal. B 104 (2011) 382–389. [14] T.C. Wen, C.C. Hu, J. Electrochem. Soc. 140 (1993) 988–995. [15] A.E. Bolzán, J. Electroanal. Chem. 437 (1997) 199–208.
[16] M. Wang, D.J. Guo, H.L. Li, J. Solid State Chem. 178 (2005) 1996–2000. [17] P.K. Shen, C. Xu, Electrochem. Commun. 8 (2006) 184–188.
[18] C.W. Xu, H. Wang, P.K. Shen, S.P. Jiang, Adv. Mater. 19 (2007) 4256–4259. [19] Y. Zhu, Y. Kang, Z. Zou, Q. Zhou, J. Zheng, B. Xia, H. Yang, Electrochem. Commun.
10 (2008) 802–805.
[20] F. Jia, K.W. Wong, R. Du, Electrochem. Commun. 11 (2009) 519–521. [21] R.K. Pandey, V. Lakshminarayanan, J. Phys. Chem. C 113 (2009) 21596–21603. [22] Z. Yin, H. Zheng, D. Ma, X. Bao, J. Phys. Chem. C 113 (2008) 1001–1005. [23] C. Bianchini, P.K. Shen, Chem. Rev. 109 (2009) 4183–4206.
[24] X. Wang, W. Wang, Z. Qi, C. Zhao, H. Ji, Z. Zhang, J. Power Sources 195 (2010) 6740–6747.
[25] F. Miao, B. Tao, L. Sun, T. Liu, J. You, L. Wang, P.K. Chu, J. Power Sources 195 (2010) 146–150.
[26] D.A.J. Rand, R. Woods, J. Electroanal. Chem. Interfacial Electrochem. 35 (1972) 209–218.
[27] S.H. Cadle, J. Electrochem. Soc. 121 (1974) 645–648.
[28] L.H. Dall’Antonia, G. Tremiliosi-Filho, G. Jerkiewicz, J. Electroanal. Chem. 502 (2001) 72–81.
[29] K. Juodkazis, J. Juodkazyt ˙e, B. ˇSebeka, G. Stalnionis, A. Lukinskas, Russ. J. Elec-trochem. 39 (2003) 954–959.
[30] M. Grden, M. Lukaszewski, G. Jerkiewicz, A. Czerwinski, Electrochim. Acta 53 (2008) 7583–7598.
[31] Y. Du, K. Lv, B. Su, N. Zhang, C. Wang, J. Appl. Electrochem. 39 (2009) 2409–2414. [32] O. Yepez, P.G. Pickup, Electrochem. Solid-State Lett. 8 (2005) E35–E38. [33] C.J. Huang, F.M. Pan, H.Y. Chen, C. Li, J. Appl. Phys. 108 (2010) 053105–053106. [34] L.S. Kibis, A.I. Titkov, A.I. Stadnichenko, S.V. Koscheev, A.I. Boronin, Appl. Surf.
Sci. 255 (2009) 9248–9254.
[35] T. Pillo, R. Zimmermann, P. Steiner, S. Hüfner, J. Phys.: Condens. Matter 9 (1997) 3987–3999.
[36] K.S. Kim, A.F. Gossmann, N. Winograd, Anal. Chem. 46 (1974) 197–200. [37] Y.N. Wu, S.J. Liao, Y.L. Su, J.H. Zeng, D. Dang, J. Power Sources 195 (2010)
6459–6462.
[38] C. Gabrielli, P.P. Grand, A. Lasia, H. Perrot, J. Electrochem. Soc. 151 (2004) A1937–A1942.
[39] A. Czerwinski, R. Marassi, S. Zamponi, J. Electroanal. Chem. Interfacial Elec-trochem. 316 (1991) 211–221.
[40] M.S. Rau, P.M. Quaino, M.R. Gennero de Chialvo, A.C. Chialvo, Electrochem. Commun. 10 (2008) 208–212.
[41] A.J. Zhang, M. Gaur, V.I. Birss, J. Electroanal. Chem. 389 (1995) 149–159. [42] Y.N. Wu, S.J. Liao, Z.X. Liang, L.J. Yang, R.F. Wang, J. Power Sources 194 (2009)
805–810.
[43] Z. Liu, L. Hong, M.P. Tham, T.H. Lim, H. Jiang, J. Power Sources 161 (2006) 831–835.
[44] Y. Wang, T.S. Nguyen, X. Liu, X. Wang, J. Power Sources 195 (2010) 2619–2622. [45] R. Manoharan, J.B. Goodenough, J. Mater. Chem. 2 (1992) 875–887.
[46] J. Prabhuram, R. Manoharan, J. Power Sources 74 (1998) 54–61.
[47] Q. He, W. Chen, S. Mukerjee, S. Chen, F. Laufek, J. Power Sources 187 (2009) 298–304.
[48] M. Sevilla, C. Sanchís, T. Valdés-Solís, E. Morallón, A.B. Fuertes, Electrochim. Acta 54 (2009) 2234–2238.
[50] A. Pozio, M. De Francesco, A. Cemmi, F. Cardellini, L. Giorgi, J. Power Sources 105 (2002) 13–19.
[51] C. Lu, C. Rice, R.I. Masel, P.K. Babu, P. Waszczuk, H.S. Kim, E. Oldfield, A. Wieck-owski, J. Phys. Chem. B 106 (2002) 9581–9589.
[52] S. Garbarino, A. Pereira, C. Hamel, E. Irissou, M. Chaker, D. Guay, J. Phys. Chem. C 114 (2010) 2980–2988.
[53] A. Howard, D.N.S. Clark, C.E.J. Mitchell, R.G. Egdell, V.R. Dhanak, Surf. Sci. 518 (2002) 210–224.
[54] P. Marcus, C. Hinnen, Surf. Sci. (1997) 134–142.
[55] S. Guerin, B.E. Hayden, D. Pletcher, M.E. Rendall, J.P. Suchsland, L.J. Williams, J. Comb. Chem. 8 (2006) 791–798.
[56] J.L. Rousset, A.J. Renouprez, A.M. Cadrot, Phys. Rev. B 58 (1998) 2150– 2156.