A Hybrid of Sequential Rules and Collaborative Filtering for
Product Recommendation
Duen-Ren Liu, Chin-Hui Lai, Wang-Jung Lee
Institute of Information Management
National Chiao Tung University, Taiwan
Abstract
Customers’ purchase behavior may vary over time.
Traditional collaborative filtering (CF) methods make recommendations to a target customer based on the purchase behavior of customers whose preferences are similar to those of the target customer; however, the methods do not consider how the customers’ purchase behavior may vary over time. Although the sequential rule method considers the sequence of customers’ purchase behavior over time, it does not make use of the target customer’s purchase data for the current period. To resolve the above problems, this work proposes a novel hybrid recommendation method that combines the segmentation-based sequential rule method with the segmentation-based CF method. Experiment results show that the hybrid method outperforms traditional CF methods.
Keywords: Collaborative Filtering, Customer Segmentation, Product Recommendation, Sequential Rule
1. Introduction
Recommender systems are a specific type of information filtering technology that allows a company to filter unnecessary information, and thereby proactively provide products for its customers based on their interests. Schafer et al. [16] presented a detailed taxonomy of recommender systems in E-commerce, and elucidated how they can be used to provide personalized service in order to establish and strengthen customer loyalty. A number of methods have been proposed for recommender systems, for example, collaborative filtering (CF), content-based filtering (CBF), and hybrid approaches. Collaborative filtering, the most frequently used method, predicts a target customer’s preferences based on the opinions of similar customers. A typical CF method employs the K-nearest neighbors (KNN) approach to derive Top-N recommendations. For example, the Siteseer system [13] uses a KNN-based CF method to provide Web page recommendations,
recommend Usenet News and movies. However, a limitation of traditional CF methods is that they do not consider a customer’s purchase sequences, which identify the customer’s preferences over time. Although CF methods may use all the purchase data about customers’ preferences to make recommendations, they neglect the effect of the time factor. Alternatively, CF methods may use the purchase data during the latest period, T, to make recommendations, but they too neglect the target customer’s purchase history prior to period T.
To overcome the limitations of traditional CF methods, Cho et al. [4] proposed a sequential rule-based recommendation method that considers the evolution of customers’ purchase sequences. The method applies sequential rules to keep track of customers’ preferences during l periods, with T as the current (latest) period. A sequential rule is expressed in the form CT-l+1,…, CT-1 => CT, where CT represents
the customers’ purchase behavior in period T. If a target customer’s purchase behavior prior to period T was similar to the conditional part of the rule, then it is predicted that his/her purchase behavior in period
T will be CT. Accordingly, CT is used to recommend
products to the target customer in T. Although the sequential rule method considers customers’ purchase sequences over time in order to improve the quality of recommendations, it does not make use of the target customer’s purchase data for period T. A target customer may have made purchases in period T already; hence, the purchase data could be used to make recommendations. Moreover, the method does not consider customer segmentations, which can help improve the quality of recommendations by making suggestions based on the preferences of different customer groups.
To take advantage of the merits of typical CF and sequential rule-based recommendation methods, we propose a novel hybrid recommendation approach that combines the segmentation-based sequential rule (SSR) method with the segmentation-based KNN-CF (SKCF) method. The hybrid approach considers customer segmentation information, sequential rules over time, and the target customer’s purchase data for
recommendations. The SSR method ignores the target customer’s purchases in period T, while the SKCF method does not consider the purchase sequences of customers over time. Thus, we propose a hybrid method, a linear combination of SSR and SKCF methods, to resolve these problems, and predict which products the target customer will buy in period T. In other words, to enhance the quality of recommendations, the hybrid method considers customers’ purchase sequences over time and their purchase data for period T.
We conducted experiments to evaluate the recommendation quality of the proposed hybrid method compared to that of the SSR, SKCF, and KNN-based CF methods. The experiment results demonstrate that the hybrid approach outperforms the other methods.
The remainder of this paper is organized as follows. In Section 2, we review the literature on customer segmentation, RFM evaluation, clustering, and recommender systems. The proposed hybrid method is described in Section 3. Section 4 details our experiment evaluations. Then, in Section 5, we present our conclusions.
2. Related Work
2.1 Customer Segmentation
Customer segmentation divides a market into discrete customer groups that share similar characteristics. Customer lifetime value (CLV) is typically used to identify profitable customers and to develop strategies to target customers [6][9]. RFM [2] values, which stand for Recency-Frequency- Monetary variables, are widely used to identify customers’ lifetime value. RFM values are defined as follows. (1) R (Recency): the period since the last purchase; a lower value corresponds to a higher probability that the customer will make repeat purchases. (2) F (Frequency): the number of purchases made within a certain period; a higher frequency indicates stronger loyalty. (3) M (Monetary): the amount of money spent during a certain period; a higher value indicates that the company should focus more on that customer. Customers are segmented into various target markets according to their RFM values.
Clustering
Clustering techniques, which are used to segment markets [3][12], try to maximize the variance among groups, while minimizing the variance within groups.
Many clustering algorithms have been developed, for example, the K-means [10], SOM [5] [20], hierarchical, and fuzzy c-means algorithms. In this study, we use K-means and SOM to segment customers and their transactions.
2.2 Recommender System
Recommender systems have been applied in many application domains such as movies [14], books [11], music [17] and etc.
2.2.1 Typical KNN-based Collaborative Filtering A typical KNN-based collaborative filtering (CF) method [14][15][17] employs the nearest-neighbor algorithm to recommend products to a target customer u based on the preferences of neighbor. Note that preferences are generally defined in terms of the customer’s purchase behavior; that is, purchased/non-purchased (binary choice) analysis of shopping basket data, or taste, namely, preference ratings (e.g.. 1 ~ 5 rating scale) for items. In this work, we focus on product recommendations based on binary choice analysis of shopping basket data.
Customer preferences, i.e., customer purchase history, are represented as a customer-item matrix R in which rij is equal to 1 if the ith customer purchased
the jth product; and zero otherwise. The similarity of customer preferences can be measured in various ways. A common method is to compute the Pearson correlation coefficient defined as follows:
∑
∑
∑
∈ ∈ ∈ − − − − = I s cs c sI c s c I s cs c c s c j i P j j i i j j i i r r r r r r r r c c corr 2 , 2 , , , ) ( ) ( ) )( ( ) , ( (1)where rci and rcj denote the average number
of products purchased by customers ci and cj, respectively; I denotes the set of products; and rci,s
and rcj,s indicate whether customers ci and cj
purchased product item s.
Customers are ranked by their similarity measures in relation to the target customer u, as determined the Pearson correlation coefficient. The k most similar (highest ranked) customers are selected as the k-nearest neighbors of customer u. Finally, the top-N recommended products are determined according to the preferences of the k-nearest neighbors of u.
2.2.2 Sequential Rule-based Recommendation The sequential rule method [4], which considers the evolution of customers’ purchase sequences in order to improve the quality of traditional CF,
involves two phases: a model building phase and a recommendation phase.
Model Building Phase
This phase involves three steps: transaction clustering, identification of cluster sequences, and extraction of sequential cluster rules. The SOM technique is used to group transactions with similar patterns. The result of transaction clustering is a set of q transaction clusters, C=
{
C1,C2,K,Cq}
, where each Cjis a subset of transactions. Each customer’stransactions over l periods are then transformed into a sequence of transaction clusters. LetLi be the behavior locus of customer i, which represents the sequence of clusters of customer i over l periods. It is defined as follows: Li =<Ci,T-l-1,…Ci,T-l, Ci,T>,
i=1,2,…,m, where Ci,T-k
∈
C, k=1,2,…,l-1, l≧2.Finally, sequential purchase patterns are extracted by time-based association rule mining. Association rule mining [1][18] discovers the relationships between product items based on patterns of co-occurrence across customer transactions. The conditional part of the sequential rule is <rj,T-l+1,…, rj,T-1>, and the consequent part is rj,T. The form of a
sequential ruleRjis:
(
j j)
T j T j l T j j r r r Support Confidence R : ,−+1,K, ,−1⇒ , , . , , , Cor andr C r where iT−k∈ φ jT∈ Here, Rjmeans that, if the locus of a customer isrj T l, − +1, ,K rj T, −1, then the customer’s behavior
cluster in period T will be
r
j T, . Recommendation PhaseThe recommendation phase is comprised of two steps: cluster sequence matching and recommending Top-N products. The best-matching locus of a target customer is determined by comparing the behavior locus and the sequential rules derived from purchase sequences. The similarity measure is necessary to determine the degree of match between the behavior locus of a target customer and the conditional part of the sequential rule. Let C , 1, , , 1
i i T l i T L = C − + K C − be
the behavior locus of target customer i during l-1 periods, and let C , 1, , , 1
j j T l j T
R = r − + K r − be the conditional part of sequential rule j. The similarity measure between C i L and C j R is defined as follows: 1 , , 1 l j j i i T k k SM − S − = =
∑
, , , 1, 0, i T k j T k j i T k if C r where S otherwise − − − = ⎧ = ⎨ ⎩ (2)Next, the similarity measure is multiplied by the support and confidence of the rule to derive the fitness measure, which indicates the goodness-of-fit between the behavior locus of customer i and the sequential rule j. According to the maximum fitness
measure, the transaction cluster of the target customer in period T is determined by the consequential part,r , of the sequential rule j. j T,
Let C denote the predicted transaction cluster of * a target customer in period T in the previous step. Then, the top-N products, i.e., the products listed in the customer transactions of C , are selected to * generate a recommendation list for the target customer.
3.
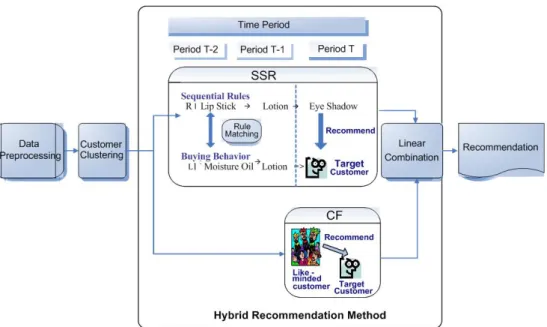
Hybrid MethodIn this section, we describe the proposed hybrid method, which combines the segmentation-based sequential rule (SSR) method and the collaborative filtering (CF) method. Figure 1 shows the architecture of the proposed hybrid method. The sequential rule-based (SR) method [4] does not consider customer segments and the target customer’s purchase data in period T. To take advantage of the merits of the CF and SR methods, our hybrid method combines the SSR method with the segmentation-based KNN-CF (SKCF) approach to enhance the quality of recommendations. The SSR method improves the quality of sequential rule-based recommendations by making recommendations based on customer groups. The SKCF method is used to provide recommendations based on customer groups. The two methods are described in Sections 3.1 and 3.2, respectively.
SSR and SKCF are combined linearly with a weighted combination, as shown in Eq. 3. For linear combination, a parameter
α
is set as a weight to determine the relative importance of the two methods. The two methods use the frequency count of items purchased in a set of transactions or by a group of neighbors (customers with similar purchase behavior) to derive the prediction scores of items for recommendations. Let SSRr represent the normalizedfrequency count (i.e., the frequency count divided by the maximal value of the frequency count in the SSR method) of the product item r obtained by SSR. Similarly, SKCFr is the normalized frequency count
of the product item r obtained by the SKCF method, while αand 1-α (ranging from 0 to 1) are the weights of CFr and SSRr respectively. Thus, HBr is
the result of the linear combination of the two methods. It is used to predict which products customers will buy at time T. Product items with the top-N HB values are selected for recommendation.
r r
r SSR SKCF
Figure 1. An overview of the proposed hybrid method
3.1 Segmentation-based Sequential Rule Method
Different from the sequential rule-based (SR) method [4], which does not consider customer segmentation, the proposed SSR method improves the recommendation quality of SR method by making recommendations based on customer groups. The method first creates a model of sequential rules, and then selects products for recommendation to target customers.
Customer clustering
K-means method is used to cluster customers into distinct groups based on their RFM values. Each group represents a specific market segment and the customers in a group have similar RFM values. The rationale behind customer segmentation is that if customers exhibited similar purchasing behavior or made similar purchases in previous periods, then they are very likely to have similar RFM values in the present period. Therefore, customers with similar RFM values are grouped into customer segments as the basis for model building and making recommendations.
Transaction Clustering
Transaction clustering divides transactions into groups (transaction clusters) based on similar product items and buying patterns. The rationale for using transaction clusters rather than product items to identify customers’ purchasing behavior is as follows. Customers’ frequent purchasing behavior can be represented as sequential rules of transaction clusters over l periods. The target customer’s purchasing behavior is identified by matching his transactions
sequential rules. After identifying the target customer’s transaction cluster at time T, product items in the target transaction cluster are the candidates for recommendation. The matching process compares the similarity between the target customer’s behavior and the sequential rule based on transaction clusters. If their transaction clusters are the same, the purchasing behavior is similar, even though the product items in the clusters may be different. Thus, transaction clustering provides a more flexible means of identifying similar purchase behavior and should therefore provide more accurate recommendations.
A transaction, which records the products purchased by a customer, is transformed into a bit vector; and the vectors from the transaction records of all customers form a transaction matrix. The matrix is then used to derive transaction clusters. Let
D be the set of all transactions made by m customers
over l periods, as defined in Eq. 4. A transaction matrix is derived from the transaction set D.
} 1 , 1 , on transacti | {D, f i mT l j T D f j i ∀ ≤ ≤ − + ≤ ≤ = { } , 0 item contains , 1 , , 1 , ⎩ ⎨ ⎧ = = otherwise k f if I I .. ,.., I I Difj f, f,k f,n f,k (4)
whereDif,j is defined as a transaction f made by customer i in period j, i.e., the product items customer i bought in that transaction. Note that customer i may make several transactions in period j. EachDif,j is transformed into a bit vector. If,k is
set to 1 if the transaction f contains the product item k; otherwise, it is set to 0. The SOM clustering technique [20] is used to cluster all transactions and assign each transaction to a cluster. The results of transaction clustering is a set of q clusters:
Mining Customer Behavior
Transactions made by customers over l periods are transformed into a set of transaction-clusters C, arranged according to the time period and the customer’s ID. In a given period, a customer’s transactions may belong to different transaction clusters. Thus, the transactions made by a customer i in period j are transformed into a set of transaction clusters. Let Ci,j be the set of transaction clusters of
customer i for period j. Note that Ci,j is a subset of C
and may be empty. In contrast to the SR method [4], which does not consider customer segmentation, we apply sequential rule mining to each customer segment. Let SG be the set of transaction clusters over l periods for customers belonging to a customer
segment G, as shown in Eq. 5.
SG ={Ci,j| for customer i∈ segment G and
T-l+1≤ j≤ T} (5)
For each customer segment, the sequential rules for the customers’ transaction clusters over l periods can be discovered from the set SG by time-based
association rule mining. A sequential rule Rx is an
association rule with time order constraints, as defined in Eq. 6.
Rx: rx,T-l+1,…, rx,T-1 => rx,T (Supportx, confidencex)
where rx,T-k∈C or φ and rx,T∈C; k=0 to l-1
(6)
The conditional part of the sequential rule is <rx,T-l+1,…, rx,T-1>, and the consequent part is rx,T.
Similarity Computing
In the recommendation phase, the degree of match between a target customer’s buying behavior and a sequential rule is calculated by the similarity measure. The correspondent degree is used to predict the transaction cluster that the target customer may belong to in period T.
Let Rx represent one of the sequential rules for
customer-segment G that the target customer y belongs to, where Rx: rx,T-l+1,…, rx,T-1 => rx,T
(Supportx, Confidencex). If the buying behavior of customer y prior to time T is similar to the conditional part of Rx, then the predicted behavior
cluster for that customer in T is rx,T. Let Ly =
<Cy,T-l+1,…, Cy,T-1> be the buying behavior of the
target customer y before time T. Note that Cy,T is the
set of transaction clusters of customer y in period T.
RC
x= <rx,T-l+1,…, rx,T-1> is the conditional part of Rx.
The degree of match between the buying behavior of customer y and sequential rule Rx is computed by Eq.
7, in which SMxy denotes the similarity measure between Ly and RCx . ⎩ ⎨ ⎧ ∈ = × × = − − − = −
∑
otherwise , 0 if , 1 where , ) ( , , 1 1 , k T y x,T-k x k T y l k x x x k T y x y C r M Confidence Support M SM (7)In the SR method [4], the number of transaction clusters of a customer in each period is limited to 1, i.e., rx,T−k =Cy,T−k ,whereCy,T−k∈C. We have
generalized sequential rule mining to handle cases where a customer may have more than one transaction cluster in a certain period. That is,
C
Cy,T−k⊂ and rx,T−k∈Cy,T−k is used to derive the
degree of match.
The similarity measure of rule Rx is calculated
according to the degree of match between Ly and RCx,
and the support and confidence of Rx. As there are
several sequential rules in a customer segment, several similarity values can be obtained by comparing the target customer’s buying behavior with all the sequential rules for a customer segment. Based on the x
y
SM value, the rule Rx with the highest
similarity measure is selected. Then, the consequent part, rx,T, of Rx is selected as the predicted transaction
cluster of the target customer y in period T. Recommendation
In this step, the top N items in the predicted transaction clusters are recommended to the target customer in period T. From these clusters, we derive the frequency count of each product item, i.e., the number of transactions in the predicted transaction cluster that contain the product item. Then, the items with top N frequency counts are selected for recommendation to the target customer.
3.2 Segmentation-based KNN-CF Method
We use the segmentation-based KNN-CF method to make recommendations based on customer groups. For a target customer u in a specific customer group
G, the transaction records of the customers (including u) in G for period T are used to derive the K-nearest
neighbors of u. The Pearson correlation coefficient is used to measure the similarity between the target customer u and other customers in G. The k most similar (highest ranked) customers are selected as the
k-nearest neighbors of u. Then, the top-N
recommended products are selected according to the records of the k-nearest neighbors of u, as follows. The frequency count of products is calculated by scanning the purchase data of the k-nearest neighbors. The products are then sorted based on the frequency count. The N most frequent products not yet purchased by the target customer u (in period T) are selected as the top-N recommendations.
4. Experiment and Evaluation
In this section, we describe the experiments conducted to evaluate the proposed hybrid method using real-world data. The dataset consists of 4,869 transactions, 2,065 customers, and 201 cosmetic products from a department store W. Transactions from July 2003 to June 2005 are used to identify customers’ purchase behavior over time. The data is divided as follows: 80% for training and 20% for testing. The test set is selected from transactions in period T.
The proposed hybrid method is compared with the SSR, SKCF and SR methods. Recall and precision measures are widely used in recommender systems to evaluate the quality of recommendations [8][15].
Recall is the fraction of the product items of
interest that can be located by a recommendation method, as defined in Eq. 8.
items g interestin of Number items d recommende correctly of Number Recall= (8)
Precision is the fraction of recommended product
items (predicted to be interesting) that are considered interesting, as defined in Eq. 9.
items d recommende of Number items d recommende correctly of Number Precision= (9)
Items of interest to a customer u refer to products in the test set purchased by u. Correctly recommended items are items that match items of interest. The two measures are in conflict because increasing the size of the recommendation set improves the recall at the expense of a decrease in precision [15].
Hence, the F1-metric [19] is used to balance the trade-off between precision and recall. The F1-metric assigns equal weight to both recall and precision and is used in our evaluation, as shown in Eq. 10.
Precsion Recall Precision Recall 2 F1 + × × = (10) 4.1 Experiment Results
We now describe the experiments conducted to evaluate the hybrid method, which combines the SSR method and the SKCF method, as shown in Eq. 3. The weights for SSR and SKCF are set at 0.3 and 0.7, respectively, based on the highest quality recommendation.
The RFM patterns of each cluster are identified by assigning ↑ or ↓ according to whether the average
R(F,M) value of a cluster is less than or greater than the overall average R(F,M). From the cluster’s RFM patterns, we can identify four customer segments, i.e., loyal (R↓F↑M↑), potential (R↑F↑M↑), uncertain (R↓F↓M↓), and valueless (R↑F↓M↓). Figure 2 shows the F1 values of the hybrid method for four customer segments. Overall, the recommendation quality of the hybrid method is better for the loyal customer segment than for other segments. The trend is Loyal>Potential>Uncertain>Valueless. Hybrid Method 0 0.03 0.06 0.09 0.12 0.15 10 20 30 Top-N F1 Loyal Potential Uncertain Valueless
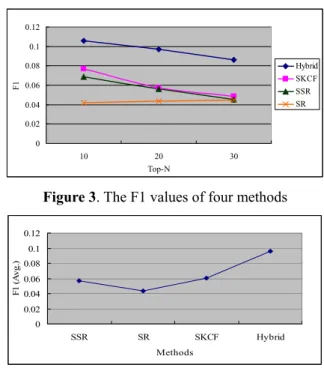
Figure 2. The F1 values of the hybrid method Figure 3 compares the four methods under different Top-N, and Figure 4 compares the methods according to their average F1 values. Clearly, the proposed hybrid method outperforms the other approaches. It considers customers’ purchase sequences as well as the transaction records of a target customer in period T. Thus, by combining the advantages of SSR and SCF, the hybrid method improves the quality of recommendations.
0 0.02 0.04 0.06 0.08 0.1 0.12 10 20 30 Top-N F1 Hybrid SKCF SSR SR
Figure 3. The F1 values of four methods
0 0.02 0.04 0.06 0.08 0.1 0.12 SSR SR SKCF Hybrid Methods F1 (A vg .)
Figure 4. Comparison of the average F1 values of the four methods
5. Conclusions
Traditional CF methods do not consider a customer’s purchase sequences, which identify the customers’ preferences over time. Although the sequential rule method considers the sequence of customers’ purchase behavior over time, it does not make use of the target customer’s purchase data for the current period. To enhance the quality of recommendations, this study proposes a hybrid method that considers customers’ purchase sequences over time and their purchase data for the current period. The proposed hybrid method combines the advantages of the SSR and SKCF methods. Experiments were conducted to compare and evaluate the performance of the SSR, SKCF, SR, and hybrid methods. The hybrid method achieves the best recommendation quality out of the four methods. Acknowledgement
This research was supported in part by the National Science Council of the Taiwan under the grant NSC 95-2221-E-009-233.
References
[1] Agrawal, R., and Srikant, R., “Fast algorithms for mining association rules”, Proceedings of the 20th
international conference on very large data bases,
1994, pp. 478-499.
[2] Bult, J.R. and Wansbeek, T.J., “Optimal selection for direct mail”, Marketing Science, 14(4), 1995, pp. 378–394.
[3] Chen, M.S., Han, J., Yu, P.S., “Data mining: an overview from a database perspective”, IEEE
Transactions on Knowledge and Data Engineering,
8(6), 1996, pp.866-883.
[4] Cho, Y.B., Cho, Y.H. and Kim, S.H., “Mining changes in customer buying nehavior for collaborative recommendations”, Expert Systems
with Application 28, 2005, pp.359-369.
[5] Flexer, A., “On the use of Self-Organizing Maps for clustering and visualization”, In Proceeding of the
3rd International European Conference PKDD 99, Prague, and Czech Republic, 1999.
[6] Irvin, S., “Using lifetime value analysis for selecting new customers”, Credit World, 82(3), 1994, pp.37-40.
[7] Konstan, J. A., Miller, B. N.,Maltz, D., Herlocker, J. L.,Gordon, L. R., and Riedl, J., “GroupLens: Applying Collaborative Filtering to Usenet News”,
Communications of the ACM, 40(3), 1997, pp.
77–87.
[8] Lin, C., Alvarez, S., and Ruiz, C., “Collaborative recommendation via adaptive association rule mining”, Proceedings of the International Workshop
on Web Mining for E-Commerce (WEBKDD2000),
2000.
[9] Liu, D. R., & Shih, Y. Y., “Integrating AHP and data mining for product recommendation based on customer lifetime value”, Information and
Management, 42(3), 2005, pp.387-400.
[10] MacQueen, J. B., “Some Methods for classification and Analysis of Multivariate Observations”,
Proceedings of 5-th Berkeley Symposium on Mathematical Statistics and Probability, Berkeley,
University of California Press, 1, 1967, pp. 281-297. [11] Mooney, R., and Roy L., “Content-Based Book
Recommending Using Learning for Text Categorization”, Proceedings of the Fifth ACM
Conference on Digital Libraries, 2000, pp. 195-204.
[12] Punj, G.N., and Stewart, D.W., “Cluster analysis in marketing research: review and suggestions for application”, Journal of Marketing Research 20, 1983, pp.134-148.
[13] Rucker, J., and Polanco, M.J., “Personalized navigation for the Web”, Communications of the
ACM, 40(3), 1997, pp. 73-75.
[14] Resnick, P., Iacovou, N., Suchak, M., Bergstrom, P., Riedl, J., “GroupLens: an open architecture for collaborative filtering of Netnews”, Proceedings of
the CSCW conference, 1994, pp. 175-186.
[15] Sarwar, B., Karypis, G., Konstan, J., Riedl, J., “Analysis of recommendation algorithms for e-commerce”, Proceedings of the ACM conference
(Electronic Commerce), 2000, pp. 158-167.
[16] Schafer, J.B., Konstan, J.A., Riedl, J., “E-commerce recommendation applications”, Journal of Data Mining and Knowledge Discovery 5(1/2), 2001, pp.115-152.
[17] Shardanand, U., and Maes, P., “Social information filtering: algorithms for automating ‘world of mouth’”, Proceedings of the ACM (CHI'95), 1995, pp. 210-217.
[18] Srikant, R. and Agrawal, R., “Mining generalized association rules”, Proceedings of the 21th
international conference on very large data bases,
1995, pp.407-419.
[19] Van Rijsbergen, C. J., Information retrieval, 2nd ed., London: Butterworths, 1979.
[20] Vesanto, J., Alhoniemi, E., “Clustering of self-organizing map”, IEEE Transactions on Neural