Owing to the relatively low energy consumption rate re-Filtration followed by expression characteristics of cationic poly- quired by compression compared with thermal dewatering mer conditioned clay slurries are reported for the first time in this
methods, it is widely employed in industries to separate work. As the polymer dosage increases, the resistance to filtration
liquid from cake by mechanical pressure ( 5 ) . A major appli-greatly decreases until a specific dose has been reached, where the
cation relates to water and wastewater sludge treatments. zeta potential is close to zero. And further increase in polymer
Yeh ( 6 ) and Tong ( 7 ) have provided a brief literature re-dose conversely raises the resistance. The expression data are
inter-view. Heij et al. ( 8 ) report the application of expression to preted by the Terzaghi – Voigt combined model, from which the
sludges. model parameters are evaluated. The polymer conditioning has
Over the past three decades, most of the research on con-only a mild effect on the primary consolidation process but has,
however, a considerable influence on secondary consolidation stant-pressure expression has been accomplished by the Jap-characteristics. When zeta potential changes from negative to posi- anese investigators, Shirato and Murase ( 9 – 14 ) , and by tive, both the easiness of creeping of constituent particles within Tiller of Houston University ( 5 ) . Investigations of constant the sludge cake and the fraction of moisture removal by the sec- pressure provide basic understanding of the detailed mecha-ondary consolidation attain a maximum. The optimal polymer
nisms involved and of the implications for sludge character-dose criterion considering the filtration and expression stages
sepa-istics. rately, or in combination, is q 1997 Academic Press
In water and wastewater sludge dewatering operations, Key Words: expression; filtration; polymer conditioning; creep
filtration followed by an expression process is frequently effect; zeta potential.
employed. Examples are the belt filter press or the screw press, and in these processes polymer conditioning almost always occurs. However, a comprehensive study of the fil-INTRODUCTION
tration followed by expression characteristics of polymer conditioned slurry is still lacking in the literature. This paper Polymer conditioning has been employed for quite some presents an experimental study of the effects of polymer time to pretreat slurry to increase its settleability and the dose on the filtration followed by expression operations of corresponding filterability. Charge neutralization and inter- cationic polymer conditioned clay slurries. The role of parti-particle bridging are the two major mechanisms for floccu- cle surface charge on resistance to filtration, and the parame-lating constituent particles into larger flocs ( 1 ) . When the ters in expression stage are examined. We also address the former dominates, a strong correlation exists between the so-called ‘‘optimal polymer dose’’ for these clay slurries. polymer dose at which the particle surface charge neutralizes
and the maximum settling velocity and / or minimum resis- EXPERIMENTAL
tance to filtration ( 2 ) . A rational criterion for the optimal
polymer dose is thereby setting at such a specific polymer The test material was clay powders. The particle size dis-dose where charge neutralized, which can be easily deter- tribution, determined by a Sedigraph 5100C ( Micromeri-mined by the zeta potential measurement or the streaming tics ) , was as a monodispersed distribution with a mean diam-current device ( 3 ) . However, the requirement of floc charac- eter of approximately 4.6 mm. The true solid density was teristics for the two separation processes is not identical ( 4 ) . measured by a Accupyc Pycometer 1330 ( Micrometritics ) ,
giving 2584 kg /m3
with a relative deviation of less than 0.5%. The slurry was prepared by mixing clay particles and
1
To whom correspondence should be addressed. E-mail: djlee@ccms.
ntu.edu.tw. 1001
FIG. 1. Experimental setup.
of NaClO4 provides a sufficient ionic strength to prevent RESULTS AND DISCUSSION
interference from other ions that the clay particle surfaces
might release.) The pH values are fixed at three levels: 3, General 7, and 10.
Cationic polyelectrolyte, designated as polymer T-3052, Typical experimental data for compression are summa-rized in Fig. 2. The complete test illustrated in Fig. 2 includes was obtained from Kai-Guan, Inc., Taiwan. This polymer is
a polyacrylamide with an average molecular weight of 107
the filtration and expression stages ( 5 ) . The porosity term used as the ordinate represents the average value of the slurry and a charge density of 20%. The mixing unit was a baffled
mixing chamber with a stirrer. The weighed powder was and cake in the filtration stage, and the average value for the consolidated cake in the expression stage that follows. first suspended in distilled water. Polymer solution was then
gradually poured into the mixing vessel, stirred at 200 rpm In all the tests involving the three pH values, as the polymer dose increased, the cake porosity versus time curve clearly for 5 min, followed by 50 rpm for 20 min. Following mixing
and prior to settling, a small quantity of the clay-polymer shifted to the left till the polymer dose reached a critical amount. Above the critical dosage for pH 3 and 7, the curves aggregates in the vessel was carefully transferred to a fresh
electrolyte of the same pH and electrolyte concentration as return to the right. Such a reversal phenomenon, however, has not been observed for pH 10. Notably, the critical poly-the original electrolyte. The zeta potentials of poly-the
clay-poly-mer aggregates were then measured by a zeta meter ( Zeter- mer dose determined from Fig. 2 depends strongly on the pH of the slurries: a lower critical dose corresponds to a Meter System 3.0, Zeter-Meter Inc., USA ) .
A constant head piston press ( Triton Electronics Ltd., type lower pH. The critical dose is approximately 500 ppm and 600 ppm for pH 3 and 7 tests, respectively.
147 ) was employed in all the tests. Figure 1 is a schematical
drawing of the experimental setup. The sludge was placed The filtration and the expression stages in Fig. 2 are sepa-rately discussed in the later sections. Shirato et al. ( 9 ) pro-in a stapro-inless steel cylpro-inder, 7.62 cm pro-in diameter and 20 cm
high. A hydraulic pressure of 1000 psi was exerted on the posed a simple, graphical method for locating the transition point between these two stages. Yeh ( 6 ) used an alternative piston to force out the moisture. The time evolution of the
filtrate weight was then automatically recorded by an elec- method: a certain amount of gas retained in the expression chamber was quickly expelled once the piston touched the tronic balance connected to a personal computer. Given these
data and the true solid density, the time evolution of cake cake, thereby signaling the transition. We here adopt Shir-ato’s method, since the transition point of the clay slurries porosity was subsequently obtained.
Under each experimental condition, three independent can easily be determined graphically. Typical examples are given in Fig. 3. In Fig. 2, the obtained transition points are tests were conducted to check the reproducibility. Owing to
the rather high solid content ( 20% w / w ) and the wide range also indicated as arrows, separating each experimental curve into two regions labeled F and E .
of polymer dosage ( 0 – 1000 ppm, based on the weight of
slurry ) under investigation, the mixing becomes an essential The zeta potential data are summarized in Fig. 4. At pH 3 and 7, the zeta potentials increase from negative to positive step in determining the subsequent sludge dewatering
char-acteristics. Extreme care should be exercised to ensure that as the polymer dose increases. In both cases the specific dose producing a surface neutralization situation are identified in reproducible experimental results are obtained.
FIG. 2. Time evolution of cake porosity. 1000 psi. Clay slurry, 20% w / w. 1001M. Arrows indicate the transition points. Symbol F denotes the
filtration stage; symbol E , the expression stage. ( a ) pH 3, ( b ) pH 7, ( c ) pH 10.
Fig. 4, and the results read, respectively, 480 and 520 ppm at high polymer dose exhibits greater uncertainty since the resulting flocs settle quickly in the measurement cell. at pH 3 and 7. It is not surprising that these dosages are
close to the critical doses found in Figs. 2a and 2b. We refer The coincidence of the zeta potential measurements and the efficiency of the dewatering process reflects the im-to these values hereafter in this paper as the critical polymer
dose. ( Note: the zeta potentials close to the charge neutral- portant role of surface charge characteristics on particle packing and the associated dynamic response of the cake ization region are rather difficult to determine accurately,
since there are particles with positive or negative charges structure under loading. The zeta potentials of aggregates are strongly affected by pH. The zeta potential of polymer-present in the slurry. The polymer doses thus determined
reflect an element of uncertainty.) For pH 10, the dewatering clay aggregate at higher pH is lower than at lower pH. Actu-ally, the pH value of solution affects the surfaces both of efficiency did not markedly improve once the polymer
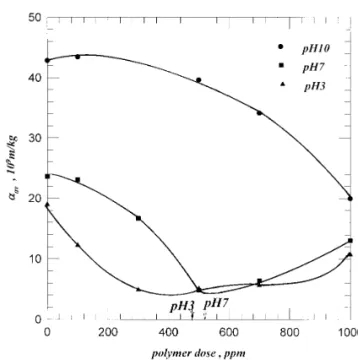
FIG. 3. Transition between filtration and expression stages. Arrows FIG. 5. aa£ versus polymer dose amount. Arrows indicate the
corre-sponding critical polymer doses. indicate the transition points. pH 7.
clay or clay-polymer aggregate causes a less charge than at
gates constituting the sludge or the filtration cake are termed higher pH conditions. As to polymer, it is also considered
as aggregates, while the clay particles constituting the aggre-that the proton concentration affects its charge density
gates are termed as the particles. through the hydrolysis reaction. Hence, the acidic condition
favors clay-polymer aggregation due to decreased repulsion
Filtration Stage
between clay particles and to increased repulsion between
polymer segments. Considering the filtration stage data ( stage F in Fig. 2 ) ,
In the following sections, based on the transition points the corresponding average specific resistance are obtained identified in Fig. 3, it will be more informative to discuss according to procedures proposed by Leu ( 15 ) . The average the filtration and expression stages separately. To avoid con- specific resistances under 1000 psi constant-pressure filtra-fusion, in the following discussion the clay-polymer aggre- tion are shown in Fig. 5.
At pH 3 and 7, the lowest average specific resistance of cake occurs at a dose close to the critical polymer dose identified by zeta potential measurements. This result corre-sponds to the well-known fact that constituent aggregates with neutralized charges can form a loosely structured cake with a loose structure, thereby permitting a high filtration rate. A low specific resistance is advantageous from dewater-ing considerations.
The separation points shown in Fig. 3 can be employed in the manner described later to calculate the residual mois-ture ratio, the moismois-ture not removable during the filtration stage ( moisture remaining in the cake at the end of filtration divided by the total moisture content ) . First, read out the initial porosity of the sludge ( e0) and then at separation point
( e ) . Calculate the corresponding void ratio e0 and e . The
fraction of liquid remaining in the cake is e / e0. The results
are shown in Fig. 6. A maximum is noted at the correspond-ing critical polymer dose. This arises naturally owcorrespond-ing to a loose, nearly neutralized cake trapping more moisture during filtration. However, the higher residual moisture in cake after
FIG. 4. Zeta potential versus polymer dose amount. Arrows indicate
Å ( 10B )
H
10expS
0p 2 Ce 4v2 0 ucDJ
/B {10exp (0huc) } . [1] FIG. 6. Fraction of moisture removed in filtration stage versus polymerdose amount. Arrows indicate the corresponding critical polymer doses.
In Eq. [1] , Ucis the consolidation ratio, L the cake thickness,
L1 and Lf, respectively, the initial and final cake thickness,
At pH 10, as the polymer dose increases, the average h the creep factor, demonstrating the easiness of the relative specific resistance decreases ( Fig. 5 ) , while the residual mobility of constituent aggregates, v0the cake volume on
moisture amount increases monotonically ( Fig. 6 ) . Both re- unit area of the filter, Ce the consolidation coefficient ( a sults indicate a looser cake structure associated with a higher measure of the ratio of the spring rigidity of the Terzaghi polymer dose. The optimal polymer dose was, therefore, not model to the consolidated cake average specific resistance ) , achieved, although the conditioned, unfiltered slurry and the and ucthe consolidation time. The first and the second term
filtrate both became very viscous. on the right-hand side of Eq. [1] are attributed to the primary and secondary consolidations, respectively. The parameter
Expression Stage B is defined as E1/ ( E1 /E2) , that is, the ratio of moisture
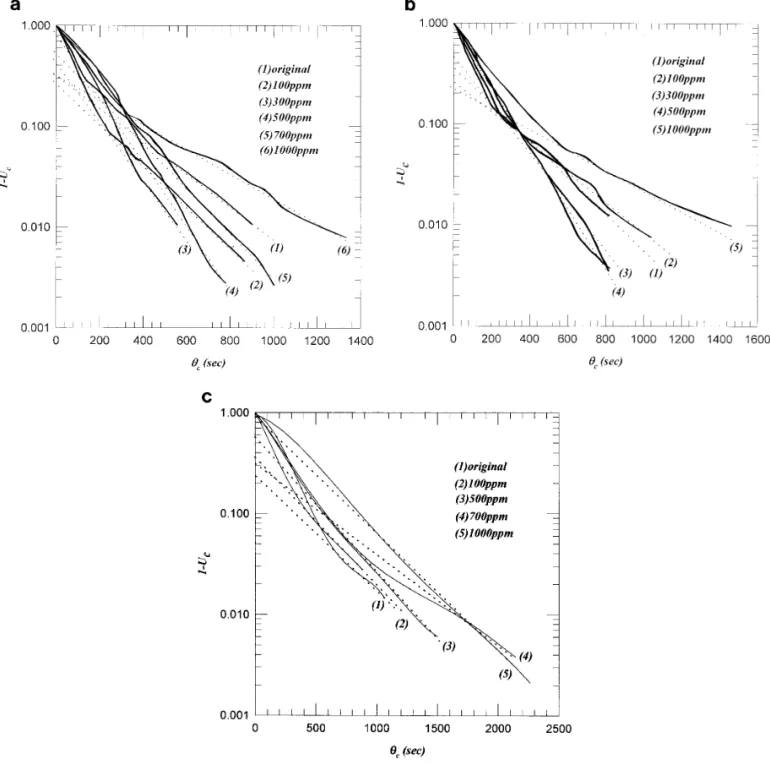
removal by the secondary consolidation to that by the overall The expression stage ( stage E in Fig. 2 ) can be
differenti-consolidation. As uc r `, Eq. [1] reduces to the form
ated from the filtration stage and is redrawn in Fig. 7. The first phase of expression usually exhibits only a weak
depen-Uc Å10B exp (0huc) , [ 2 ]
dence on the amount of polymer dosing. The subsequent expression stage, however, is strongly influenced by the
polymer addition. At pH 3 and 7, as the polymer dose in- from which the parameters B and h can be estimated via a regression analysis of the experimental data ( 11 – 13 ) . creases, the expression curves first shift to the left, and then,
after passing the corresponding critical polymer dose, they As indicated in Fig. 7, for all the sludge tests, a linear ln ( 10Uc)0ucregion follows the initial decreasing in Uc.
return. At pH 10, nevertheless, the curve becomes insensitive
to polymer dosage amount once the concentration exceeds This confirms the validity of employing Eq. [ 2 ] to describe the expression characteristics for these conditioned clay slur-700 ppm. The comparisons between Figs. 7a to 7c indicate
that the expression dewatering efficiency approximately fol- ries. Figures 8 and 9 represent the best fitting B and h. Interestingly, at pH 3 and 7, a maximum is also detected for lows the sequence: pH 3úpH 7ú pH 10.
By employing the Terzaghi – Voigt combined model to both figures that is close to the corresponding critical poly-mer dose. That is, the easiness of the creeping of the constit-relate the cake local void ratio with the local compressive
pressure, Shirato et al. ( 10 ) arrived at a tedious solution to uent aggregates ( or particles ) in the cake, and the fraction of moisture removal by the secondary consolidation, both account for the time evolution of cake thickness under
con-stant-pressure consolidation. The Terzaghi – Voigt combined increase greatly when the aggregate surface charge is around neutral.
model is illustrated in Fig. 8. ( Note: this model is a
phenome-nological model that lacks theoretical basis. The spring ele- At pH 10, since the critical polymer dose was not achieved in experiments, the B value increases in line with an increase ment in the Terzaghi model accounts for the elastic behavior
FIG. 7. 1-Ucversus uc. ( a ) pH 3, ( b ) pH 7, ( c ) pH 10.
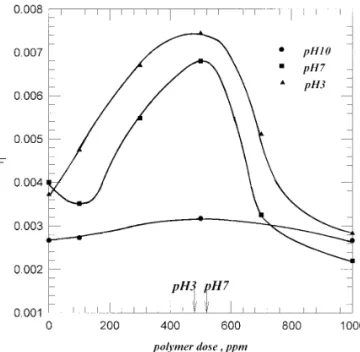
at pH 3 and 7. However, the rate of increase rate in B becomes dewatering rate at pH 10 in Fig. 2c is mainly achieved by reducing filtration resistance. The addition of polymer, actually, faster and approaches unity when the polymer dose exceeds
approximately 700 ppm (Fig. 9). That is, the secondary consol- retards the expression and is unfavorable to sludge expression dewatering.
idation contribution becomes more important (larger B) in the basic condition. Since the dewatering in secondary
consolida-tion is usually slower than that in the primary consolidaconsolida-tion, a Surface Charges and Sludge Dewaterability greater B is not favorable to sludge dewatering. The
corre-sponding parameter h remains almost constant with the addition Experimental results reflect the important role of the ag-gregate surface charges on the sludge dewatering efficiency. of polymer (Fig. 10), reflecting no marked improvement of
aggregates/particles creep. Consequently, as depicted in Fig. As stated in the literature and found in this work, the filtra-tion cake structure with nearly neutral constituent aggregates 7c, the dewatering efficiency of the expression deteriorates as
FIG. 8. Schematics of the Terzaghi – Voigt combined rheological model.
FIG. 10. Parameter h versus polymer dose amount. Arrows indicate the corresponding critical polymer doses.
residual moisture. Meanwhile, the consolidated cake at a critical polymer dose exhibits higher h ( faster particle creep-ing ) and B values ( a greater secondary consolidation
contri-resulting cake at the end of the filtration stage, the resistance bution ) . This effect has not been well documented in the
to global structure collapse during the first phase of expres-literature and, therefore, warrants some discussion.
sion is even stronger. This is especially true at pH 10. One Primary consolidation had been defined as the escape of
possible explanation is that for a nearly neutralized consoli-pore liquid and the collapse of cake structure; and secondary
dated cake, the aggregate sizes are larger and the intraag-consolidation, as the disturbance of the structural bonding
gregate strength greater. With the former, large pores can
of aggregates or the creeping of the constituent particles
exist in the cake, resulting in considerable filtration cake ( 16 ) . The corresponding maximum B value at the critical
volume ( Fig. 6 ) . With the latter, once pressure is exerted on polymer dose for pH 3 and 7 indicates relatively smaller
the cake, there is increased resistance to the global structure properties of moisture being removed at the primary
consoli-collapsing. Further moisture removal is mainly accom-dation stage. That is, although the porosity is greater for the
plished by rearranging the positions of the aggregates within the cake, a process which is attributed to the secondary consolidation stage. We have found from an independent test that the resulting flocs under ultrasonic field are stronger when at critical polymer dose or with raised pH.
The easiness of particle creep is controlled by the forces acting resistively on neighboring particles, including at least an external mechanical force, the drag force exerted by the highly viscous surface water layers, and electrostatic repul-sion forces. We can picture in imagination the fricative pas-sage ( creeping ) of one aggregate over the other with the same sign of charge owing to the electrostatic repulsion force. This phenomenon can explain qualitatively the larger creep coefficient observed near the critical polymer dose for pH 3 and 7, which is favorable to dewatering since a greater expression rate can be obtained. At pH 10, as evidenced by the zeta potential measurements in Fig. 4, the surface charge does not approach closer to zero as polymer dose is higher than 300 ppm. The creeping factor h therefore remains un-changed accordingly. When the surface charge is
neutral-FIG. 9. Parameter B versus polymer dose amount. Arrows indicate the
interaggregate interaction. These results reveal that the pa- experimentally. For slurries conditioned too close to the criti-cal polymer dose at which the zeta potential changes from rameters B and h might be controlled by different factors.
negative to positive, the average specific resistance of the
Optimal Polymer Dose filtration stage reaches a minimum owing to the loose cake
structure formed thereby. However, the corresponding resid-This study demonstrates a need for re-evaluating the
opti-ual moisture content is also the largest. During the expression mal polymer dose criterion by considering the filtration
fol-stage, the polymer dose has a substantial influence on the lowed by expression process as a whole. As suggested by
secondary consolidation. According to the combined Ter-Moudgil and Shah ( 4 ) , an optimal polymer dose actually
zaghi-Voigt rheological model, the slurries containing a depends on what the specific requirement for the sludge
close to a critical polymer dose will exhibit the highest parti-treatment is. For example, if the clarifier and / or the filter
cle creeping mobility and the largest secondary consolidation area is the major concern, the critical polymer dose identified
contribution. However, the creep is not been enhanced by a zeta potential measurement may be the ideal optimal
greatly in the basic condition, which cause expression perfor-polymer dose, since it provides the most satisfactory
settle-mance to deteriorate when polymer is added. The optimal ability and filterability. However, if the reduction of filtration
polymer dose with regard to the filtration / expression process cake volume is the focus of interest, the critical polymer
is not necessarily definitely at critical polymer dose even if dose becomes the worst choice, since it leaves the largest
the particle surface charge is the dominating mechanism. residual moisture content in the filtration cake. The trend is
also observed at pH 10 although the critical polymer dose
ACKNOWLEDGMENT was not achieved within the experimental range.
Considering the expression stage separately, if it is rela- This work is supported by National Science Council, Republic of China. tively slow ( which is especially true for biological sludges
dewatering ) and if the required residual moisture content is REFERENCES
within the range that the initial phase of the expression stage
1. Hunter, R. J., ‘‘Foundations of Colloid Science,’’ Vol. I. Clarendon can achieve, no specific polymer dose is strongly
recom-Press, London, 1989. mended, since the dependence on polymer amount is weak
2. Hemme, A., and Ay, P., Filtr. Sep. 31, 647 – 651 ( 1994 ) . ( Fig. 7 ) . If a still dryer cake is a prerequisite for final sludge 3. Dentel, S. K., Crit. Rev. Envir. Control 21, 41 – 135 ( 1991 ) . disposal, a subsequent expression stage is required, at which 4. Moudgil, B. M., and Shah, B. D., in ‘‘Advances in Solid-liquid Separa-point secondary consolidation begins. The critical polymer tion’’ ( H. S. Muralidhara, Ed.) , p. 191. Battelle Press, Columbus, Ohio,
1986. dose is still the best choice for the slurry at pH 3 or 7 at
5. Tiller, F. M., and Yeh, C. S., AIChE J. 33, 1241 – 1256 ( 1987 ) . our study, since the effect of an increase in h is not been
6. Yeh, C. S., Cake Deliquoring and Radial Filtration, Doctoral Disserta-completely compensated by the increase in B . However, at tion, University of Houston, Houston, Texas, 1985.
pH 10, owing to the marked increase in B and a near constant 7. Tong, W. C., Effects of pH Value and Chemical Conditioning on Ex-h, the expression performance deteriorates with the addition pression of Sludges, Master Thesis, National Taiwan University, Teipei,
Taiwan, 1994. of polymer. No polymer should be added thereafter.
8. Heij, E. J. La, Kerkhof, P. J. A. M., Herwijn, A. J. M., and Coumans, The combined filtration and expression process may result
W. J., Water Res. 30, 697 – 703 ( 1996 ) .
in a more complicated situation. The optimal polymer dose 9. Shirato, M., Murase, T., Kato, H., and Fukaya, S., Filtr. Sep. 7, 277 – would depend on what design parameter is the critical one. 282 ( 1970 ) .
For example, in some of the cases discussed previously, no 10. Shirato, M., Murase, T., Tokunaga, A., and Yamada, O., J. Chem. Engng. Japan 7, 229 – 231 ( 1974 ) .
specific polymer dosing amount is recommended. This is
11. Shirato, M., Murase, T., Hayashi, N., and Fukushima, T., J. Chem. somewhat surprising since the charge neutralization
mecha-Engng. Japan 10, 154 – 159 ( 1977 ) .
nism still plays a major role in present-day slurry system. 12. Shirato, M., Murase, T., Atsumi, K., Nagami, T., and Suzuki, H., J. The experimental results in this work, therefore, support the Chem. Engng. Japan 11, 334 – 336 ( 1978 ) .
arguments in Moudgil and Shah ( 4 ) that different aggregate 13. Shirato, M., Murase, T., Atsumi, K., Aragaki, T., and Noguchi, T., J. Chem. Engng. Japan 12, 51 – 55 ( 1979 ) .
characteristics are required for various intended applications.
14. Shirato, M., Murase, T., and Atsumi, K., J. Chem. Engng. Japan 13, 397 – 401 ( 1980 ) .
CONCLUSIONS
15. Leu, W. F., Cake Filtration, Ph.D. Dissertation, University of Houston, Houston, Texas, 1981.
The filtration followed by expression characteristics of 16. Craig, R. F., ‘‘Soil Mechanics,’’ 5th ed. Chapman & Hall Pub., London, 1992.