行政院國家科學委員會專題研究計畫 成果報告
市區道路之短期旅行時間預測模式
研究成果報告(精簡版)
計 畫 類 別 : 個別型 計 畫 編 號 : NSC 98-2221-E-009-108- 執 行 期 間 : 98 年 08 月 01 日至 99 年 07 月 31 日 執 行 單 位 : 國立交通大學運輸科技與管理學系(所) 計 畫 主 持 人 : 黃家耀 計畫參與人員: 此計畫無其他參與人員 報 告 附 件 : 出席國際會議研究心得報告及發表論文 處 理 方 式 : 本計畫可公開查詢中 華 民 國 99 年 10 月 26 日
1
市區道路之短期交通預測模式
摘要 短期交通預測模式是智慧型運輸系統(ITS)中非常重要的一環。如先進旅行者資訊系統 (ATIS) 和先進交通管理系統(ATMS) 的應用中,都需要為當下及未來的交通狀態進行預 測。本研究的主要目的為預測市區道路之交通量及旅行時間,使用一般已有的偵測器資 料,建立出每天之交通狀態資料庫,效估出交通狀態,車流量和旅行時間之關系。以下 比較季節性ARIMA 以及 類神經 (NN) 演算法在市區交通量預測的適用性,並以台北市 的兩條主要道路為資料來源和分析對象。SHORT-TERM TRAFFIC FORECASTING FOR URBAN ROADS
ABSTRACT
The interests and applications of short-term traffic forecasting have been growing in the recent years. Many of the applications in Advance Traveler Information System (ATIS) and Advance Traffic Management Systems (ATMS) require an estimation and forecasting of the traffic conditions of the network. With a historical database of past traffic data from various types of vehicle detectors installed in the roads, real-time traffic information is collected which will be used to estimate the current traffic conditions and predict the condition in near future. Whereas most of the literature focused on the traffic flow prediction on the freeways, modeling traffic flow in urban arterials is more challenging as there are disturbances such as motorcycles and traffic signals in urban area. In this study, the traffic flow forecasting for urban arterials is investigated. Seasonal ARIMA and neural network are considered as the algorithms, and two arterials in the Taipei city, Taiwan, are studied in our numerical example.
1. INTRODUCTION
The interests and applications of Intelligent Transportation Systems (ITS) have been growing in the recent years with the development of technologies in telematics. Two of the most important areas of ITS are Advanced Traveler Information Systems (ATIS) and Advance Traffic Management Systems (ATMS). ATIS aims at providing useful travel information to road users, providing travelers accurate and real-time information such as travel time and delay, which can help road users make better travel decisions. ATMS controls the traffic in the network in real time not only alleviate traffic congestion but also improve the use of system’s capacity and thus improve overall network efficiency. These applications require the technique of traffic forecasting in the near future. Therefore, the objective of this study is to find a flow prediction model which forecasts the short-term traffic flows based on the traffic data measurement from the past.
Short-term traffic forecasting necessitates the collection of historical time series data. Time series data are a set of observations in sequence of time they occur; in other words, they are
2
ordinal observation set that observed in accordance of time of a dynamic system. Such data measuring the traffic stream characteristics such as traffic flow, speed and lane occupancy are recorded by various types of vehicle detectors and are widely available on freeway and arterials for the operation and incident detection purposes. With a historical database of past traffic data, collected real-time traffic information can be used to estimate the current traffic conditions and predict the conditions in near future. Dia (2001) stated that there are basically two distinct categories of predictive traffic information: strategic and short-term. The difference between strategic and short-term traffic information is the length of the forecasting horizon. Traditional strategic predictive models usually utilize a large amount of data and predict over a period of month or year which is needed for making decisions on transportation planning. On the other hand, short-term predictive models often forecast traffic conditions within a day or an hour that captures the dynamics of traffic, therefore, short-term forecasting models are more suitable for traffic management and information systems.
A wide variety of studies have been done concerning the short-term forecasting during the past decades. Vlahogianni et al. (2004) gave a comprehensive overview on the topic, and they concluded that the modeling methodologies and outputs could be quite different with the scope of each study. In general, the widely used predict models can be classified into two techniques: parametric and non-parametric modeling. Parametric techniques assume a form of probability distribution with parameters, such as smoothing (Smith and Demetsky, 1997), ARIMA (Ghosh et al., 2005), Bayesian SARIMA(Ghosh et al., 2007) and Kalman filtering (Stathopoulos and Karlaftis, 2003; Whittaker et al., 1997). Non-parametric techniques include non-parametric regression (Smith et al., 2002) and neural networks (Dougherty and Cobbett, 1997, Ledoux, 1997, Yin et al., 2002).
Ghosh et al. (2005) used three different time series models to forecast traffic flow in Dublin, and they concluded that seasonal ARIMA outperformed random model and Holt-Winters’ exponential smoothing technique. Smith et al. (2002) compared seasonal ARIMA model and non-parametric regression coupled with heuristic forecast method for traffic volume forecasting and found that the later approach may not produce better result than seasonal ARIMA, with the argument that the traffic data is characteristically stochastic rather than chaotic. Ledoux (1997) proposed a cooperation based neural networks model and demonstrated by simulated data that neural networks can be used to predict future traffic flow accurately. Yin et al. (2002) developed a fuzzy-neural model to predict the traffic flows in an urban area.
On the implementation, whereas most of the literature focused on the traffic flow prediction on the freeways, modeling traffic flow in urban arterials is more challenging as there are disturbances such as motorcycles and traffic signals in urban area. As the two problems are fundamentally different, an accurate estimation and prediction should involve the theory of the traffic flow along the arterials. In this study, the traffic flow forecasting for urban arterials is investigated. Seasonal ARIMA and neural network are considered as our algorithms to be investigated in this initial study. Two arterials in the Taipei city, Taiwan, were studied in our numerical examples.
2. THEORETICAL BACKGROUND
3
only because of their parametric/non-parametric natures, but also their inherent data structure and dependence to the past data. Specifically, seasonal ARIMA model is a time series function of past information, and it only requires the information in the past to forecast future conditions of the same detector location. On the other hand, with the neural network model, the traffic data of a location can be expressed a function of data from other locations (e.g. upstream detectors). Therefore, seasonal ARIMA is a temporal model whereas neural network model is a spatial one.
2.1 Seasonal ARIMA Model
The ARIMA model, also known as Box-Jenkins method, composed of three essential elements: AR stands for autoregressive part; I stands for differencing, a technique that transfers time series data to a stationary form; and MA stands for moving average part. A seasonal ARIMA model is the model which accounts for the seasonal variations, such as months or seasons in a year, in which the pattern of the time series repeats itself in each cycle by the seasonal effect. The construction of the model is described as follows.
Assuming a time series
(
y tt, =1,..,T)
, the first-differenced transformed values of the time series, z , are defined as. t
1 − − = t t t y y z (1)
where y1, y2, …, yt are the original time series values and z1, z2, …, zt are the stationary time
series values. An autoregressive process of order p can be expressed as follow,
t p t p t t t z z z z =δ +φ1 −1+φ2 −2 +...+φ − +ε (2)
where δ is a constant mean that time series values fluctuate, φ1,φ2,φ3,…,φ are the p coefficients of the autoregressive process of order p, εt is the random error components in the time series. A moving average model of order q is defined by the equation,
q t q t t t t z =μ+ε −θ1ε −1−θ2ε −2 −...−θ ε − (3)
where θ1,θ2,θ3,…,θ are the coefficients of the moving average process of order q. q
Combining the above three elements and making use of the backshift operatorB , which k shifts the subscript of a time series observation or error term backward in time by k periods, we then consider the mixed autoregressive moving average process of order (p, d, q), which is, t q t d p B B y θ B ε φ ( )(1− ) = ( ) (4) where ( ) (1 1 2 2 ... ) p pB B B B α α α φ = − − − − , ( ) (1 1 2 2 ... ) q qB B B B β β β θ = − − − − , and B is
the backshift operator.
If the time series has seasonal variation, a simple ARIMA model no longer fits, and a seasonal ARIMA is required. A general multiplicative seasonal model of order (p, d, q)(P, D, Q)L which
is analogous to the mixed autoregressive moving average process of order (p, d, q) can be expressed as follow, t L Q q t D L d L P p B φ B B B y δ θ B θ B ε φ ( ) ( )(1− ) (1− ) = + ( ) ( ) (5)
4
denotes the seasonality.
The purpose of identifying a seasonal ARIMA model is to determine the values of p, d, q and P, D, Q, while the cycle length L is usually given explicitly. In our study, we utilized the statistical software Minitab15 (2009) to compute the autocorrelation function and partial autocorrelation function so as to identify these values.
2.2 Artificial Neural Network (ANN)
Abundant applications of Artificial Neural Network (ANN) can be found in the literature. To briefly describe the background, ANN is an information processing system that imitate neural network. It can be used for problems which are non-linear, with high dimensions, or lack of a clear statement of mathematic formulation. A neural network consists of a set of processing units, also known as neurons. These units can receive inputs from other neurons and compute outputs using transfer function. Neurons are connected to each other by weighted connections, thus the information can be transmit based on the value of weight.
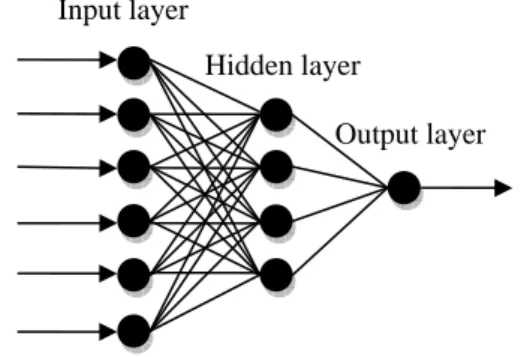
Generally any topological arrangement of neurons could be used. However, a Multilayer Perceptron (MLP) with hidden layer is in common use. In order to simplify the problems of analysis it is usually arranged in layers, with every neurons in adjacent layers connected to each other. This network is a typical feedforward network (see Figure 1).
Figure 1 A typical feedforward network
As above mentioned that there are some relationship between the inputs of neurons and their outputs, so we can assume that the output yj of neuron j is a function of its inputs x0, x1, …, xn,
shown in equations as follow. ) ( j i i ij j f W x y =
∑
−θ (6)where f is non-linear transfer function, Wij is the weight value representing the strength
between neuron i and neuron j, andθjis the bias, only if input multiply weight value is greater
than bias can be transfer to other neurons.
The operating process of neural network composes of two stages, training and recalling. A training procedure that connection weights be updated over time, causing the neural network to adapt and learn is needed. A rule that define how and when the connection weights are updated is a learning rule. The learning process of feedforward network in our research is a supervised learning network. In supervised learning, output is computed after an example of input presented to one side of feedforward network. To move the output toward the desired
Output layer Input layer
5
output, the weight values are updated according to this output. If the training is successful, after presenting a large number of examples, we can image that the global error will decrease, since the network converge to a steady state. Processes that recall algorithm, determining the outputs by input data are recalling procedures. The recalling process of a feedforward network is actually a classifying or predicting process, when we import an example, we want the network to tell us the most possible result.
3. NUMERICAL EXAMPLES 3.1 Data set
To compare the traffic conditions and the applicability of the models on urban overpasses and arterial roads, traffic data, including traffic volume, speed and lane occupancy, were collected every 5 minutes for detectors on JianGuo Overpass and Minsheng W. Road, Taipei city, Taiwan. Due to the strong variability of the traffic flow within a short time, the data are aggregated into 15 minute intervals for better forecasting accuracy, and therefore there are 96 observations in each day in the analysis.
A data set of four weeks were recorded from 29th June 2009 to 24th July 2009. The data of the first three weeks were used for calibrating the model, and the data of last week were used for validation purpose. We only consider data from Tuesday to Thursday in the analysis, as these days are having similar daily traffic pattern. Monday, Friday and weekends are ignored here to avoid the large deviations compared the mid-week traffic conditions.
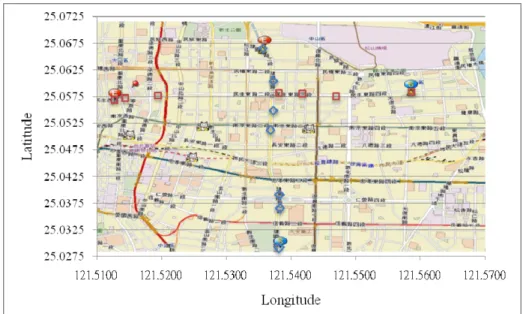
The data of twelve days, with a total of 1152 observations, for each detector were analyzed here. There were 7 vehicle detectors from south to north along the JianGuo Overpass, and 7 vehicle detectors from east to west along Minsheng W. Road, and the locations of the detectors are shown in Figure 2. Blue diamond shape represents the detectors along the JianGuo Overpass and red square shape stands for detectors along Minsheng W. Road.
Figure 2 Locations of the detectors 3.2 Seasonal ARIMA model
6
To fit the seasonal ARIMA model, we consider the traffic data from the downstream detectors on each road, i.e. VPLKP40 for JianGuo Overpass and VMTG520 for Minsheng W. Road,. We used software Minitab 15 to calculate the seasonal ARIMA model. The time series plot of the volume reveals that the data has the seasonality every 96 observations, i.e. data in one day. To transfer the time series data into stationary series, some form of (p, 0, q)(P, 1, Q)96 of the
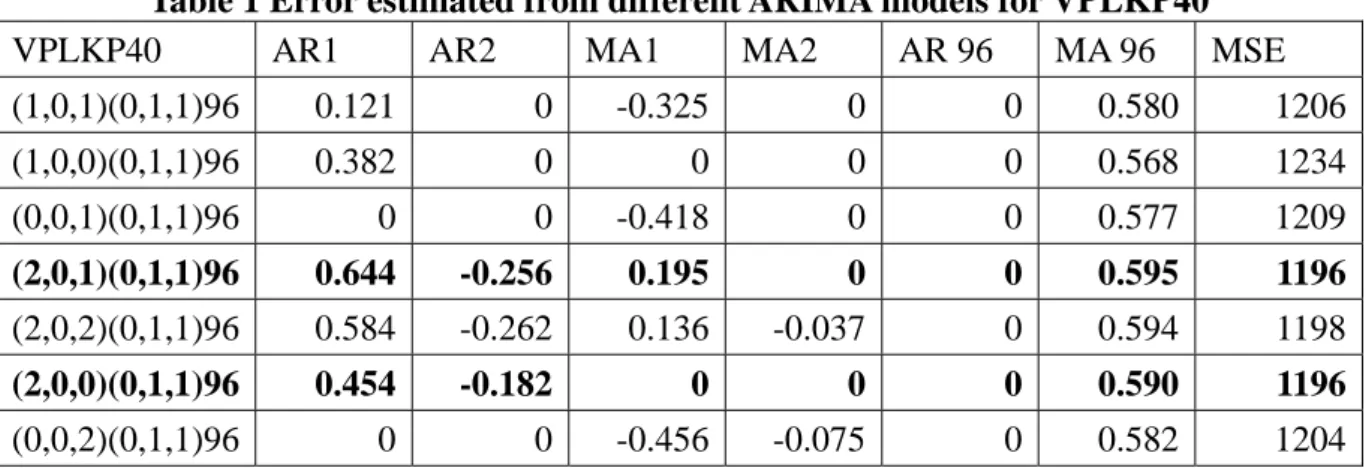
seasonal ARIMA model will fit for the traffic data. The results of the estimation with several reasonable combinations of parameters (p, q, P and Q) for the seasonal ARIMA model are shown in Table 1 and 2. Autocorrelation and partial correlation functions indicated that the process must be AR1 or AR2. Besides, MA1 or MA2 also seemed to be a possible seasonal component.
For the detector VPLKP40, we found that the modeling parameters (2,0,1)(0,1,1)96 and
(2,0,0)(0,1,1)96 best fit the traffic conditions on JianGuo Overpass with the smallest MSE
(mean squared error) values of 1196, as shown in Table 1.
Table 1 Error estimated from different ARIMA models for VPLKP40
VPLKP40 AR1 AR2 MA1 MA2 AR 96 MA 96 MSE
(1,0,1)(0,1,1)96 0.121 0 -0.325 0 0 0.580 1206 (1,0,0)(0,1,1)96 0.382 0 0 0 0 0.568 1234 (0,0,1)(0,1,1)96 0 0 -0.418 0 0 0.577 1209 (2,0,1)(0,1,1)96 0.644 -0.256 0.195 0 0 0.595 1196 (2,0,2)(0,1,1)96 0.584 -0.262 0.136 -0.037 0 0.594 1198 (2,0,0)(0,1,1)96 0.454 -0.182 0 0 0 0.590 1196 (0,0,2)(0,1,1)96 0 0 -0.456 -0.075 0 0.582 1204
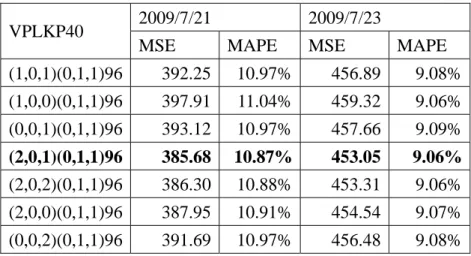
The volume data from 21st July and 23rd July 2009 are then used for the validation purpose. With the above model parameters, we forecasted 96 future observations with (2,0,1)(0,1,1)96
and compared them with observations of the 21st and 23rd, as shown in Figure 3(a) and Figure 3(b), respectively. We can see that the model fits the observations quite well during off-peak when the flows are low in values and the observations were not fluctuate. But the model may not capture the extreme peak variations when it comes to rapid fluctuations. The corresponding error by MSE (mean squared error) and MAPE (mean absolute percentage error) for VPLKP40 are shown in Table 2.
(a) 7/21 observations (b) 7/23 observations Figure 3 Comparison of forecast volume and the observations for VPLKP40
7
Table 2 Error estimated for forecast volume for VPLKP40 2009/7/21 2009/7/23 VPLKP40
MSE MAPE MSE MAPE
(1,0,1)(0,1,1)96 392.25 10.97% 456.89 9.08% (1,0,0)(0,1,1)96 397.91 11.04% 459.32 9.06% (0,0,1)(0,1,1)96 393.12 10.97% 457.66 9.09% (2,0,1)(0,1,1)96 385.68 10.87% 453.05 9.06% (2,0,2)(0,1,1)96 386.30 10.88% 453.31 9.06% (2,0,0)(0,1,1)96 387.95 10.91% 454.54 9.07% (0,0,2)(0,1,1)96 391.69 10.97% 456.48 9.08%
As compared to the application to freeway in the above case, we apply the modeling methodology on the data from the Minsheng W. Road, which is an urban arterial. Table 3 shows some of the different possible outcomes of the seasonal ARIMA and the error estimated for the model for VMTG520. From the error estimated we can find that (2,0,1)(0,1,1)96 alsobest fit the traffic conditions on Minsheng W. Road. The MSE for the
model was 775, lower than the one JianGuo Overpass had.
Table 3 Error estimated from different ARIMA models for VMTG520
VMTG520 AR1 AR2 MA1 MA2 AR 96 MA 96 MSE
(1,0,1)(0,1,1)96 0.582 0 0.348 0 0 0.533 821 (1,0,0)(0,1,1)96 0.255 0 0 0 0 0.543 830 (0,0,1)(0,1,1)96 0 0 -0.190 0 0 0.539 845 (2,0,1)(0,1,1)96 -0.620 0.343 -0.905 0 0 0.543 775 (2,0,2)(0,1,1)96 -0.534 0.428 -0.807 0.093 0 0.537 779 (2,0,0)(0,1,1)96 0.219 0.139 0 0 0 0.531 815 (0,0,2)(0,1,1)96 0 0 -0.231 -0.190 0 0.536 815
(a) 7/21 observations (b) 7/23 observations Figure 4 Comparison of forecast volume and the observations for VMTG520 Figure 4(a) and 4(b) show the comparison of (2,0,1)(0,1,1)96 forecast volume and the
8
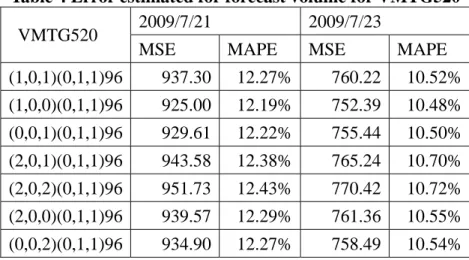
shows the estimated error of forecasting by MSE and MAPE for VMGT520. Interestingly, we can see that while the calibration error of Minsheng W. Road (775) is less than that of JianGuo Overpass (1196), the validation error is much higher, with MSE 943.58 vs 385.68 and MAPE 12.38% vs 10.87% for 21st July observations. We can also see from Figure 4 that the traffic volume fluctuates during morning peak and evening peak. For one reason, the traffic flows on the urban arterials are disturbed by traffic signal and the length of the signal phases. Therefore, using the ARIMA model on urban arterials which has local variations in traffic volume may take further investigations.
Table 4 Error estimated for forecast volume for VMTG520 2009/7/21 2009/7/23 VMTG520
MSE MAPE MSE MAPE
(1,0,1)(0,1,1)96 937.30 12.27% 760.22 10.52% (1,0,0)(0,1,1)96 925.00 12.19% 752.39 10.48% (0,0,1)(0,1,1)96 929.61 12.22% 755.44 10.50% (2,0,1)(0,1,1)96 943.58 12.38% 765.24 10.70% (2,0,2)(0,1,1)96 951.73 12.43% 770.42 10.72% (2,0,0)(0,1,1)96 939.57 12.29% 761.36 10.55% (0,0,2)(0,1,1)96 934.90 12.27% 758.49 10.54%
3.3 Artificial Neural Network model
The data collected from JianGuo Overpass and Minsheng W. Road were used for modeling, and the neural network was trained with Matlab (2009) toolbox. In our model, a two-layer feedforward network with 7 sigmoid hidden neurons and linear output neurons was employed. As we want to see the relationship that the downstream flow coming from the upstream with a time lag, the output vector is the northbound traffic volume from the downstream dector, and the input vectors are those of the corresponding upstream detectors at the previous time step, on the JianGuo Overpass on Tuesday to Thursday from 30th June to 23rd July 2009.
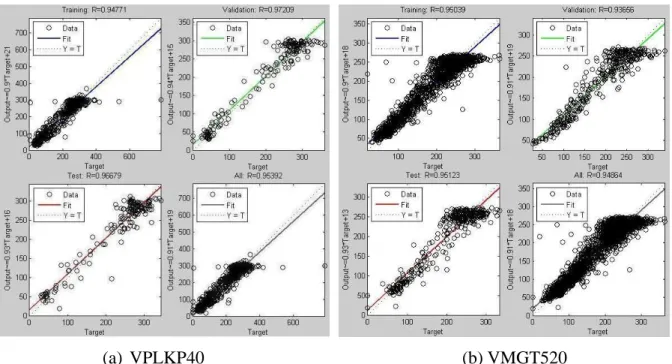
Our network divided the total 1151 samples into three sets, i.e., the first 805 samples for training purpose, the following 173 samples of validation data and the remaining 173 samples of testing data, and trained them with the default Levenberg-Marquardt backpropagation algorithm. To evaluate the prediction performance and compare with seasonal ARIMA model, the MSE were used to measure the error. The error estimated for the training data and validation data were 1149.76 and 585.85 for detector VPLKP40. Figure 5(a) shows the regression plot for the detector VPLKP40. The regression analysis revealed that R for training data, validation data and testing data are 0.94771, 0.97209 and 0.96679, respectively. The R for overall data was 0.95392.
To predict traffic flow on the urban arterial Minsheng W. Road with neural network, the westbound traffic volumes are analyzed similarly. The error estimated by MSE for the training data and validation data were 562.61 and 634.45 for detector VMGT520, and Figure 5(b) is the regression plot. The regression analysis revealed that R for training data, validation data and testing data are 0.95039, 0.93656 and 0.95123, respectively, and the R for overall was 0.94864.
9
(a) VPLKP40 (b) VMGT520
Figure 5 Regression plot for detectors VPLKP40 and VMGT520 3.4 Comparison of seasonal ARIMA and Neural Network
In order to find out which model is capable of predicting future traffic volume, we compared the MSE of calibration and MSE of validation for the two models. It is noted that the MSE values are not fully comparable between the two models as the number of data are different, as there are 864 observations for fitting ARIMA model, and 805 observations for the neural network. Error estimated by MSE for ARIMA model (2,0,1)(0,1,1)96 and neural network were
1196 and 1149.76 for VPLKP40, and they were 775 and 562.61 for VMTG520. Thus, both of the model fitting using neural networks on JianGuo Overpass and Minsheng W. Road were better than the seasonal ARIMA models.
Comparing the calibration and validation MSE, we can see that both the ARIMA model and Neural Network model can reasonably forecast the traffic flow for the overpass. For the urban arterial example, the validation error is generally much higher than the calibration error. This posts the question that if the classic time series modeling methodology is suitable to model the arterial traffic flow with signalized controlled intersections.
4. CONCLUSIONS
In this paper, traffic flow forecasting are modeled using seasonal ARIMA and neural network, using traffic data from an overpass and an arterial in Taipei city, Taiwan. Our research demonstrated the potentials of seasonal ARIMA and neural network in modeling traffic flow on urban arterials. With the numerical examples, the results show that the seasonal ARIMA at the temporal dimension and neural network formulating at the spatial dimension are able to forecast volume data with a high degree of accuracy. However, traffic flow forecasting for arterial with signalized intersections needs further investigated.
Forecasting of traffic volume at a particular location is useful for the traffic operation at a local level. However, for the purpose of ATMS which requires a macroscopic view of the traffic pattern, traffic forecasting for a wide area of the network is necessary. Therefore, the
10
spatial-temporal characteristics of the network will be a direction for future studies. For example, the cross-correlation functions may help in finding out the dependency between several time series data at different locations over time.
5. FINAL COMMENTS
Although the submitted proposal of the project is to investigate the traffic estimation and forecasting problem for traffic flow and travel time, the project is only granted for one year (it was proposed to be two years in the study plan). Therefore, only the traffic flow estimation and forecasting are executed.
Indeed, following the reviewer’s comments that the travel time estimation in urban arterial is too difficult to be success in reality because of reasons such as the disturbance of traffic signal, mixed traffic, as well as the malfunction issues of the vehicle detectors, the applicant further extended the study direction with submitting a NSC proposal on the spatial-temporal modeling of traffic flow, which was granted this year for a one year project.
References
DIA, H. (2001) An object-oriented neural network approach to short-term traffic forecasting. European Journal of Operational Research, 131, 253-261.
DOUGHERTY, M. S. and COBBETT, M. R. (1997) Short-term inter-urban traffic forecasts using neural networks. International Journal of Forecasting, 13, 21-31.
GHOSH, B., BASU, B. and O'MAHONY, M. (2005) Time-series modeling for forecasting vehicular traffic flow in Dublin. 85th Annual Meeting of Transportation Research Board. Washington, D.C.
GHOSH, B., BASU, B. and O'MAHONY, M. (2007) Bayesian Time-Series Model for Short-Term Traffic Flow Forecasting. Journal of Transportation Engineering, 133, 180-189.
LEDOUX, C. (1997) An urban traffic flow model integrating neural networks. Transportation Research Part C: Emerging Technologies, 5, 287-300.
MATLAB (2009) www.mathworks.com The MathWorks, Inc. MINITAB (2009) www.minitab.com Minitab Inc.
SMITH, B. L. and DEMETSKY, M. J. (1997) Traffic flow forecasting: Comparison of modeling approaches. Journal of Transportation Engineering, 123, 261.
SMITH, B. L., WILLIAMS, B. M. and KEITH OSWALD, R. (2002) Comparison of parametric and nonparametric models for traffic flow forecasting. Transportation Research Part C: Emerging Technologies, 10, 303-321.
STATHOPOULOS, A. and KARLAFTIS, M. G. (2003) A multivariate state space approach for urban traffic flow modeling and prediction. Transportation Research Part C: Emerging Technologies, 11, 121-135.
VLAHOGIANNI, E., GOLIAS, J. C. and KARLAFTIS, M. G. (2004) Short-term traffic forecasting: Overview of objectives and methods. Transport Reviews, 24, 533-557. WHITTAKER, J., GARSIDE, S. and LINDVELD, K. (1997) Tracking and predicting a
network traffic process. International Journal of Forecasting, 13, 51-61.
YIN, H., WONG, S. C., XU, J. and WONG, C. K. (2002) Urban traffic flow prediction using a fuzzy-neural approach. Transportation Research Part C: Emerging Technologies, 10, 85-98.
出席國際學術會議心得報告
計畫編號 NSC 98-2221-E-009 -108 計畫名稱 市區道路之短期旅行時間預測模式 出國人員姓名 服務機關及職稱 黃家耀 助理教授, 國立交通大學, 運輸科技與管理學系會議時間地點 10-12 December 2009, Hong Kong 會議名稱 The 14
th
International Conference of the Hong Kong Society for Transportation Studies (HKSTS)
發表論文題目 Short-term traffic flow forecasting for urban roads 會議時間地點 11-15 July, Lisbon, Portugal.
會議名稱 The 12th World Conference on Transport Research (WCTR)
發表論文題目 A multimodal network design problem for domestic container transportation with short sea shipping
With the sponsorship of the National Science Council, I have attended the 14th International Conference of the Hong Kong Society for Transportation Studies (HKSTS), which is the annual international conference in the transportation field held in Hong Kong. The paper was presented in the conference. I have also attended the 12th World Conference on Transport Research (WCTR), which is a triennial international conference covering general transportation-related topics. The main focus of the conference is to serve as a forum for the researchers, politicise, industries and all practitioners to gather and communicate. The paper was presented in the conference. (It is noted that the HKSTS trip was fully supported with the NSC funding, whereas the WCTR trip was mainly sponsored by the university seed fund and partly with the NSC fund).
Copies of the abstracts are attached for reference.
Publications:
1. Hsieh, Ya-Chen and Wong, K.I. (2009) Short-term traffic flow forecasting for urban roads. In Proceedings of the 14th International Conference of the Hong Kong Society for Transportation Studies, 10-12 December, Hong Kong, pp 779-788.
2. Wong, K.I., Lee, Paul T.-W., Szeto, W.Y. and Lai, G. H. Lai (2010) A multimodal network design problem for domestic container transportation with short sea shipping. The 12th World Conference on Transport Research, 11-15 July, Lisbon, Portugal.
SHORT-TERM TRAFFIC FLOW FORECASTING FOR URBAN ROADS Ya-Chen Hsieh and K.I. Wong*
Department of Transportation Technology and Management, National Chiao Tung University, Taiwan
ABSTRACT
The interests and applications of short-term traffic forecasting have been growing in the recent years. Many of the applications in Advance Traveler Information System (ATIS) and Advance Traffic Management Systems (ATMS) require an estimation and forecasting of the traffic conditions of the network. With a historical database of past traffic data from various types of vehicle detectors installed in the roads, real-time traffic information is collected which will be used to estimate the current traffic conditions and predict the condition in near future. Whereas most of the literature focused on the traffic flow prediction on the freeways, modeling traffic flow in urban arterials is more challenging as there are disturbances such as motorcycles and traffic signals in urban area. In this study, the traffic flow forecasting for urban arterials is investigated. Seasonal ARIMA and neural network are considered as the algorithms, and two arterials in the Taipei city, Taiwan, are studied in our numerical example.
A MULTIMODAL NETWORK DESIGN
PROBLEM FOR DOMESTIC CONTAINER
TRANSPORTATION WITH SHORT SEA
SHIPPING
WONG, K.I., Department of Transportation Technology and Management, National Chiao Tung University, Taiwan; [email protected]
LEE, Paul T.-W, Department of Logistics and Shipping Management, Kainan University, Taiwan; [email protected]
SZETO, W. Y., Department of Civil Engineering, University of Hong Kong, Hong Kong; [email protected]
LAI, G. H., Department of Transportation Technology and Management, National Chiao Tung University, Taiwan
ABSTRACT
With the growing importance of logistic in a green and environmental friendly way, it is widely accepted that short sea shipping (SSS) is a mean to divert the freight traffic from congested corridor in local communities as well as to reduce environmental costs. It can also relieve the problem of traffic congestion and investment on road construction and maintenance. This paper considers a multimodal transportation model for domestic container cargos, in which the flow of container cargos moving between foreign seaports and domestic cities can be transported via domestic seaports using SSS and inland by truck. We propose a two-level strategy in evaluating the various government policies to encourage or regulate the usage of SSS. While the objective of the freight carriers is to minimize its transportation cost, the government could internalize the external cost and invest on the transportation network with considering the cost to the society. A case study with the Taiwan network is performed to illustrate the benefit and performance of the model.
98 年度專題研究計畫研究成果彙整表
計畫主持人:黃家耀 計畫編號: 98-2221-E-009-108-計畫名稱:市區道路之短期旅行時間預測模式 量化 成果項目 實際已達成 數(被接受 或已發表) 預期總達成 數(含實際已 達成數) 本計畫實 際貢獻百 分比 單位 備 註 ( 質 化 說 明:如 數 個 計 畫 共 同 成 果、成 果 列 為 該 期 刊 之 封 面 故 事 ... 等) 期刊論文 0 0 100% 研究報告/技術報告 0 0 100% 研討會論文 0 0 100% 篇 論文著作 專書 0 0 100% 申請中件數 0 0 100% 專利 已獲得件數 0 0 100% 件 件數 0 0 100% 件 技術移轉 權利金 0 0 100% 千元 碩士生 0 0 100% 博士生 0 0 100% 博士後研究員 0 0 100% 國內 參與計畫人力 (本國籍) 專任助理 0 0 100% 人次 期刊論文 0 0 100% 研究報告/技術報告 0 0 100% 研討會論文 1 1 100% 篇 論文著作 專書 0 0 100% 章/本 申請中件數 0 0 100% 專利 已獲得件數 0 0 100% 件 件數 0 0 100% 件 技術移轉 權利金 0 0 100% 千元 碩士生 2 2 100% 博士生 0 0 100% 博士後研究員 0 0 100% 國外 參與計畫人力 (外國籍) 專任助理 0 0 100% 人次其他成果