The Investment Opportunity Set and Earnings
Management: Evidence from the Role of
Controlling Shareholders
corg_793 193..211Ken Y. Chen,* Randal J. Elder, and Shengmin Hung
ABSTRACTManuscript Type:Empirical
Research Question/Issue:We examine the incentive and entrenchment effects of controlling shareholders on the associa-tion between the investment opportunity set and earnings management in Taiwan.
Research Findings/Results:We find that firms with more investment opportunities are more likely to engage in earnings management. We also find incentive effects of controlling shareholders on firm’s financial reporting behavior in that cash flow rights are negatively associated with absolute abnormal accruals under a growth opportunity setting. Our results further indicate that high-growth firms with a high deviation between cash flow rights and control rights are more likely to engage in earnings management. Further analyses indicate that as the controlling shareholders have effective control of a firm, the effect of controlling shareholder deviation between control and cash flow rights on earnings management becomes stronger. Theoretical/Academic Implications: This study extends existing agency and contracting literature on the incentive and entrenchment effects of controlling shareholders in East Asia on firm value to the quality of financial reporting, which has been a consistent concern of regulators, practitioners, and academia. Our findings provide empirical evidence on the impact of controlling shareholders on the quality of financial reporting in a growth opportunity setting.
Practitioner/Policy Implications:Our findings suggest that the institutional environment, such as the growth opportunity setting in Taiwan, matters to the firm’s financial reporting behavior in an emerging market, where a corporate governance code has been enacted to protect minority shareholders. This study offers insights to policy makers interested in enhancing the mechanism of corporate governance in emerging markets, which have more potential conflict of interests between controlling shareholders and minority shareholders.
Keywords: Corporate Governance, Investment Opportunities, Earnings Management, Incentive Effects, Entrenchment Effects, Controlling Shareholders
INTRODUCTION
E
arnings management has been a consistent concern of regulators and practitioners for several years (e.g., Levitt, 1998), because it has raised concerns about the credibility of financial reporting, especially after high-profile accounting scandals involving once well-respected companies such as Enron and WorldCom in the US and Parmalat in Italy. Agency theory suggests that earnings management may arise when managers have opportunities to promote their ownself-interest at the shareholders’ expense resulting from informa-tion asymmetry and agency problems that exist between managers and shareholders (e.g., Shackelford, 1998).
Berle and Means (1932) indicate that the fundamental agency conflict is between shareholders and managers. However, Shleifer and Vishny (1997) argue that the funda-mental agency problem for listed companies in emerging markets is a conflict of interest between controlling share-holders and minority shareshare-holders. Following La Porta, Lopez-de-Silanes, Shleifer, and Vishny (1999), Claessens, Djankov, and Lang (2000) examine the issue of ultimate con-trolling shareholders in East Asia, because managers of East Asian corporations are usually related to the family of the controlling shareholder. They document that large
*Address for correspondence: National Taiwan University, College of Management, 1 Sec. 4, Roosevelt Rd., Taipei, Taiwan. Tel: (886-2) 3366-9780; E-mail: kenchen@ ntu.edu.tw
family-controlled firms have a significant deviation between ownership and control in Korea, Singapore, and Taiwan. The current study extends this strand of research (e.g., Claessens et al., 2000; La Porta et al., 1999) to further examine the impact of the controlling shareholders on the quality of financial reporting in Taiwan, a growth opportunity setting that has not been examined by prior studies such as Fan and Wong (2002), Francis, Schipper, and Vincent (2005), Leuz, Nanda, and Wysocki (2003), and Solomon, Lin, Norton, and Solomon (2003).1
Contracting theory suggests that the investment opportu-nity setting (Ios) affects corporate financing, dividend, and compensation policies (e.g., Smith & Watts, 1992). We argue that earnings management is implicit in corporate financing, dividend, and compensation policies, because managers have incentives to engage in earnings management to meet the firm’s financing (e.g., for lower cost of capital), dividend (e.g., meeting dividend threshold), and compensation (e.g., performance-based compensation) needs resulting from asymmetric information and agency problems associated with stakeholders. Moreover, contracting theory also sug-gests that firms with more investment opportunities and greater access to positive net present value projects are more difficult to observe and monitor, because as the proportion of firm value represented by investment opportunities increases, the observability of managerial actions decreases (e.g., Gaver & Gaver, 1993; Smith & Watts, 1992). Thus, man-agers in high-growth firms are more likely to engage in opportunistic behavior (Skinner, 1993; Watts & Zimmerman, 1986). In addition, high-growth firms will be more risky than non-growth firms because controls in high-growth firms are less likely to be effective (Andersen, Francis, & Stokes, 1993) in that the control system that has been installed may keep pace only with the original scale of opera-tions. Therefore, a weak internal control environment has the potential to allow “intentionally biased accruals through earnings management” (Doyle, Ge, & Mcvay, 2007).
As a consequence, this study builds on agency theory and contracting theory to examine the following two questions. First, we examine whether firms with higher investment opportunities are more likely to engage in earnings manage-ment. Second and more importantly, we examine the role of controlling shareholders on earnings management when firms have greater investment opportunities, which, to our knowledge, has not been previously examined.
Controlling shareholders have strong incentives to maxi-mize the firm’s value and discipline managers when they retain substantial cash flow rights in addition to control over firms (e.g., Claessens, Djankov, Fan, & Lang, 2002; Grossman & Hart, 1988), which restrains the diversion of corporate resources by the controlling shareholders. This suggests that controlling shareholders acting as an effective monitoring mechanism help alleviate agency problems between shareholders and managers (Claessens et al., 2002). Using cash flow rights to proxy for incentive effects as in Yeh and Woidtke (2005), we examine whether IOS-firms with more cash flow rights are less likely to engage in earnings management.
On the other hand, the entrenchment effects of controlling shareholders indicate that concentrated ownership creates incentives for controlling shareholders to camouflage their
self-serving behaviors and expropriate wealth from other shareholders, especially when there is a significant diver-gence between control and ownerships (e.g., Claessens et al., 2002). Using the divergence between cash flow and control rights to proxy for entrenchment effects as in Yeh and Woidtke (2005), we further examine whether firms with more deviation between cash flow and control rights are more likely to engage in earnings management.
The study uses Taiwan data to examine the role of control-ling shareholders on earnings management in a growth opportunity setting for the following reasons. First, many listed companies in Taiwan are high-tech companies, which normally have higher future investment opportunities. Second, Taiwanese listed companies are mostly character-ized by family-control in that there is significant deviation between cash flow and control rights. Third, the Taiwan securities regulator recently enacted the Corporate Gover-nance Best-Practice Principles (CGBPP) in early year 2002 to enhance the integrity of corporate financial reporting through strengthening corporate governance mechanisms.2
We select the sample from the Taiwan Economic Journal (TEJ) database, which includes companies listed on the Taiwan Stock Exchange Corporation (TSEC) and GreTai Securities Market (GTSM). We obtain the ownership data from the TEJ Corporate Governance Module, which has information on control rights percentage and cash flow rights percentage for most firms listed on TSEC and GTSM. To measure growth opportunities, we follow Baber, Jana-kiraman, and Kang (1996) to select an IOSproxy extracted from a common factor analysis of four proxies of growth opportunities (described later), instead of using a noisy proxy such as the market-to-book ratio.3We follow Ball and
Shivakumar (2006) and incorporate loss recognition asym-metry in measuring discretionary accruals to improve the model’s explanatory power.
The pooled regression results indicate that IOS firms are positively associated with higher discretionary accruals, consistent with our view that IOS firms are more likely to engage in earnings management. We further examine the incentive and entrenchment effects of controlling sharehold-ers on the association between IOS and earnings manage-ment. First, we find that the incentive effects of controlling shareholders alone reduce absolute discretional accruals. On the other hand, we find that the entrenchment effects alone do not significantly increase absolute discretional accruals until the deviation between control and cash flow rights reaches a high level. Second, when the ranked IOS is inter-acted with cash flow rights, and the deviation between control and cash flow rights, respectively, the incentive and entrenchment effects of controlling shareholders on firms’ financial reporting behavior under a growth opportunity setting still exist. Further analyses using certain characteris-tics of controlling shareholders also confirm the existence of the incentive and entrenchment effects of controlling share-holders on firm’s earnings management under a growth opportunity setting.
Our study extends the existing literature examining the incentive and entrenchment effects of controlling sharehold-ers in East Asia on firm value to the quality of financial reporting, which has been a consistent concern of regulators, practitioners, and academia (Durisin & Puzone, 2009). More
specifically, we provide evidence on the impact of control-ling shareholders on earnings management under a growth opportunity setting. That is, while prior literature (e.g., AlNajjar & Riahi-Belkaoui, 2001) examines the relation between investment opportunities and earnings manage-ment, the role of controlling shareholder on earnings man-agement has not been investigated. In addition, we incorporate both agency theory and contracting theory into an emerging market setting to shed light on the impact of incentive and entrenchment effects of controlling sharehold-ers on earnings management by firms with high investment opportunities. Our results imply that the institutional envi-ronment (e.g., growth opportunities in Taiwan) matters to the firm’s financial reporting behaviors in an emerging market, where a corporate governance code has been enacted to protect minority shareholders.
The remainder of this paper is organized as follows. The next section describes the institutional environment in Taiwan. The third section discusses related research and the development of hypotheses, followed by the research design and sample description in the fourth section. The fifth section discusses the empirical test results and addi-tional analyses, and the sixth section concludes the study.
INSTITUTIONAL ENVIRONMENT
The institutional environment in which the corporation operates can affect its investment opportunity set (Smith & Watts, 1992), and thus can have an impact on the relation between firms’ investment opportunities and earnings man-agement, the issue examined in this paper. We believe that the institutional environment in Taiwan provides an ideal setting for examining the corporate governance role of con-trolling shareholders on the relation between the investment opportunity set and earnings management for the following reasons. First, high-tech and other growth-driven firms such as those in the electronics industry comprise more than 50 percent of Taiwan listed companies, so the growth-opportunity setting is prevalent in this emerging market. Second, La Porta et al. (1999) document that corporate own-ership tends to be more concentrated and agency problems tend to be more severe in countries with weaker investor protection, which can be seen in emerging markets such as Taiwan. Claessens et al. (2000: 82) also document that large family-controlled firms in Taiwan have a significant devia-tion between ownership and control. Third, weak corporate governance commingled with the separation of ownership and control in East Asia provides a setting to examine issues of controlling shareholders and the demand for quality financial reporting.
In Taiwan, the Corporate Governance Best-Practice Principles were enacted in early 2002 to strengthen corporate gover-nance mechanisms. This regulatory setting provides a rich setting to explore the timely issue of the corporate gover-nance role of controlling shareholders. Using the growth opportunity setting in this emerging market to examine the corporate governance role of controlling shareholders complements the existing literature (e.g., Claessens et al., 2000) by examining the demand for financial reporting quality by controlling shareholders.
Related Research and Hypothesis Development
A firm can be viewed as a nexus of contracts in that its organization can be largely described by the set of contracts it enters (Jensen & Meckling, 1976). According to agency theory, the separation of ownership and controls leads to divergence between management and owner interests (Jensen & Meckling, 1976) in that agency problems arise when asymmetric information coexists with divergent pref-erences between managers and shareholders. When manag-ers have opportunities to promote their own self-interest at the shareholders’ expense resulting from information asym-metry and agency problems (e.g., Shackelford, 1998), earn-ings management may arise.
Investment Opportunity Set and
Earnings Management
Positive accounting theory suggests that a firm organizes itself in the most efficient way depending on such factors as the legal and institutional environment, technology, and degree of competition in its industry to maximize its future prospects (Watts & Zimmerman, 1986), which in turn deter-mine the firm’s investment opportunity set. This implies that the firm’s investment opportunity set will affect managerial behavior and decision making. When managers have special information or specific knowledge about investment options, it can be efficient to let them choose which options to pursue (e.g., Jensen & Meckling, 1995). However, agency costs increase in such cases, because managers may choose to maximize their own utility and enhance their own expected welfare at the expense of other claimholders, instead of maximizing firm value (e.g., Brickley, Smith, & Zimmerman, 1997).
Contracting-based accounting theory suggests that man-agers can choose particular accounting procedures either in an efficient way to maximize firm value, or in an opportu-nistic way to make the manager better off at the cost of other contracting parties (Holthausen, 1990). From an efficient contracting perspective, management can use earnings man-agement as a vehicle to convey manman-agement’s inside infor-mation to investors, given securities market efficiency (Scott, 2006).
Scott (2006) cites analytical models by Demski and Sap-pington (1990) and Stocken and Verrecchia (2004), which did not examine earnings management directly, but did have efficient contracting earnings management implications. Specifically, Demski and Sappington (1990) demonstrate that operating cash flows or some other relatively unmanaged performance measure such as core earnings can be used to convey some inside information about the firm’s future per-formance to investors. Further, Stocken and Verrecchia (2004) argue that while earnings management can be used to convey inside information to investors, it comes with report-ing costs, because investors’ ability to use the reported earn-ings to predict the firm’s future performance is reduced, and management can anticipate this reporting game in the equi-librium. Stocken and Verrecchia (2004) further show condi-tions (e.g., the firm faces high uncertainty, and the amount of inside information is high) under which earnings manage-ment can benefit both investors and the managers, where
the benefits of revealing inside information outweigh the reporting costs of earnings management.
From an opportunistic contracting perspective, managers maximize their utility in face of compensation and debt tracts (Scott, 2006), given incentives inherent in their con-tracts and conflicts of interest between the firm’s dispersed owner-investors and managers (Bergstresser & Philippon, 2006). For example, Bergstresser, Desai, and Rauh (2006) find that managers appear to opportunistically manage earnings through pension accounting (i.e., focusing on the assumed return on pension assets) in order to influence stock prices. Jiang, Petroni, and Wang (2009) examine the impact of CFO equity incentives on financial reporting behavior. They find that the magnitude of accruals and the likelihood of beating analyst forecasts are more sensitive to CFO equity incentives than to those of the CEO. Jaggi, Chin, Lin, and Lee (2006) find that Taiwanese firms disclosing optimistic earnings forecasts were more likely to engage in earnings manipulation than revision of forecasts to meet the forecast error threshold, which suggests reduced quality of reported earnings.
Contracting theory also suggests that firms with high investment opportunities, as reflected by a higher propor-tion of future investment (growth) oppropor-tions and lower assets-in-place (Myers, 1977), are more difficult to observe and monitor (e.g., Smith & Watts, 1992) by outside shareholders.4
Managers in high-growth firms are thus more likely to behave opportunistically (Skinner, 1993; Watts & Zimmer-man, 1986), which will further aggravate the lower observ-ability in growth firms. As a result of this lower observobserv-ability of managers’ activities and higher probability for managers’ opportunistic behavior, growth firms will be more risky than their non-growth counterparts (Smith & Watts, 1992). Moreover, controls in high-growth firms are less likely to be effective (Andersen et al., 1993), given the control system that has been installed may keep pace only with the original scale of operations. A weak internal control environment also has the potential to allow “intentionally biased accruals through earnings management” (Doyle et al., 2007). Shen and Chih (2007) find that firms with higher growth (i.e., lower earnings yield) are more likely to engage in earnings smoothing and earnings aggressiveness. Therefore, high growth firms are more likely to have unreliable financial reporting, which potentially increases the likelihood of earn-ings management.
Hypothesis 1. Firms with higher investment opportunities are more likely to engage in earnings management.
The Incentive and Entrenchment Effects of
Controlling Shareholders
The widely dispersed ownership among small shareholders of the modern firm was first advocated by Berle and Means (1932) in that equity ownership is separated from the day-to-day operation of the corporation, resulting in a conflict of interest between shareholders and managers. However, the fundamental agency problem for listed companies in emerg-ing economies is a conflict of interest between controllemerg-ing shareholders and minority shareholders (Shleifer & Vishny, 1997). La Porta et al. (1999) is the first study that examines the issue of ultimate controlling shareholders, and finds that
in contrast to the argument in Berle and Means (1932), rela-tively few firms are widely held, particularly in countries with poor shareholder protection. La Porta et al. (1999) document that corporate ownership tends to be more con-centrated and agency problems tend to be more severe in countries with weaker investor protection, which can be seen in emerging markets such as in Taiwan. Claessens et al. (2000) extend La Porta et al. (1999) to investigate the issue of ultimate controlling shareholders in East Asia, because man-agers of East Asian corporations are usually related to the family of the controlling shareholder. They document that the separation of ownership and control is most pronounced among family-controlled firms and small firms. More spe-cifically, large family-controlled firms have a significant deviation between ownership and control in Korea, Sin-gapore, and Taiwan. We extend this strand of research (e.g., Claessens et al., 2002) to examine in some depth the corpo-rate governance role of controlling shareholders in Taiwan by investigating the incentive and entrenchment effects of controlling shareholders on the relation between the invest-ment opportunity set and earnings manageinvest-ment. As a con-sequence, we develop our hypothesis in the following two competing ways: the incentive effects and the entrenchment effect of controlling shareholders.
The incentive effect of controlling shareholders refers to the argument that controlling shareholders exert greater monitoring on management, reduce agency conflicts, and maximize firms’ value (e.g., Demsetz & Lehn, 1985; Shleifer & Vishny, 1997). In contrast, the entrenchment effect of con-trolling shareholders refers to the argument that concon-trolling shareholders have incentives to maximize their own benefits at the cost of minority shareholders (Shleifer & Vishny, 1997). For example, the use of pyramidal groups and cross-holdings makes it easy for controlling shareholders to sepa-rate ownership and control, and it is difficult for minority shareholders to detect actions that benefit the controlling shareholders. Therefore, controlling shareholders may select board members that are less likely to monitor and are more likely to support them in order to benefit themselves at the expense of minority shareholders.
Prior studies on the issues of controlling shareholders are mainly related to firm value (e.g., Claessens et al., 2002; Lemmon & Lins, 2003). Based on the incentive effects of controlling shareholders, firm values are higher when the cash flow rights held by the controlling shareholders are higher. To better align their interests with other sharehold-ers, controlling shareholders may invest resources in posi-tive net present value (NPV) projects, and thus managers have the opportunity to increase their future wealth in pro-portion to their claims on the firm’s future cash flows (Lemmon & Lins, 2003).
Wang (2006) argues that ownership structures affect the supply of quality financial reporting, and finds that found-ing family ownership is associated with higher earnfound-ings quality (i.e., lower discretional accruals), which supports the incentive effect of controlling shareholders argument. More-over, controlling shareholders in firms in a high investment opportunity setting may demand higher quality financial reporting, given accounting earnings can be used to alleviate agency problems by aligning the interests of managers with those of outside shareholders or creditors (e.g., Bushman &
Smith, 2001). As a consequence, we posit that IOS firms with greater cash flow rights (proxy for incentive effects as in Yeh & Woidtke, 2005) of controlling shareholders are less likely to engage in earnings management.
Hypothesis 2a. Investment opportunity firms with greater cash flow rights of controlling shareholders are less likely to engage in earnings management.
In contrast, firm value is negatively associated with a sepa-ration of cash flow ownership and control (e.g., Claessens et al., 2002). Based on the entrenchment effect argument, con-trolling shareholders who control corporate assets can potentially expropriate from minority shareholders by diverting funds for their personal use or by committing resources to negative NPV projects to benefit themselves (Lemmon & Lins, 2003). This creates an opportunity for controlling shareholders to increase their wealth or perk consumption without bearing the full cost of their actions (see Shleifer & Vishny 1997 for further detail).
Controlling shareholders have incentives to expropriate wealth from other shareholders by managing accounting earnings (Jensen & Meckling, 1976), and thus we posit that controlling shareholders in IOS firms (i.e., greater access to positive NPV projects) are more likely to engage in earnings management, because IOS firms will be more risky than their non-growth counterparts (e.g., Smith & Watts, 1992). Using the divergence between cash flow rights and control rights to proxy for entrenchment effects of controlling share-holders, we thus develop the following hypothesis.
Hypothesis 2b. Investment opportunity firms with more devia-tion between cash flow rights and control rights of controlling shareholders are more likely to engage in earnings management.
RESEARCH DESIGN AND SAMPLE
DESCRIPTION
Development of Investment Opportunity Set
Common Factor
Different proxies have been used for growth opportunities in accounting research. Smith and Watts (1992) used a single growth variable as a proxy for growth opportunities, while others have developed a composite factor based on several growth variables (e.g., Baber et al., 1996; Gaver & Gaver, 1993).
The use of a composite factor analysis has been considered superior to a single observable proxy because it condenses pairwise correlations between observable variables and cap-tures variation common to these observable variables (Baber et al., 1996). Thus, a single factor can reflect the growth opportunities supported by several observable proxies. The selection of observable proxies to develop the growth factor differs across studies (Baber et al., 1996; Gaver & Gaver, 1993; Skinner, 1993; Smith & Watts, 1992; Gul & Tsui, 1998; Tsui, Jaggi, & Gul, 2001). Following Baber et al. (1996), we use the following four proxies for growth opportunities to develop a growth factor for each firm, which is generally known as the Investment Opportunities Set (IOS).
The first proxy is the firm’s investment activity (investment intensity), and is the sum of capital expenditures, research and development, and acquisitions, deflated by depreciation expense. Following Baber et al. (1996), we also consider current investment intensity as the realization of prior investment opportunities. Thus, the common factor invest-ment intensity will predict investinvest-ment intensity using infor-mation available at time t. The second proxy is year t-2 through year t geometric growth in the market value of assets (asset growth), and the third proxy is the end of year t market-to-book asset ratio (market-to-book). The fourth proxy is the year t ratio of research and development expense to the book value of assets (R&D).
Discretionary Accruals
Accruals are likely to capture evidence of earnings manage-ment because they reflect managers’ accounting estimates and accounting choices. Estimates of earnings management can be improved by incorporating the asymmetric timely gain and loss recognition role of accruals, which can improve the specification of “non-discretionary” accruals that is crucial to studies of earnings management (Ball & Shivaku-mar, 2006), and also enhance explanatory power by incorpo-rating loss recognition asymmetry in the accruals models. Following Ball and Shivakumar (2006, 2008), abnormal accru-als are estimated by the following linear regression.
ACC REV PPE CFO
DCF DCF CF i t o i t i t i t i t i t , , , , , , = + + + + + ∗ α α α α α4 1 α5 2 3 Δ O Oi t, +εi t, (1) Where:
ACCi,t= total accruals divided by lagged total assets for firm i in year t
DREVi,t= change in revenue divided by lagged total assets. PPEi,t= property, plant, and equipment divided by lagged total assets for firm i in year t
CFOi,t= cash flows from operation divided by lagged total assets for firm i in year t
DCFi,t= a dummy indicator for negative cash flows that takes the value 1 if CFOi,t< 0 and0 otherwise
Total accruals (ACCi,t) are measured as net income minus cash flows from operations for Firm I in year t. The DREVi,tis change in total revenue scaled by lagged total assets for company i in year t, and PPEi,tis the value of property, plant, and equipment for company i in year t. CFOi,tis cash flows from operations. This regression incorporates asymmetric recognition of accrued (unrealized) gains and losses in the standard accruals models, whereasDCFi,t, a dummy variable, takes a value of one if CFOi,t implies a loss in year t. The interaction term, DCFi,t*CFOi,t, is the proxy for economic losses.
Abnormal Accruals ACC REV PPE
CF i t, = i t, −
[
o+ i t, + i t, + ˆ ˆ ˆ ˆ α α α α3 1 2 Δ O Oi t, +αˆ4DCFi t, +αˆ5DCFi t,∗CFOi t,]
(2)Following Ball and Shivakumar (2006), abnormal accruals for firm i in year t, Abnormal Accrualsi,t, are calculated as the difference between the actual accruals and the estimated
normal accruals. We use the absolute value of abnormal accruals, Absolute Abnormal Accrualsi,t, as the dependent vari-able to proxy for earnings management in the regression model, which captures the combined effect of income-increasing and income-decreasing earnings management.
Absolute Abnormal Accrualsi t, = Abnormal Accrualsi t, (3)
Regression Model
We use the following regression model to test the relation between the investment opportunity set (IOS) and earnings management, after controlling for other factors identified by prior studies that are likely to affect earnings management:
Absolute Abnormal Accruals IOS
Cash Flow Rights
i t i t i , , , = + +β2 tt β β0 1 i t i t i t Deviation
Deviation Sq +CEO Duality Firm
+β4 +β5 β3 +β6 ,
, ,
_ SSize
Leverage Big N Auditor
Lag Absolute Abnor
i t i t i t , , , + + +ββ79 β8 mmal Accruals
Operating Cash Flow Foreign Institut i t i t , , + +ββ1011 iional Holdings Management Holdings Absolute Net I i t i t , , +
+ββ1213 nncome Change ROA
Loss Year i t i t i t year , , , + + + − + β β15 β 2003 2005 ε 14 (4) where: Absolute Abnormal
Accruals = absolute value of discretionary accruals calcu-lated as in Ball and Shivakumar (2006, 2008).
IOS = investment opportunity set, a composite factor score obtained from a common factor analysis following Baber et al. (1996) and using the following four proxies:
Investment intensity = (capital expenditures + research and development + acquisitions) deflated by depreciation expense at year t.
Asset growth = year t-2 through year t geometric growth in the market value of assets.
Market-to-book = the end of year t market-to-book asset ratio. R&D = the year t ratio of research and development expense to the book value of assets.
Cash Flow Rights = the proportion of shares or cash flow rights owned by the largest shareholder group
Deviation = the divergence between control rights and cash flow rights, where control rights equal the proportion of votes controlled by the largest shareholder group.
Deviation_Sq = square of Deviation, which is used to capture the effect of a high level of Deviation on the firm’s financial reporting behavior.
CEO Duality = indicator variable coded 1 if the chairman and the CEO of the firm are the same person; 0 otherwise. Firm Size = Ln(total assets).
Leverage = ratio of total debt to total assets.
Big N Auditor = indicator variable coded 1 if the auditor is a Big N audit firm; 0 otherwise.
Lag Absolute
Abnormal Accruals = absolute value of abnormal accruals in year t-1 divided by ending total assets in year t-2.
Operating Cash Flow = operating cash flow deflated by lagged total assets.
Foreign Institutional
Holdings = percentage of outstanding common shares held by foreign institutional shareholders.
Management
Holdings = percentage of outstanding shares held by management.
Absolute Net Income
Change = the absolute value of the change in the current year’s income before extraordinary items divided by lagged total assets.
ROA = rate of return on lagged total assets.
Loss = indicator variable coded 1 if the firm experienced a net loss for two or more consecutive years, and 0 other wise We then use the following model to test Hypothesis 2. That is, we first rank IOS into percentiles (i.e., firms in the highest (lowest) percentile receive a rank of 100[1]) to reduce the effect of negative IOS on the interaction IOS_Cash Flow Rights and IOS_Deviation, which could also lead to less mea-surement error (Frankel, Johnson, & Nelson, 2002; Johnston, 1984). Then we use the interaction term, IOS Rank_Cash Flow Rights, IOS Rank_Deviation (and IOS Rank_Deviation_Sq) to examine the incentive and entrenchment effects of control-ling shareholders in examining the relation between the investment opportunity set and earnings management.
Absolute Abnormal Accruals IOS Rank
IOS Rank Cash
i t, = + i t,
+β2 _ FFlow Rightsβ β0 1
IOS Rank Deviation IOS Rank Deviation
i t i t
, ,
+β3 _ +β4 _ _SSq
CEO Duality Firm Size Leverage
Big N A i t i t i t i t , , , , + + + +ββ58 uuditor β6 β7
Lag Absolute Abnormal Accruals Operating C i t i t , , + +ββ910 _ aash Flow
Foreign Institutional Holdings Manageme i t i t , , + +ββ1112 nnt Holdings
Absolute Net Income Change ROA i t i t i t , , , +
+ββ1314 +β15LLossi t, +βyearYear2003 05− +ε (5) where:
IOS Rank = IOS percentile ranking, where firms in the highest (lowest) percentile receive a rank of 100(1).
IOS Rank_Cash
Flow Rights = the interaction between IOS Rank and Cash Flow Rights.
IOS Rank_Deviation = the interaction between IOS Rank and Deviation.
IOS Rank_Deviation_Sq = the interaction between IOS Rank and Deviation_Sq.
The dependent variable proxy for earnings management is the absolute value of abnormal accruals estimated from Ball and Shivakumar (2006, 2008). For testing Hypothesis 1, the research variable in equation 4 is IOS, and we expect its coefficient to be positive. For testing Hypotheses 2a and 2b, the research variables are the interaction of Cash Flow Rights and IOS Rank (IOS Rank_Cash Flow Rights), and the interac-tion of Deviainterac-tion and IOS Rank (IOS Rank_Deviainterac-tion, and IOS Rank_Deviation_Sq). We expect the coefficients on IOS Rank_Cash Flow Rights (IOS Rank_Deviation and IOS Rank_Deviation_Sq) to be significantly negative (positive). The next section briefly explains the role of each of the control variables.
A CEO who is also the chairperson of the board of direc-tors (CEO Duality) can dominate the agenda and content of board meetings and control the process of nominating direc-tors, facilitating consideration of individuals who are loyal to the CEO-chairperson (Berg & Smith, 1978), which can promote CEO entrenchment, and result in a potential con-flict of interest situation that reduces shareholder wealth (Jensen & Meckling, 1976). Dechow, Sloan, and Sweeney (1996) find that firms subject to SEC enforcement actions resulting from earnings manipulations are more likely to have CEO duality, which is consistent with the argument that firms with CEO-dominated boards are more likely to be associated with lower levels of monitoring and/or weaker internal control systems, which in turn has the potential to allow “intentionally biased accruals through earnings man-agement” (Doyle et al., 2007). Therefore, the coefficient on CEO Duality is expected to be positive.
Large companies may have less incentive to engage in earnings management because they are subject to more scru-tiny from financial analysts and investors. However, they may have larger discretionary accruals than smaller compa-nies, and thus be more likely to engage in earnings manage-ment. Therefore, we control for firm size (Firm Size), but do not predict a sign for the coefficient on the size variable. We control for leverage (Leverage) because managers may use discretionary accruals to satisfy debt covenant requirements (e.g., DeFond & Jiambalvo, 1994). However, Deangelo, Deangelo, and Skinner (1994) find that financially distressed companies may manage earnings downward to get more concessions from the creditors. Thus, no sign is predicted for Leverage.
Prior studies find that firms with Big 5 auditors are asso-ciated with less earnings management (e.g., Becker, Defond, Jiambalvo, & Subramanyam, 1998; Francis, Maydew, & Sparks, 1999; Kim, Chung, & Firth, 2003). Therefore, we add an indicator variable Big N Auditor to capture the effect of a Big N auditor on earnings management, and expect a nega-tive coefficient on Big N Auditor. We also add lagged abso-lute abnormal accruals (Lag_Absoabso-lute Abnormal Accruals) to control for the possible effect of prior abnormal accruals that are reversed in the current period on the measurement of current period abnormal accruals. Following Lee, Hsu, and Chen (2003), we expect the coefficient on Lag_Absolute Abnormal Accruals to be positive.
Dechow, Sloan, and Sweeney (1995) find that operating cash flows are negatively associated with discretionary accruals. Therefore, operating cash flows (Operating Cash Flow) is added as a control variable. Prior studies suggest that institutional shareholders could serve as an effective monitoring mechanism (e.g., Matsumoto, 2002). Using a Spanish sample of listed firms from 1999 to 2001, Osma and Noguer (2007) find that the proportion of institutional direc-tors on the board is negatively related to discretionary accru-als. In Taiwan, Lee and Liao (2004) find a negative relation between foreign institutional ownership and absolute dis-cretionary accruals. Therefore, we also add foreign institu-tional ownership (Foreign Instituinstitu-tional Holdings) as a control variable and expect the coefficient on Foreign Institutional Holdings to be negative.
Prior research demonstrates a negative relationship between management ownership and earnings management
measured by the absolute value of discretionary accruals (e.g., Warfield, Wild, & Wild, 1995). Therefore, management ownership (Management Holdings) is added as a control vari-able. Prior studies suggest that the absolute change in the previous year’s income before extraordinary items divided by total assets is positively associated with earnings man-agement (e.g., Bartov, Gul, & Tsui, 2000; Klein, 2002). There-fore, the coefficient on Absolute Net Income Change is expected to be positive. We include lagged ROA (ROA) as in Kothari, Leone, and Wasley (2005) to control for differences in profitability. We also include a loss indicator variable (Loss) as Butler, Leone, and Willenborg (2004) suggest that discretionary accruals are high for financial distressed firms.
Sample Selection
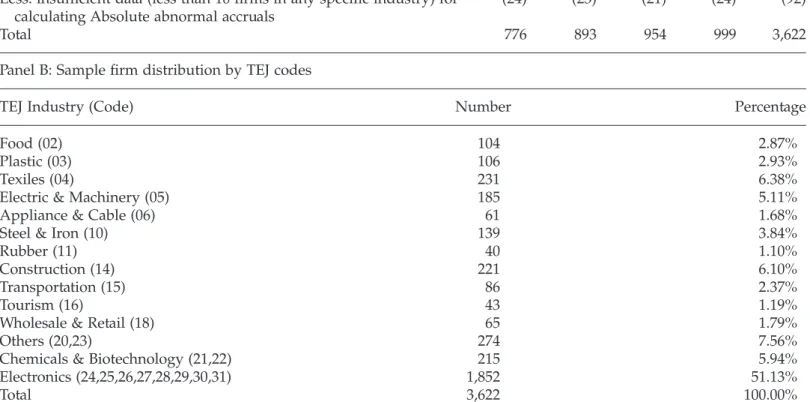
Table 1 provides details about the sample selection process and sample characteristics. Our sample period covers yeasr 2002 to 2005, following enactment of the Corporate Gover-nance Best Practice Principles early in the year 2002. This allows us to examine earnings management following enact-ment in this growth-option setting in Taiwan, and thus the corporate governance role of controlling shareholders on the relation between IOS and earnings management. Our sample is selected from the Taiwan Economic Journal (TEJ) database, which includes listed firms in TSEC/GTSM during the sample period. The financial data of the listed companies are also selected from the TEJ database. The own-ership structure information of the listed companies is selected from the TEJ Corporate Governance Module. In Panel A of Table 1, we report 4,301 firm-year observations (excluding financial services and insurance industries) for year 2002 to year 2005 (969, 1051, 1,125, and 1,156), respec-tively. We then exclude 15 observations missing control rights and/or cash flow rights data. We further eliminate 68 observations with missing data on foreign institutional shareholders. We also exclude 462 observations missing data for calculating IOS. We further delete 42 observations missing financial data. After deleting 92 observations with insufficient data (less than 10 firms in any specific industry for a given sample year) for calculating absolute abnormal accruals, the final sample after satisfying all the data require-ments is 3,622 firm-year observations for the full sample.
Panel B of Table 1 provides details about the sample dis-tribution (i.e., number and percentage) by TEJ industry code. The electronics industry has the largest number of companies, with 51.13 percent of the total observations in the full sample. The remaining sample companies are widely distributed across TEJ industry codes.
EMPIRICAL RESULTS
Dependent Variable: IOS Growth Factor
The investment opportunity set (IOS) factor for each sample firm is obtained by conducting common factor analysis on the four proxies investment intensity, asset growth, market-to-book, and R&D. The results of the factor analysis are reported in Table 2. Panel A reports the communalities of the indi-vidual IOS proxies. The communalities are the squared mul-tiple correlation obtained by regressing each of the proxies
with the other three proxies. Panel B shows the eigenvalues of the reduced correlation matrix of the four individual mea-sures of the IOS. As the first eigenvalue exceeds the sum of the four communalities, the one common factor fully explains the intercorrelations among the individual mea-sures (Cattrell, 1966; Harman, 1976). In Panel C, correlations between the common factors and the four proxies are pre-sented.5The common factor is significantly positively
corre-lated with all the individual measures of IOS, which suggest that the IOS factor captures the underlying construct that is common to all four measures of IOS. Panel D presents the descriptive statistics of the common factor, where the mean of IOS is around .00, which is similar to Gaver and Gaver (1993).
Descriptive Statistics
Table 3 provides the descriptive statistics for the sample. The mean (median) absolute abnormal accruals are .05 (.04), whereas the mean (median) discretionary accruals are -.00 (.00). The mean and median IOS factor is .00 and (-.17), respectively. The mean (median) value of cash flow rights is .24 (.21), which is comparable to the .22 (.19) values reported by Yeh and Woidtke (2005) for 251 Taiwanese firms for the year 1998, and higher than the .16 (.14) values in Claessens et al. (2000) for 92 Taiwanese firms for the year 1996. The mean (median) value of the deviation between control and cash flow rights is .05 (.01), which is also comparable to .09 (.05) reported by Yeh and Woidtke (2005).6The mean percentage
TABLE 1 Sample Selection Panel A: Sample Selection Criteria
Number of firm-year observations
Year Year Year Year Total
2002 2003 2004 2005
Companies listed in TSEC/GTSM excluding financial services and insurance industries
969 1,051 1,125 1,156 4,301
Less: missing data of cash flow rights and/or control rights (1) (0) (6) (8) (15)
Less: missing data of foreign institutional ownership (12) (15) (17) (24) (68)
Less: missing data for calculating Ios (151) (116) (118) (77) (462)
Less: missing financial data (5) (4) (9) (24) (42)
Less: insufficient data (less than 10 firms in any specific industry) for calculating Absolute abnormal accruals
(24) (23) (21) (24) (92)
Total 776 893 954 999 3,622
Panel B: Sample firm distribution by TEJ codes
TEJ Industry (Code) Number Percentage
Food (02) 104 2.87%
Plastic (03) 106 2.93%
Texiles (04) 231 6.38%
Electric & Machinery (05) 185 5.11%
Appliance & Cable (06) 61 1.68%
Steel & Iron (10) 139 3.84%
Rubber (11) 40 1.10%
Construction (14) 221 6.10%
Transportation (15) 86 2.37%
Tourism (16) 43 1.19%
Wholesale & Retail (18) 65 1.79%
Others (20,23) 274 7.56%
Chemicals & Biotechnology (21,22) 215 5.94%
Electronics (24,25,26,27,28,29,30,31) 1,852 51.13%
of shares hold by the largest controlling shareholders (Con-trolRight) is 29.2 per cent. On average, 31.8 percent of the firms have CEO dominance in that the positions of CEO and board chairman are held by the same individual.
The mean value of log assets was 15.16 while the mean debt ratio was 43 per cent for our sample. About 81 per cent of listed firms are audited by a Big N auditor. The mean lagged absolute abnormal accruals is .05. The mean operating cash flows deflated by lagged assets are .06 while foreign institutional shareholders on average own 5.57 per cent of these firms. On average, the percentage of outstanding common shares held by management is 1.90. The mean absolute value of change in the current year’s income before extraordinary items divided by lagged total assets is .06. The mean ROA is .04. On average, 17 percent of sample firms suffered a net loss for two or more con-secutive years.
Table 4 presents the correlation matrix for the dependent and independent variables for the full sample. As expected, the correlation between IOS and Absolute Abnormal Accruals is significantly positive, whereas the correlation between Cash Flow Rights and Absolute Abnormal Accruals is signifi-cantly negative. CEO dominance (CEO Duality) is positively and significantly correlated with Absolute Abnormal Accruals, possibly reflecting the existence of CEO power in the board.
All other independent variables, except Big N Auditor and Foreign Institutional Holdings, are significantly correlated with Absolute Abnormal Accruals. All VIFs are strictly less than rule-of-thumb cutoff of 10 (see Endnote 7 also). As a consequence, the regression models are relatively free from potential multicollinearity problems.
Regression Results
Tests of the research hypotheses using absolute abnormal accruals as the dependent variable are reported in panel A and panel B of Table 5.7Hypothesis 1 predicts that firms with
a greater investment opportunity set (IOS) will be more likely to engage in earnings management. Hypothesis 2a predicts that IOS firms with more cash flow rights of con-trolling shareholders will be less likely to engage in earnings management, indicating the incentive effect of controlling shareholders after controlling for other factors that might affect earnings management. Hypothesis 2b predicts that IOS firms with more deviation between cash flow rights and control rights of controlling shareholders will be more likely to engage in earnings management, indicating the entrench-ment of controlling shareholders after controlling potential factors affecting earnings management.
TABLE 2
Statistics Related to Common Factor Analysis of Four Measures of IOS for 3,622 Firm-year Observations from 2002 to 2005
(A): Estimated communalities of the four growth measuresa
Investment intensity Asset growth Market-to-book R & D
.20 .25 .33 .20
(B): Eigenvalues of the reduced correlation matrix of the four growth measures
1 2 3 4
1.05 .40 -.19 -.28
(C): Correlations between the common factor and the four growth measures
Investment intensity Asset growth Market-to-book R & D
.27 .85 .87 .12
(D) Descriptive statistics of the IOS factors extracted from the four measures of IOS
Mean Standard Deviation Minimum Lower Quartile Median Upper Quartile Maximum
.00 .70 -1.58 -.41 -.17 .24 7.79
aGrowth is the composite factor score obtained from common factor analysis using the following four proxies: (1) investment intensity = (capital expenditures + research and development + acquisitions) deflated by depreciation expense; (2) asset growth = year t-2 through year t geometric growth in the market value of assets; (3) market-to-book = the end of year t market-to-book asset ratio; and (4) R&D = the year t ratio of research and development expense to the book value of assets.
TABLE 3
Descriptive Statistics for Dependent and Independent Variables (N = 3,622)
Variable Mean Standard
deviation
Lower quartile
Median Upper
quartile
Absolute Abnormal Accruals .05 .05 .02 .04 .07
Abnormal Accruals -.00 .08 -.04 .00 .04
IOS .00 .70 -.41 -.17 .24
IOS Rank 50.49 28.87 25.00 50.50 75.00
Cash Flow Rights .24 .17 .11 .21 .34
Deviation .05 .09 .00 .01 .05 Control Right .29 .17 .16 .27 .40 CEO Duality .32 .47 .00 .00 1.00 Firm Size 15.16 1.26 14.28 14.99 15.82 Leverage .43 .19 .30 .43 .54 Big N Auditor .81 .39 1.00 1.00 1.00
Lag_Absolute Abnormal Accruals .05 .05 .02 .04 .07
Operating Cash Flow .06 .12 .01 .06 .12
Foreign Institutional Holdings (%) 5.57 10.42 .00 .76 5.79
Management Holdings 1.90 3.04 .10 .63 2.38
Absolute Net Income Change .06 .08 .01 .03 .07
ROA .04 .11 -.01 .04 .10
Loss .17 .37 .00 .00 .00
where:
Absolute Abnormal
Accruals = absolute value of discretionary accruals calculated as in Ball and Shivakumar (2006, 2008).
IOS = investment opportunity set, a composite factor score obtained from a common factor analysis following Baber et al. (1996) and using the following four proxies:
Investment intensity = (capital expenditures + research and development + acquisitions) deflated by depreciation expense at year t.
Asset growth = year t-2 through year t geometric growth in the market value of assets. Market-to-book = the end of year t market-to-book asset ratio.
R&D = the year t ratio of research and development expense to the book value of assets. Cash Flow Rights = the proportion of shares or cash flow rights owned by the largest shareholder group.
Deviation = the divergence between control rights and cash flow rights, where control rights equal the proportion of votes controlled by the largest shareholder group.
Deviation_Sq = square of Deviation, which is used to capture the effect of a high level of Deviation on the firm’s financial reporting behavior.
CEO Duality = indicator variable coded 1 if the chairman and the CeoDuality of the firm are the same person; 0 otherwise.
Firm Size = Ln(total assets).
Leverage = ratio of total debt to total assets.
Big N Auditor = indicator variable coded 1 if the auditor is a Big N audit firm; 0 otherwise. Lag Absolute
Abnormal Accruals = absolute value of abnormal accruals in year t-1 divided by ending total assets in year t-2. Operating Cash Flow = operating cash flow deflated by lagged total assets.
Foreign Institutional
Holdings = percentage of outstanding common shares held by foreign institutional shareholders. Management
Holdings = percentage of outstanding shares held by management. Absolute Net Income
Change = the absolute value of the change in the current year’s income before extraordinary items divided by lagged total assets.
ROA = rate of return on lagged total assets.
Loss = indicator variable coded 1 if the firm experienced a net loss for two or more consecutive years, and 0 otherwise.
Panel A of Table 5 presents five models (1-1 to 1-5) used primarily to test Hypothesis 1. In Models 1-1 to 1-3, we add IOS, Cash Flow Rights, and Deviation to the control variables in the regression analysis. Models 1 to 4 include Deviation_Sq to capture the effect of a high level of Deviation on the firm’s financial reporting behavior. The distribution of Deviation from the descriptive statistics in Table 3 shows that the value of Deviation below the median (.01) is still quite small, and even the mean value (.05) of Deviation is closer to its third quartile (.05). Therefore, we speculate that the effect of tion on Absolute Abnormal Accruals (and the effect of Devia-tion on the relaDevia-tion between IOS and Absolute Abnormal Accruals) will not be significant until it reaches a certain high level. Model 1-5 presents the full model for testing Hypoth-esis 1.
With respect to the research variables, the coefficient on IOS is significantly positive (.02, p< .001) in all models, which suggests that firms with future investment opportu-nities are more likely to engage in earnings management. As a consequence, Hypothesis 1 is supported, which is consis-tent with AlNajjar and Riahi-Belkaoui (2001) that the level of growth opportunities is likely to affect the nature of earnings management. The coefficient on Cash Flow Rights is signifi-cantly negative (-.01, p< .05), whereas the coefficients on Deviation are insignificant (.01, -.02, and -.03; P> .10, respec-tively) in Models 1-3 to 1-5. However, the coefficients on Deviation_Sq are significantly positive (.09, and .10; p< .05) in both Models 1 to 4 and 1 to 5, suggesting that a high level of Deviation is significantly related to Absolute Abnormal Accruals.
With respect to the control variables, the coefficient on Firm Size is significantly negative, indicating that larger companies have lower absolute abnormal accruals. One possible expla-nation is that the investors’ required rate of return for a large firm is lower than the return required for a small firm (Fama & French, 1992). That is, the cost of equity and risk of a large company is low. Therefore, larger firms facing lower risk may be less likely to engage in earnings management. The coeffi-cient on Big N Auditor is marginally significantly positive in all models, which is in contrast with prior US studies such as Becker et al. (1998) and Francis et al. (1999). One possible explanation might be due to the institutional environment in that auditor litigation risk (e.g., investor class actions) in Taiwan is comparatively lower than in the US.
The coefficient on Foreign Institutional Holdings is signifi-cantly positive in all models, which is inconsistent with the findings of Lee and Liao (2004) of a negative relation between foreign institutional ownership and absolute discretionary accruals. The inconsistency might be due to differences in the methods used to estimate abnormal accruals. It may also be due to the fact that foreign investment in a portfolio of securities is more short-term oriented (SFI, 2005). Therefore, those foreign institutional shareholders may choose firms with higher earnings management as their investment targets, regardless of their earnings quality. The coefficient on Management Hold-ings is significantly positive in Models 1-1 and 1-4; however, it is insignificantly positive in the full model. The coefficient on Absolute Net Income Change is significantly positive in all five models, suggesting that the absolute change in the previous year’s income before extraordinary
TABLE 4 Pearson Correlation Matrix for Dependent and Independent Variables (N = 3,622) N = 3, 62 2 12345678 9 10 11 12 13 14 15 16 17 1 Absolute Abnormal A ccr u als 1.00 2 Abnormal A ccr u als -.20*** 1.00 3 IOS .12*** .35*** 1.00 4 IOS Rank .03 .35*** .83*** 1.00 5 Cash Flow Rights -.11*** .06*** -.03† .01 1.00 6 Devia tion .02 .00 .02 .02 -.27*** 1.00 7 CEO Du ality .04** -.03 .00 .00 .04* -.15*** 1.00 8 F irm Size -.09*** .11*** .08*** .14*** -.14*** .12*** -.15*** 1.00 9 Levera g e .11*** -.27*** -.14*** -.11*** -.03† -.01 -.03 .08*** 1.00 10 Big N A uditor .02 -.01 .07*** .06*** -.02 .07*** .03† .09*** -.11 1.00 11 La g_Absolute Abnormal A ccr u als .30*** -.02 .10*** .03* -.09*** .01 .03 -.09*** .05 .03† 1.00 12 Opera ting Cash Flow -.06*** .01 .22*** .19*** -.02 .06*** -.03* .08*** -.33 .13*** .01 1.00 13 Foreign Institution al Holdings .01 .10*** .18*** .21*** -.02 -.03 -.04* .33*** -.12 .13*** .01 .17*** 1.00 14 Man agement Holdings .04* .06*** .10*** .08*** -.20*** .26*** .01 -.16*** -.09 .03† .07*** .01 -.07*** 1.00 15 Absolute Net Income Change .33*** -.15*** .11*** -.04* -.12*** .01 .03† -.11*** .15 -.02 .39*** -.10*** -.04* .00 1.00 16 ROA -.17*** .65*** .63*** .63*** .07*** .02 -.03† .14*** -.41 .09*** -.00 .40*** .19*** .12*** -.16*** 1.00 17 Loss .23*** -.38*** -.29*** -.39*** -.07*** .00 .05** -.12*** .34 -.10*** .16*** -.19*** -.12*** -.07*** .13*** -.57*** 1.00 V ariables are defined in T able 3. †, *, **, and *** indica te significance at the .10, .05, .01, and .001 per cent levels, respectivel y, in a two-t ailed test .
TABLE 5
Panel A: Regression of Absolute Abnormal Accruals on Ios, CashFlowRight, Deviation, and Control Variables; Panel B: Regression of Absolute Abnormal Accruals on IOS Rank, IOS Rank_Cash Flow Rights, IOS Rank_Deviation, and
Control Variables Panel A
Model 1-1 Model 1-2 Model 1-3 Model 1-4 Model 1-5
Intercept (expected sign) .05 .06 .05 .05 .06
(4.67)*** (5.25)*** (4.83)*** (4.76)*** (5.28)***
IOS (+) .02 .02 .02 .02 .02
(7.17)*** (7.07)*** (7.17)*** (7.19)*** (7.09)***
Cash Flow Rights (-) -.01 -.01
(-2.44)* (-2.35)* Deviation (+) .01 -.02 -.03 (.96) (-1.19) (-1.54) Deviation_Sq (+) .09 .10 (1.99)* (2.19)* CEO Duality (+) .00 .00 .00 .00 .00 (.94) (.98) (1.07) (.98) (.95) Firm Size (?) -.00 -.00 -.00 -.00 -.00 (-2.08)* (-2.54)* (-2.26)* (-2.10)* (-2.47)* Leverage (?) -.01 -.01 -.01 -.01 -.01 (-1.04) (-.97) (-1.03) (-1.09) (-1.03) Big N Auditor (-) .00 .00 .00 .00 .00 (1.88)† (1.87)† (1.81)† (1.81)† (1.83)†
Lag_Absolute Abnormal Accruals (+) .20 .20 .20 .20 .20
(6.50)*** (6.48)*** (6.50)*** (6.52)*** (6.50)***
Operating Cash Flow (?) .01 .01 .01 .01 .01
(.82) (.75) (.78) (.78) (.72)
Foreign Institutional Holdings (-) .00 .00 .00 .00 .00
(1.97)* (2.05)* (2.07)* (2.04)* (2.08)*
Management Holdings (-) .00 .00 .00 .00 .00
(1.82)† (1.27) (1.45) (1.90)† (1.61)
Absolute Net Income Change (+) .11 .11 .11 .11 .11
(4.60)*** (4.53)*** (4.59)*** (4.58)*** (4.51)*** ROA (?) -.14 -.14 -.14 -.14 -.14 (-4.87)*** (-4.74)*** (-4.86)*** (-4.88)*** (-4.76)*** Loss (+) .02 .02 .02 .02 .02 (4.64)*** (4.60)*** (4.63)*** (4.64)*** (4.60)*** Year 2003 (?) .00 .00 .00 .00 .00 (.52) (.57) (.52) (.52) (.56) Year 2004 (?) .01 .01 .01 .01 .01 (5.60)*** (5.57)*** (5.60)*** (5.59)*** (5.55)*** Year 2005 (?) .00 .00 .00 .00 .00 (1.65)† (1.64) (1.64) (1.63) (1.63) N 3,622 3,622 3,622 3,622 3,622 Adjusted R2 .22 .23 .22 .22 .23 F value 28.76 27.31 26.94 25.60 24.61
TABLE 5 Continued Panel B
Model 2-1 Model 2-2 Model 2-3 Model 2-4 Model 2-5
Intercept (expected sign) .04 .04 .04 .04 .04
(3.22)** (3.64)*** (3.46)*** (3.39)*** (3.70)***
IOS Rank (+) .00 .00 .00 .00 .00
(7.09)*** (7.26)*** (6.72)*** (6.76)*** (6.80)***
IOS Rank_Cash Flow Rights (-) -.00 -.00
(-2.20)* (-2.03)* IOS Rank_Deviation (+) .00 -.00 -.00 (1.13) (-.37) (-.79) IOS Rank_Deviation_Sq (+) .00 .00 (1.36) (1.66)† CEO Duality (+) .00 .00 .00 .00 .00 (.79) (.81) (.95) (.91) (.87) Firm Size (?) -.00 -.00 -.00 -.00 -.00 (-2.60)** (-2.97)** (-2.84)** (-2.77)** (-3.03)** Leverage (?) -.01 -.01 -.01 -.01 -.01 (-1.01) (-.97) (-1.00) (-1.03) (-1.01) Big N Auditor (-) .00 .00 .00 .00 .00 (2.17)* (2.13)* (2.10)* (2.09)* (2.08)*
Lag_Absolute Abnormal Accruals (+) .19 .19 .19 .19 .19
(6.06)*** (6.06)*** (6.07)*** (6.07)*** (6.07)***
Operating Cash Flow (?) .01 .01 .01 .01 .01
(.85) (.78) (.79) (.79) (.75)
Foreign Institutional Holdings (-) .00 .00 .00 .00 .00
(2.17)* (2.20)* (2.32)* (2.30)* (2.28)*
Management Holdings (-) .00 .00 .00 .00 .00
(1.98)* (1.49) (1.53) (1.79)† (1.56)
Absolute Net Income Change (+) .15 .14 .14 .14 .14
(5.55)*** (5.47)*** (5.53)*** (5.53)*** (5.46)*** ROA (?) -.10 -.10 -.10 -.10 -.10 (-3.56)*** (-3.49)*** (-3.54)*** (-3.55)*** (-3.49)*** Loss (+) .02 .02 .02 .02 .02 (6.17)*** (6.13)*** (6.14)*** (6.14)*** (6.12)*** Year 2003 (?) .00 .00 .00 .00 .00 (.51) (.53) (.53) (.53) (.55) Year 2004 (?) .01 .01 .01 .01 .01 (4.79)*** (4.79)*** (4.80)*** (4.78)*** (4.78)*** Year 2005 (?) .00 .00 .00 .00 .00 (1.85)† (1.79)† (1.84)† (1.84)† (1.78)† N 3,622 3,622 3,622 3,622 3,622 Adjusted R2 .21 .21 .21 .21 .21 F value 27.03 25.52 25.27 23.80 22.68
†, *, **, and *** indicate significance at the .10, .05, .01, and .001 per cent levels, respectively, in a two-tailed test. The t-statistics are based on the robust standard errors corrected for heteroscedasticity and clustering at the firm level. Variables are defined in Table 3.
items scaled by total assets is positively related to earnings management.
The coefficient on ROA is significantly negative for all five models, which suggests that firms with higher profit-ability engage in less earnings management. As expected, the Loss variable is significantly positive for all five models. The coefficient on Year 2004 is significantly positive. Since 2004 is a presidential election year, the firm’s operations might be influenced by the unstable political environment caused by controversy related to the presidential election. Therefore, the firm’s financial reporting behavior might be affected.
Panel B of Table 5 presents 5 Models (2-1 to 2-5) to test Hypothesis 2. In Models 2-1 to 2-3, we add IOS Rank, and interact IOS Rank with Cash Flow Rights and Deviation, respectively, to examine the role of controlling shareholders on the relation between IOS and Absolute abnormal accru-als. Following Model 1-4, we add Deviation_Sq in Model 2-4 to capture the effect of a high level of Deviation on the firm’s financial reporting behavior. Model 2-5 presents the full model for testing Hypothesis 2.
The coefficient on IOS Rank is still significantly positive (.00, p< .001) in all models. The coefficient on IOS Rank-_Cash Flow Rights is significantly negative (-.00, p< .05) in Model 2-2 and (-.00, p< .05) Model 2-5 (the full model), indicating the incentive effects of controlling shareholders on firm’s financial reporting behavior. Therefore, our Hypothesis 2a is supported. The coefficient on IOS Rank_Deviation is not significant in models 2-3-2-5. However, the coefficient on IOS Rank_Deviation_Sq is mar-ginally significantly positive (.00, p< .10) in the full model, suggesting that the entrenchment effects of controlling shareholders do not exist until the deviation between control and cash flow rights reaches a high level. There-fore, Hypothesis 2b is supported only under a high level of deviation between control and cash flow rights. These results suggest that IOS firms with a high deviation between cash flow rights and control rights are more likely to engage in earnings management, which further docu-ments the entrenchment effects of controlling shareholders facilitates earnings management behavior under a growth opportunity setting. With respect to the control variables, the results are qualitatively similar to those reported in the panel A of Table 5.
ROBUSTNESS TESTS
The Role of Largest Controlling Shareholders
Lemmon and Lins (2003) find that the negative effect of controlling shareholder deviation between control and cash flow rights on the firms’ stock returns during the Asian financial crisis is stronger when the controlling shareholder has effective control of firm assets. We further examine the role of largest controlling shareholders on firm’s financial reporting behavior by first using the variable, Control Rights to proxy for the percentage of shares held by the largest controlling shareholders, and then using a dummy variable, Control Rights Dummy, to capture controlling shareholders whose percentage of shares held is greater than 50 per cent. Then, we interact Control Rights and Control Rights Dummy
with Deviation in Panel A of Table 6 (and IOS Rank_Deviation in panel B of Table 6) to investigate the effect of controlling shareholder deviation between control and cash flow rights on firm’s financial reporting behavior. We rerun our regres-sion models, similar to those of Table 5, and the empirical results are reported in Panel A and Panel B of Table 6.8
From Models 3-1 and 3-2 in panel A of Table 6, we find that the coefficient on Deviation_Control Rights, and Devia-tion_Control Rights Dummy is significantly positive, indicat-ing that when control rights are high, the effect of controlling shareholder voting-cash flow rights divergence on earnings management is stronger, which reflects the entrenchment effect of controlling shareholders on firm’s financial reporting behavior. The coefficients on IOS and Cash Flow Rights are all significantly positive, and negative, respectively, which is qualitatively similar to the results reported in Panel A of Table 5. With respect to the control variables, the results are also qualitatively similar to those reported in Panel A of Table 5.
In Models 4-1 and 4-2 in Panel B of Table 6, the coefficients on IOS Rank_ Deviation_Control Rights (i.e., the interaction term of IOS Rank_Deviation and Control Rights), and IOS Rank_Deviation_Control Rights Dummy (i.e., the interaction term of IOS Rank_Deviation and Control Rights Dummy) are significantly positive, suggesting that as the controlling shareholders have effective control of a firm, the effect of controlling shareholder voting-cash flow rights divergence on earnings management is stronger, which further con-firms the entrenchment effects of controlling shareholders on firms’ financial reporting behavior. The coefficients on IOS Rank and IOS Rank_Cash Flow Rights are all significantly positive, and negative, respectively, which is qualitatively similar to the results reported in Panel B of Table 5. With respect to the control variables, the results are also qualita-tively similar to those reported in Panel B of Table 5.
Analyses of Sample Firms before the CGBPP
Was Enacted
Our main analyses focus on the sample firms beginning in year 2002 (the year the Corporate Governance Best-Practice Principles was enacted), because the paper examines the corporate governance role of controlling shareholders in Taiwan. Although the concept of corporate governance did not gain relevance in Taiwan until the 1997 Asian financial crisis, some internal governance systems, such as enhancing information disclosure and transparence, and implementing internal control systems, were required by the Company Law and Securities Law (Chen, Elder, & Hsieh, 2007). There-fore, it is interesting to extend our sample to years before year 2002, and examine whether IOS firms’ earnings man-agement behavior changes. We rerun our regression analy-ses by examining four sample years before 2002 (year 1998 to year 2001), and the untabulated results indicate that the coefficients on our research variables, Cash Flow Rights, Deviation, IOS Rank_Cash Flow Rights, IOS Rank_Devia-tion_Sq, are not significant, which is different from the sig-nificant results reported in Panels A and B of Table 5 and 6. Our significant results using sample firms starting year 2002, in contrast with insignificant results before year 2002,
TABLE 6
Panel A: Additional Analyses of the Role of Largest Controlling Shareholder Regression of Absolute abnormal Accruals on Ios, its Interactions, and Control Variables; Panel B: Additional Analyses of the Role of Largest
Controlling Shareholder Regression of Absolute Abnormal Accruals on IosRank, its Interactions, and Control Variables
Panel A
Model 3-1 Model 3-2
Intercept (expected sign) .06 .06
(5.43)*** (5.41)***
IOS (+) .02 .02
(7.09)*** (7.07)***
Cash Flow Rights (-) -.01 -.01
(-2.74)** (-2.59)** Deviation (+) -.04 -.01 (-1.77)† (-.77) Deviation_Control Rights (+) .10 (2.16)* Deviation_Control Rights Dummy(+) .03 (1.73)† CEO Duality (+) .00 .00 (.94) (.99) Firm Size (?) -.00 -.00 (-2.61)** (-2.65)** Leverage (?) -.01 -.01 (-1.04) (-.98) Big N Auditor (-) .00 .00 (1.88)† (1.86)† Lag_Absolute Abnormal Accruals (+) .20 .20 (6.50)*** (6.49)***
Operating Cash Flows (?) .01 .01
(.76) (.77) Foreign Institutional Holdings (-) .00 .00 (2.17)* (2.16)* Management Holdings (-) .00 .00 (1.47) (1.32)
Absolute Net Income Change (+) .11 .11 (4.52)*** (4.52)*** ROA (?) -.14 -.14 (-4.76)*** (-4.74)*** Loss (+) .02 .02 (4.55)*** (4.54)*** Year 2003 (?) .00 .00 (.56) (.57) Year 2004 (?) .01 .01 (5.55)*** (5.56)*** Year 2005 (?) .00 .00 (1.60) (1.60) N 3622 3622 Adjusted R2 .23 .23 F value 24.37 24.32 Panel B Model 4-1 Model 4-2
Intercept (expected sign) .04 .04
(3.78)*** (3.86)***
IOS Rank (+) .00 .00
(6.99)*** (7.13)*** IOS Rank_Cash Flow
Rights (-) -.00 -.00 (-2.40)* (-2.50)* IOS Rank_Deviation (+) -.00 -.00 (-1.53) (-1.29) IOS Rank_Deviation_Control Rights (+) .00 (2.16)* IOS Rank_Deviation_Control Rights Dummy(+) .00 (2.40)* CEO Duality (+) .00 .00 (.84) (.85) Firm Size (?) -.00 -.00 (-3.10)** (-3.17)** Leverage (?) -.01 -.01 (-1.02) (-1.01) Big N Auditor (-) .00 .00 (2.11)* (2.10)* Lag_Absolute Abnormal Accruals (+) .19 .19 (6.08)*** (6.08)***
Operating Cash Flow (?) .01 .01
(.80) (.84) Foreign Institutional Holdings (-) .00 .00 (2.37)* (2.41)* Management Holdings (-) .00 .00 (1.58) (1.60) Absolute Net Income
Change (+) .14 .14 (5.46)*** (5.45)*** ROA (?) -.10 -.10 (-3.49)*** (-3.50)*** Loss (+) .02 .02 (6.11)*** (6.08)*** Year 2003 (?) .00 .00 (.54) (.54) Year 2004 (?) .01 .01 (4.75)*** (4.75)*** Year 2005 (?) .00 .00 (1.75)† (1.69)† N 3622 3622 Adjusted R2 .21 .21 F value 22.67 22.70
†, *, **, and *** indicate significance at the .10, .05, .01, and .001 per cent levels, respectively, in a two-tailed test. The t-statistics are based on the robust standard errors corrected for heteroscedasticity and clustering at the firm level. Variables are defined in Table 3.