Accepted Manuscript
Understanding Space-time Patterns of Groundwater System by Empirical Or-thogonal Functions: a Case Study in the Choshui River Alluvial Fan, Taiwan
Hwa-Lung Yu, Hone-Jay Chu
PII: S0022-1694(09)00766-5
DOI: 10.1016/j.jhydrol.2009.11.046
Reference: HYDROL 16919
To appear in: Journal of Hydrology
Received Date: 4 July 2009 Revised Date: 25 November 2009 Accepted Date: 26 November 2009
Please cite this article as: Yu, H-L., Chu, H-J., Understanding Space-time Patterns of Groundwater System by Empirical Orthogonal Functions: a Case Study in the Choshui River Alluvial Fan, Taiwan, Journal of Hydrology (2009), doi: 10.1016/j.jhydrol.2009.11.046
This is a PDF file of an unedited manuscript that has been accepted for publication. As a service to our customers we are providing this early version of the manuscript. The manuscript will undergo copyediting, typesetting, and review of the resulting proof before it is published in its final form. Please note that during the production process errors may be discovered which could affect the content, and all legal disclaimers that apply to the journal pertain.
ACCEPTED MANUSCRIPT
Understanding Space-time Patterns of Groundwater System by Empirical
1
Orthogonal Functions: a Case Study in the Choshui River Alluvial Fan,
2
Taiwan
3
Hwa-Lung Yu1, Hone-Jay Chu1* 4
Abstract 5
Natural or anthropogenic activities contribute to changes of groundwater levels in 6
space and time. Understanding the major and significant driving forces to changes in 7
space-time patterns of groundwater levels is essential to groundwater management. 8
This study analyzes monthly observations of piezometric heads from sixty-six wells 9
during 1997-2002 located in the Choshui River alluvial fan of Taiwan, where 10
groundwater has been the important local water resource for myriads of agricultural or 11
industrial demands. Following spatiotemporal estimations of piezometric heads by 12
Bayesian Maximum Entropy method (BME), this work performs rotated empirical 13
orthogonal function (REOF) analysis to decompose the obtained space-time heads 14
into a set of spatially distributed empirical orthogonal functions (EOFs) and their 15
associated uncorrelated time series. Results show that the leading EOFs represent the 16
most significant driving forces to spatiotemporal changes of groundwater levels in the 17
Choshui River aquifer. These include rainfall recharges from upstream Choshui and 18
Pei-Kang River, pumping activities from aquaculture usages in the coastal areas, as 19
well as water exchanges between surface and subsurface flow of Choshui River. In 20
summary, this study shows the strength of the REOF analysis which can effectively 21
provide integrative views of spatiotemporal changes of groundwater, gaining insights 22
of interactions between the groundwater system and other natural and human 23
activities. 24
Keywords: Empirical Orthogonal Function; Choshui River alluvial fan; Groundwater; 25
Bayesian Maximum Entropy; Space-time data analysis. 26
1
Dept of Bioenvironmental Systems Engineering, National Taiwan University, Taipei, 10617 Taiwan
ACCEPTED MANUSCRIPT
Introduction 27
Groundwater has long been a reliable water source for a variety of uses such as 28
domestic, agricultural, and industrial uses (Yang and Yu, 2006; Chu and Chang, 29
2009). In Taiwan, comparing to the surface water supply, several major aquifers 30
provide the stable water resource, which accounts for over 30% of total amount of 31
water supply annually. However, the changes of groundwater level are the responses 32
of a complex interplay of a variety of natural and anthropogenic activities interacting 33
with the groundwater system. In addition, the prevalence of the heterogeneity in 34
subsurface environment and the lack of sufficient site characterization can 35
significantly hamper the understanding of space-time groundwater flow and transport 36
patterns, therefore, jeopardize the management of groundwater resources (Tartakovsky, 37
2007). Many studies about the changes of groundwater level often concentrate at the 38
changes induced by a specific driving force, such as natural and artificial recharges 39
from river or irrigation, pumping activities varying in space and time, and other 40
driving forces like earthquakes(Liu et al., 2004). Addition to extensive studies on the 41
impacts from specific activities by human or natural forces, it also requires the 42
systematic and integrative studies to obtain the macroscopic view of spatiotemporal 43
changes in hydraulic heads of the groundwater system of interest. For purposes of 44
groundwater management, it is essential to be knowledgeable about the major 45
ongoing underlying processes in space and time in the aquifer as well as the 46
magnitude of these processes that contribute to varying piezometric heads at specific 47
spatial and temporal locations. 48
In the groundwater monitoring investigations, the collected data may harbor 49
significant complex or extremely complicated variations in the observed values of 50
measurable characteristics of the groundwater level in time and space. Empirical 51
ACCEPTED MANUSCRIPT
Orthogonal Function (EOF) analysis is an effective method to extract information 52
from large datasets in time and space domains (North, 1984; Weare and Nasstrom, 53
1984; Kim and Wu, 1999; Hannachi et al., 2007; Munoz et al., 2008). EOF analysis 54
conducts to the decomposition of the covariance kernel on the set of its 55
eigen-functions. EOF analysis reduces the dimensions of a space-time random data 56
fields into a smaller set of new spatial random fields which can be fairly accurate to 57
reconstruct the space-time variances of the original random fields (Hannachi et al., 58
2007). Moreover, the purpose of the technique is to fit orthogonal functions to a set of 59
observed data, resulting in a reduction in the amount of data with minimal loss of 60
information while capturing the essential features (Munoz et al., 2008). Meteorology 61
has applied EOF analysis for decades to extract the most significant spatial signals of 62
atmospheric fields (Hannachi et al., 2007). Due to its advantage to obtain snapshots of 63
essential pure spatial and/or temporal patterns of a space-time dataset, many other 64
disciplines have recently applied EOF analysis in spatiotemporal analysis, such as 65
ozone distribution (Fiore et al., 2003), and ecological processes (Bejaoui et al., 2008). 66
For groundwater studies, EOF analysis was applied to extract significant temporal 67
signals from the Rhine Valley aquifer located in France and Germany (Longuevergne 68
et al., 2007), and was used to reduce the space-time variable to replace a large 69
groundwater numerical model by a comparable reduced model (McPhee and Yeh, 70
2008; Vermeulen et al., 2004). For environmental monitoring, Munoz et al. (2008) 71
considered Mid-Atlantic Stream Probabilistic Survey conducted from 1998 to 2002, 72
incorporated the spatio-temporal information in sampling designs, and illustrated how 73
to use the EOF model estimating at non-observed sites. 74
The study applied the EOF analysis to the case study in the Choshui River Fan 75
aquifer of Taiwan. The local farmers converted their crop lands into more profitable 76
ACCEPTED MANUSCRIPT
aquaculture ponds, owing to abundant and low cost groundwater resources. Due to the 77
lack of an effective groundwater management policy in Taiwan, heavy groundwater 78
usage by aquaculture activities has notoriously caused local land subsidence, 79
sea-water intrusion, and aquifer salinization (Hsu, 1998; Liu et al., 2003; Liu et al., 80
2006). Since 1992, the Water Resources Agency of Taiwan initiated a groundwater 81
monitoring network plan (GMNP) to systematically establish groundwater monitoring 82
wells with a spatial density of about 20km2/station throughout major aquifers in 83
Taiwan (Hsu, 1998), to gather essential information including groundwater quality 84
and level, as well as hydrogeologic characteristics of the aquifers. The evenly 85
distributed space-time observations collected by the GMNP consist of a valuable 86
database containing comprehensive information about spatiotemporal variation of 87
groundwater quality and levels induced by a variety of physical and chemical 88
processes. The database provides essential information for a myriad of hydrogeologic 89
researches in areas covered by the GMNP, including the study area. 90
This study used EOF analysis to obtain the most significant spatially distributed 91
processes (i.e. EOFs) and their associated temporal variation from space-time 92
groundwater observations from the Choshui River alluvial fan. Before EOF analysis, 93
the current work performed spatiotemporal interpolation by the Bayesian Maximum 94
Entropy (BME) method to generate evenly distributed space-time estimations to 95
minimize potential systematic biases from sampling. During the analysis, EOF 96
rotation played an important role to extract the most informative signals from the 97
observations. This study then identified and interpreted the leading driving forces in 98
groundwater level variation. 99
ACCEPTED MANUSCRIPT
Materials and Method 101
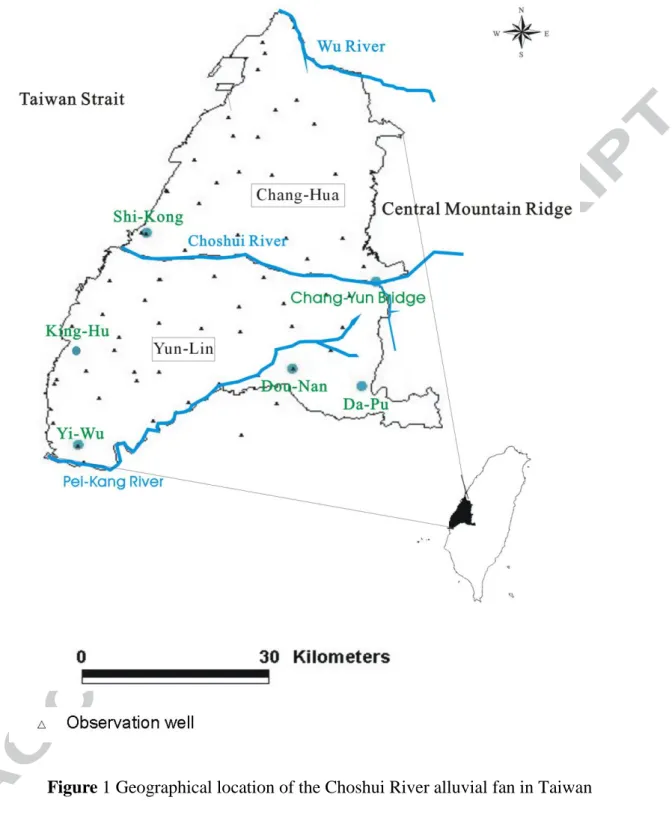
Study area 102
The Choshui River alluvial fan is located on the mid-western coast of Taiwan, and 103
covers the fertile plain area of 1800 km2 including counties of Yun-Lin, Chang-Hua, 104
and northern Chia-Yi, as Figure 1 shows. Across the Choshui River, the largest river 105
in Taiwan, the alluvial plain is surrounded by natural geographical boundaries of the 106
Taiwan Strait to the west, the Central Mountain Ridge to the east, the Wu River to the 107
north, and the Pei-Kang River as its southern border. Annual rainfall in this area is 108
around 2460 mm and 78 percent of precipitation occurs from May to October, i.e. 109
plum rain and typhoon seasons. The annual runoff in the Choshui River is about 6.08 110
billion tons (Chen and Lee, 2003). Because of insufficient surface water supply in the 111
alluvial fan, residents extract groundwater to supplement their demands irrigation, 112
aquaculture, and household, particularly in dry seasons. Among them, groundwater is 113
the major clean water supply for aquaculture ponds and therefore residents illegally 114
extract a great amount of water from aquifers into aquaculture ponds. The overdraft of 115
groundwater in agriculture and fish cultivation is causing serious land subsidence in 116
coastal areas (Yang and Yu, 2006). 117
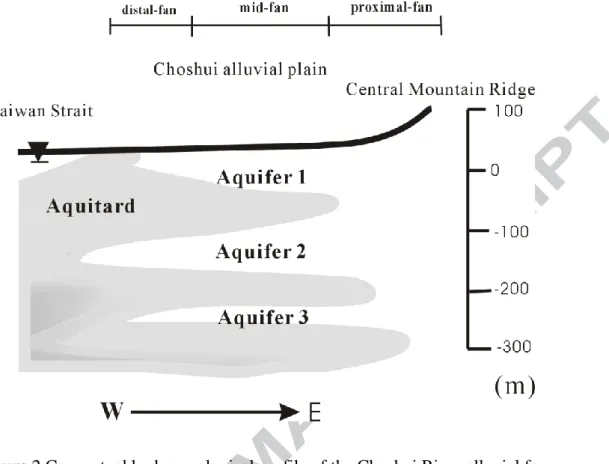
The Choshui River alluvial fan is partitioned primarily into proximal-fan, mid-fan and 118
distal-fan areas, according to their distinct hydrological formations. Figure 2 shows 119
the conceptual hydro-geological profile in the Choshui River alluvial fan. The 120
hydrogeological formation consists of three major aquifers, i.e. aquifer I, II, and III 121
numbered from the ground surface level, and separated by the aquitards, which are 122
low permeable with fine sediment, ranging from clay to fine sand. Considering 123
hydrogeological formation, the proximal-fan is the major recharge area of the aquifer 124
ACCEPTED MANUSCRIPT
(Jang et al., 2008; Jang and Liu, 2004). The aquitards located in the distal-fan and 125
mid-fan areas gradually diminish in thickness toward the east. Moreover, Aquifer II is 126
the major aquifer of the Choshui alluvial plain because of its large spatial extent and 127
acceptable depth for groundwater retrieval (Liu et al., 2004). Data derived from 128
pumping tests indicate that the observed hydraulic conductivity fields ranges from 129
10-3–10-5 m/s, and decreases from the proximal fan to the distal fan (Hsu, 1998; Jang 130
et al., 2008; Jang and Liu, 2004). Transmissivity ranges from 0.04–4.19 m2/min. The 131
storage coefficient is about 0.1 for the unconfined aquifer and ranges from 10-3–10-4 132
for the confined aquifer (Hsu, 1998). In this study, the dataset includes pizeometric 133
head observations of aquifer II obtained from sixty-six monitoring wells, evenly 134
distributed over the entire Choshui River alluvial fan. The study recorded the 135
observations monthly during the period from July 1997 to December 2001. 136
137
Method 138
The aim of EOF analysis is to decompose a continuous space-time random field 139
) , ( ts
X into the additive space-time multiplication form as follows 140 M k k k t u s c t s X 1 ) ( ) ( ) , ( (1) 141
where the vector ( ts, ) denotes the space-time location at time t and spatial position 142
s . M is the number of modes in orthogonal space-time random fields, i.e. 143
) ( ) (t u s
ck k . The modes are formulated as an optimal set of orthogonal spatial functions
144
(uk(s)), i.e. EOFs, and their associated expansion functions of time (ck(t)), i.e., the
145
projection of X( ts, ) on uk(s), also called EOF expansion coefficients (ECs). The 146
ACCEPTED MANUSCRIPT
concept of EOF analysis is essentially conventional principal component analysis 147
(PCA), which generates a smaller set of new random variables. The major leading 148
EOFs can usually explain the fairly amount of the observed variances of the original 149
space-time dataset, e.g. in this study, five EOFs can explain over 80% of the variances 150
of space-time groundwater head data as shown below. To consider the geometrical 151
relationship among the space-time dataset, not common in most PCA applications, 152
this work first interpolates space-time observations into regularly spaced grids over 153
the entire space-time domain. This mitigates data clustering effects, which can 154
contribute to excess variances of clustering locations, therefore distorting EOF 155
analysis results (Buell, 1971; Buell, 1978; Karl et al., 1982). This study uses the 156
Bayesian maximum entropy method (BME) to estimate the spatiotemporal 157
distribution of piezometric heads by accounting for spatiotemporal dependence, i.e. 158
covariance, as well as for observations considered as hard data in this case. For a more 159
detailed description of the BME method, the reader can refer to the literature 160
(Christakos, 2000; Christakos et al., 2002). 161
In EOF analysis, the head covariance over spatial domain finds the uncorrelated 162
spatial functions such that Cu 2u, where C is the covariance among the gridded 163
data in space, u (u1,...,up)T is the matrix that composes the eigenvectors uk
164
corresponding to eigenvalues ( k), and p is the number of space locations. Without
165
generality loss, the spatial (temporal) covariance (C) can be expressed as XXT
n
C 1
166
where X is a p n matrix containing space-time BME estimations of piezometric 167
heads with the number of observed time (n). The amount of observed head variance
168
explained by the eigenvector (uk) is the value of its associated eigenvalue ( k).
ACCEPTED MANUSCRIPT
In practice, the singular value decomposition (SVD) method is used for EOF analysis 170
(Hannachi et al., 2007). A p n matrix of space-time head estimations X( ts, ) can 171 decompose as 172 T A U X (2) 173
where U and A respectively p M and n M are the unitary matrix, i.e.
174
I A A U
UT T , in which the columns uk(s) are essentially EOFs as the spatial 175
orthonormal basis of the space-time data matrix. The diagonal matrix ( ) with 176
elements of 1 2 ... r are singular values of the matrix ofX( ts, ). Therefore, the
177
projections of EOFs ( ck ) are expressed as ck(t) kak(t) . The space-time 178
decomposition of Eq. (1) by EOF analysis can be rewritten as 179 M k k k ka t u s t s X 1 ) ( ) ( ) , ( (3) 180
One of the major challenges for EOF analysis is to interpret the estimated EOFs and 181
their associated projections which are orthogonal to each other but may not be 182
physically meaningful. The rotation of EOF patterns (REOF) can be one of the most 183
common approaches to overcome the interpretation issue (Hannachi et al., 2007). The 184
rotation concept systematically alters the original EOF structure based upon some 185
criterion, such as maximizing the explained variances of leading EOFs. Studies of 186
multivariate statistical analysis, e.g. factor analysis (Anderson, 2003) have proposed 187
and widely applied a variety of rotation algorithms. Among them, the Varimax method 188
is the most well-known and used rotation technique, by which an orthogonal matrix is 189
applied to EOF rotation to simplify the EOF structure, pushing the loading 190
coefficients of EOFs to either zeros or 1 (Kaiser, 1958). Determining the number 191
of modes, M, for space-time decomposition is also a major issue in EOF analysis. 192
ACCEPTED MANUSCRIPT
For reducing dimension, the value of M is always chosen to be much less than the 193
numbers of space-time dimensions of observations, i.e. n and p. However, the 194
general outcome of REOF analysis depends on the selection of M which can 195
complicate understanding of the underlying leading physical patterns of the 196
observations. To obtain the invariant leading REOFs, EOFs should be re-scaled 197
according to their associated eigenvalues before rotation. Rotating rescaled EOFs 198
generates invariant leading REOFs due to relatively little contributions from the 199
scaled EOFs of smaller eigenvalues (Hannachi et al., 2007). The current study 200
considers the varying piezometric head of the aquifer as the linear superposition of 201
several contributions from independent natural or anthropogenic processes 202
decomposed by REOF analysis. 203
204
Results 205
Spatiotemporal distribution of piezometric heads
206
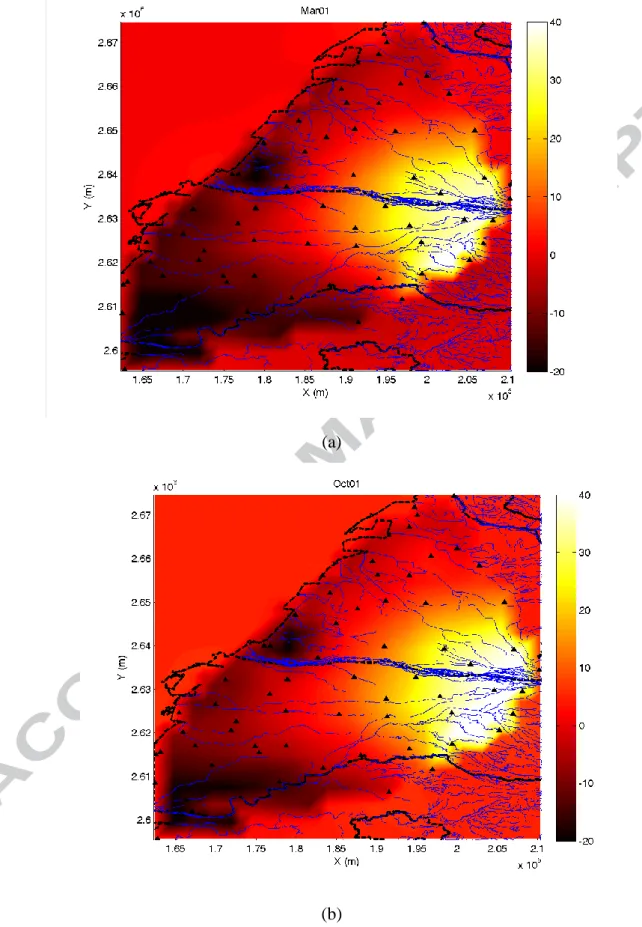
This research predicted monthly spatial distributions of piezometric heads of aquifer 207
II in the Choshui River alluvial fan by the BME method, accounting for the 208
spatiotemporal trend and covariance among the heads. Figure 3 shows the piezometric 209
heads results of two selected months and the triangles represent the monitoring wells. 210
The highest piezometric head is at the proximal-fan of the Choshui River alluvial fan 211
and the lowest is close to the southern coastal area i.e. Yi-Wu (Figure 3 (a) and (b)). 212
The hydraulic gradient from east to west is caused by topography changes in the 213
presented area significantly. The distribution of piezometric heads changes slightly 214
from month to month, primarily from obvious seasonal precipitation over the study 215
area, i.e. central Taiwan. The wet and dry seasons are from May to October and from 216
ACCEPTED MANUSCRIPT
November to April, respectively. Piezometric heads over the Choshui River alluvial 217
fan in March (Figure 3 (a)) and October (Figure 3 (b)) in 2001 represent the general 218
spatial distribution of the groundwater level during the dry and wet seasons, 219
respectively. The both figures show a slight difference in the piezometric heads 220
between the two seasons, especially in the coastal areas. 221
The EOFs in spatial domain and Time series of the ECs
222
Figure 4 shows total variance among the observed head data primarily explained by 223
the leading EOFs. Among them, the first five EOFs explain about 80 percent of the 224
observed spatiotemporal changes of heads with their contributions of 47.9%, 10.8%, 225
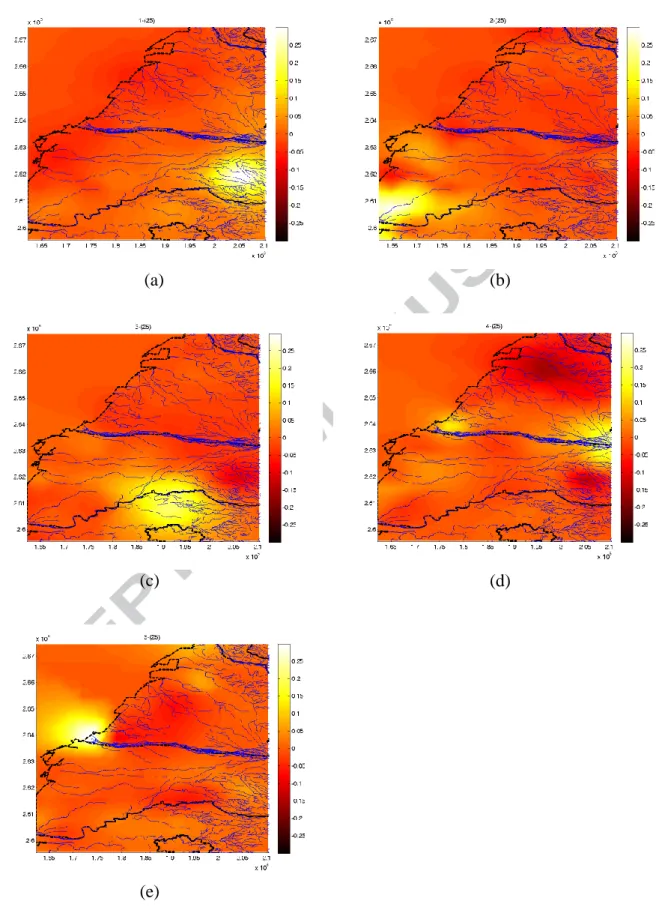
9.8%, and 6.9% and 4.7%, respectively. Figure 5 shows spatial distributions of the 226
first five EOFs. Each EOF has its distinct spatial pattern, which is generally localized. 227
Figure 6 shows the associated ECs (shown as the black line) during the study period 228
of the five EOFs. Equation (1) shows that jointly considering ECs and EOFs reveals 229
positive or negative contributions from each of the EOFs to piezometric head changes 230
in space and time. This study uses the bright areas (hotspot) of EOFs to represent 231
positive contributions to piezometric head changes. In EOF1, the brightness hotspot is 232
located upstream to the Choshui River, primarily in the Gu-Keng and Dou-Liu 233
townships, shown in Figure 5 (a). The EOF3 also shows a similar spatial pattern 234
where the brightness area is located upstream to the Pei-Kang River, shown in Figure 235
5 (c). As mentioned in previous studies (Jang et al., 2008; Jang and Liu, 2004), the 236
proximal-fan is a major recharge region for aquifers, due to its hydro-geological 237
formation being primarily composed of gravel and sand. Compared to rainfall 238
observations at the Da-Pu station located upstream to the Choshui River, Figure 6 (a) 239
shows that EC1 temporal variation highly associates with the hydrologic cycle in the 240
area, yet with about two or three months delay, the approximate time required for 241
ACCEPTED MANUSCRIPT
rainfall to percolate in the aquifer. The temporal pattern of EC1 implies that upstream 242
recharge from the Choshui River is the leading driving force causing spatiotemporal 243
changes of the aquifer. This study also observes a similar rainfall recharging pattern in 244
EC3 in which the trend varies closely to rainfall measurements at Dou-Nan, located 245
upstream to the Pei-Kang River, i.e. the brightness area of EOF3. 246
The EOF2 hotspot is near Yi-Wu and King-Hu, among the greatest land subsidence 247
locations (TPWCB, 1996; TPWCB, 1997), shown in Figure 5 (b). Because of heavy 248
aquaculture and irrigation demands over the entire township, illegal over-pumping 249
resulted in groundwater level decline (Akudago et al., 2009), therefore consolidating 250
soil layers (Liu et al., 2004). Cumulative land subsidence amounts from 1976 to 2000 251
obtained by a leveling survey at Yi-Wu and King-Hu (within the Ko-Hu township) 252
were 195 and 188 cm, respectively. The temporal pattern of EC2 closely corresponds 253
to the variation of measured piezometric heads at a monitoring well close to Yi-Wu, 254
shown in Figure 6 (b). The piezometric head falls during spring and summer, and 255
arises during the other seasons. During the high season of water usage, particularly 256
from March to July, local farmers extract groundwater for irrigation, fish cultivation 257
and household demands and result in the seasonal drawdown of groundwater levels. 258
Figure 6(e) also shows the EC5 time series and piezometric heads in the Shi-Kong 259
gauge. The EC5 increases with time. In fact, the groundwater level has begun to 260
rebound and the subsidence rate in Shi-Kong has declined (Liu et al., 2004). The 261
government has not allowed intensive groundwater use due to the industrial 262
development in the area since 1998. Moreover, the EOF4 hotspot is in the Choshui 263
River, shown in Figure 5(d). Figure 6 (d) shows the streamflow during the study 264
periods in the Chang-Yun Bridge gauge and the EC4 varies with the streamflow. The 265
EOF4 driving force is the exchange between the Choshui River and groundwater. 266
ACCEPTED MANUSCRIPT
Moreover, groundwater and surface water are not isolated components of the 267
hydrologic system, and interactions exist between ground water and surface water. 268
During flooding, the river recharges the aquifer. During the dry season, groundwater 269
flux drains into the stream, leading to increased stream flows (Sophocleous, 2002). 270
271
Discussion 272
Groundwater studies of the Choshui River alluvial fan have primarily focused on 273
issues driven by anthropogenic activities, such as land subsidence and its associated 274
impacts (Liu et al., 2004). An integrative study performed on the aquifers to identify 275
the major underlying processes of the groundwater system would be more helpful for 276
groundwater management. In this study, REOF analysis shows its effectiveness to 277
reveal, not only the leading driving forces of groundwater level changes in space and 278
time, but their interactions with the aquifer. The study by (Longuevergne et al., 2007), 279
also shows that EOF analysis reveals the primary characteristics at the Rhine Valley 280
aquifer (France and German). Both the study (Longuevergne et al., 2007) and our 281
study require an extensive groundwater monitoring network for the aquifer, i.e. 282
ninety-five and sixty-six monitoring wells for the Rhine Valley and Choshui aquifers, 283
respectively. Contrasted to the Rhine Valley study, our study performs spatiotemporal 284
interpolation of piezometric heads before EOF analysis to reduce the effects from 285
uneven spatial distribution of monitoring wells (Karl et al., 1982; Wikle and Cressie, 286
1999). The current study also shows that rotating EOFs effectively increases EOF 287
interpretability by generating more spatially localized and stable spatial patterns of 288
leading EOFs. 289
As shown in previous studies (Chen and Lee, 2003; Jang and Liu, 2004), recharges 290
ACCEPTED MANUSCRIPT
play an important role in Choshui river aquifer sources, especially in the proximal-fan 291
area, i.e. upstream to the Choshui and Pei-Kang rivers. In the proximal-fan area, the 292
logarithm of hydraulic conductivities are generally higher, about 4-5 ln(m/day), than 293
those in rest of the aquifer, about 1-3 ln(m/day) (Jang and Liu, 2004). One of the most 294
valuable features of REOF analysis to groundwater analysis is its ability to clearly 295
identify primary recharge areas for the aquifer. Identifying recharge areas is an 296
important step towards protecting regional groundwater resources (Braun et al., 2003). 297
The inappropriate use of these areas increases the risk of groundwater contamination. 298
Moreover, identifying the recharge source could be useful for managing aquifers to 299
meet increasing demand, and also help address environmental issues on effects of 300
water level decline (Acheampong and Hess, 2000). In this study, time series EC1 and 301
EC3 highly associate with rainfall measurements of local weather stations. The 302
comparison between temporal variations of ECs and rainfalls, and percolation time for 303
groundwater recharge depends on several hydrogeological factors, including hydraulic 304
conductivity and depth of the groundwater table (Gau et al., 2006). The amount of 305
recharges closely relates to the amounts of local rainfalls and stream flows. 306
Quantifying groundwater recharge is typically difficult because direct recharge input 307
to the water table is not easily measured, especially when the water table is several 308
meters below the land surface in an aquifer (Gburek and Folmar, 1999), due to the 309
absence of effective instrumentation. By different techniques, the estimations of 310
annual groundwater recharge in the mountain region of Choshui aquifer range from 311
3.1 to 3.5 billion tons (Chen and Lee, 2003; Gau and Liu, 2000). In the proximal fan 312
of the Choshui aquifer, percolation time for rainfall to reach the groundwater table is 313
about two to three months, similar to results of the aquifer study in the central coastal 314
plain (Israel) (Rimon et al., 2007). 315
ACCEPTED MANUSCRIPT
The study also identifies exchanges between the Choshui River flow and ground 316
water as the major contributing factor to changes in ground water level. The primary 317
contribution of the Choshui river flow is along the Choshui River, as expected. 318
Particularly, the most sensitive areas for river recharge are located upstream to the 319
Choshui River and the Pei-Kang River. The results also reveal interactions between 320
surface and subsurface water of the Choshui River. Changes in EC4 are much 321
smoother compared to streamflow changes. Moreover, temporal variation of flow rate 322
generally fluctuates significantly in response to rainfall. The changes in EC4 better 323
reflect the base flow temporal pattern of the Choshui River, which reacts slower than 324
the runoff to local rainfall changes. As a result, EC4 shares temporal characteristics 325
similar to EC1; however, with different magnitudes, i.e. EC1 is directly associated 326
with seasonal rainfall and EC4 is more connected to the flow pattern of Choshui River 327
which is closely related to rainfall. 328
As expected, this study identified pumping at several places in the coastal area, as 329
among the major contributing processes to piezometric head changes. In the area, the 330
soil consists mostly of clay and fine sand; the strength and the permeability of this soil 331
are relatively low (Liu et al., 2004). Furthermore, the Choshui River alluvial fan 332
includes the major aquaculture towns in Taiwan, and therefore extensive groundwater 333
demands are expected, because of insufficient surface water supply in these areas. 334
Illegal overpumping of groundwater has been prevalent in almost the entire coastal 335
area counties of Chang-Hua and Yun-Lin since 1950 due to a lack of ground water 336
management. The accumulated land subsidence due to unmanaged pumping activities 337
ranges from 50cm to 200cm along the coastline of the Choshui River alluvial fan (Liu 338
et al., 2004). This study identified two hotspots where pumping activities were still 339
active during the study period of 1997-2002, i.e. the piezometric heads still changed 340
ACCEPTED MANUSCRIPT
significantly. Among them, fortunately, the EC5 shows that unmanaged pumping 341
seems to be under control and the groundwater level in Shi-Kang gauge has started to 342
rebound consistently since mid-1998 at the hotspot area of EOF5. The Ko-Hu 343
township identified by EOF2 shows that the regular seasonal pattern of hydraulic 344
heads at its lowest time occurred in spring and summer every year during the study 345
period. The seasonal pattern is closely associated to the water demands for local 346
aquaculture ponds (Yang and Yu, 2006). 347
348
Conclusion 349
This study presented a macroscopic and integrative approach to investigate the 350
spatiotemporal changes of a groundwater system by REOF analysis. We analyzed the 351
monthly records of groundwater levels from 1997 to 2002 for sixty-six monitoring 352
wells operated by a water resources agency in Taiwan. This study shows that REOF 353
analysis can effectively capture stable and localized features, and gain easy 354
interpretation of EOFs. The current study identified five underlying processes as 355
major contributors to changing groundwater levels in the aquifers of Choshui River 356
alluvial fan, including recharges from rainfalls, stream flow and groundwater usage in 357
the coastal areas. These five leading EOFs drive the system changes, amounting to 358
about 80 percent of global variance for the entire groundwater system. More 359
specifically, the sensitive recharge areas are located upstream to the Choshui River 360
and the Pei-Kang River. This finding suggests a required groundwater management 361
policy in these places to ensure avoiding any potential contamination. Though land 362
subsidence is prevalent along the coastline of the Choshui River alluvial fan, the 363
locations with the most significant groundwater level changes are near the coastal area, 364
ACCEPTED MANUSCRIPT
i.e. townships of Ko-Hu (Yun-Lin county), and Da-Cheng (Chang-Hua county) in our 365
analysis. 366
This study shows the REOF analysis can effectively reveal the underlying space-time 367
processes of groundwater system. The REOF analysis results provide the integrative 368
view of interests in groundwater system and insights of major contributing factors to 369
the groundwater level changes in space and time, which are the essential information 370
for the effective management of a groundwater system. 371
372
Acknowledgement 373
This research is supported by grants from the National Science Council of Taiwan 374 (NSC97-2313-B-002-002-MY2 and NSC98-2625-M-002-012). 375 References 376 377
Acheampong, S.Y. and Hess, J.W., 2000. Origin of the shallow groundwater system in 378
the southern Voltaian Sedimentary Basin of Ghana: an isotopic approach. 379
Journal of Hydrology, 233(1-4): 37-53. 380
Akudago, J., Chegbeleh, L.P., Nishigaki, M., Nukunu, A.N., Ewusi, A. and 381
Kankam-Yeboah, K., 2009. Borehole drying: A review of the situation in the 382
Voltaian Hydrogeological System in Ghana. Journal of Water Resource
383
Protection, 3: 153-163. 384
Anderson, T.W., 2003. An introduction to multivariate statistical analysis. 385
Wiley-Interscience, Hoboken, N.J., 721 p. pp. 386
Bejaoui, B., Harzallah, A., Moussa, M., Chapelle, A. and Solidoro, C., 2008. Analysis of 387
hydrobiological pattern in the Bizerte lagoon (Tunisia). Estuarine Coastal and 388
Shelf Science, 80(1): 121-129. 389
Braun, G.M., Levine, N.S., Roberts, S.J. and Samel, A.N., 2003. A geographic 390
information systems methodology for the identification of groundwater 391
recharge areas in Waukesha County, Wisconsin. Environmental & Engineering 392
Geoscience, 9(3): 267-278. 393
Buell, C.E., 1971. Integral Equation Representation for Factor Analysis. Journal of the 394
Atmospheric Sciences, 28(8): 1502-&. 395
Buell, C.E., 1978. Number of Significant Proper Functions of 2-Dimensional Fields. 396
Journal of Applied Meteorology, 17(6): 717-722. 397
Chen, W.P. and Lee, C.H., 2003. Estimating ground-water recharge from streamflow 398
records. Environmental Geology, 44(3): 257-265. 399
Christakos, G., 2000. Modern spatiotemporal geostatistics. Oxford University Press, 400
Oxford ; New York, xvi, 288 p. pp. 401
ACCEPTED MANUSCRIPT
Christakos, G., Bogaert, P. and Serre, M.L., 2002. Temporal GIS: Advanced Functions 402
for Field-Based Applications. Springer-Verlag, New York, NY, 220 pp. 403
Fiore, A.M., Jacob, D.J., Mathur, R. and Martin, R.V., 2003. Application of empirical 404
orthogonal functions to evaluate ozone simulations with regional and global 405
models. Journal of Geophysical Research-Atmospheres, 108(D19): -. 406
Gau, H.S., Hsieh, C.Y. and Liu, C.W., 2006. Application of grey correlation method to 407
evaluate potential groundwater recharge sites. Stochastic Environmental 408
Research and Risk Assessment, 20(6): 407-421. 409
Gau, H.S. and Liu, C.W., 2000. Estimation of the effective precipitation recharge 410
coefficient in an unconfined aquifer using stochastic analysis. Hydrological 411
Processes, 14(4): 811-830. 412
Gburek, W.J. and Folmar, G.J., 1999. A ground water recharge field study: site 413
characterization and initial results. Hydrological Processes, 13(17): 2813-2831. 414
Hannachi, A., Jolliffe, I.T. and Stephenson, D.B., 2007. Empirical orthogonal functions 415
and related techniques in atmospheric science: A review. International 416
Journal of Climatology, 27(9): 1119-1152. 417
Hsu, S.K., 1998. Plan for a groundwater monitoring network in Taiwan. Hydrogeology 418
Journal, 6(3): 405-415. 419
Jang, C.S., Chen, S.K. and Ching-Chieh, L., 2008. Using multiple-variable indicator 420
kriging to assess groundwater quality for irrigation in the aquifers of the 421
Choushui River alluvial fan. Hydrological Processes, 22(22): 4477-4489. 422
Jang, C.S. and Liu, C.W., 2004. Geostatistical analysis and conditional simulation for 423
estimating the spatial variability of hydraulic conductivity in the Choushui 424
River alluvial fan, Taiwan. Hydrological Processes, 18(7): 1333-1350. 425
Kaiser, H.F., 1958. The Varimax Criterion for Analytic Rotation in Factor-Analysis. 426
Psychometrika, 23(3): 187-200. 427
Karl, T.R., Koscielny, A.J. and Diaz, H.F., 1982. Potential Errors in the Application of 428
Principal Component (Eigenvector) Analysis to Geophysical-Data. Journal of 429
Applied Meteorology, 21(8): 1183-1186. 430
Kim K.Y., Wu Q. 1999. A comparison study of EOF techniques: analysis of 431
nonstationary data with periodic statistics. American Meteorological Society, 432
12: 185–199. 433
Liu, C.H., Pan, Y.W., Liao, J.J., Huang, C.T. and Ouyang, S., 2004. Characterization of 434
land subsidence in the Choshui River alluvial fan, Taiwan. Environmental 435
Geology, 45(8): 1154-1166. 436
Liu, C.W., Lin, K.H., Chen, S.Z. and Jang, C.S., 2003. Aquifer salinization in the Yun-Lin 437
Coastal Area, Taiwan. Journal of the American Water Resources Association, 438
39(4): 817-827. 439
Liu, C.W., Lin, W.S. and Cheng, L.H., 2006. Estimation of land subsidence caused by 440
loss of smectite-interlayer water in shallow aquifer systems. Hydrogeology 441
Journal, 14(4): 508-525. 442
Longuevergne, L., Florsch, N. and Elsass, P., 2007. Extracting coherent regional 443
information from local measurements with Karhunen-Loeve transform: Case 444
study of an alluvial aquifer (Rhine valley, France and Germany). Water 445
Resources Research, 43(4): -. 446
McPhee, J. and Yeh, W.W.G., 2008. Groundwater management using model reduction 447
ACCEPTED MANUSCRIPT
Management-Asce, 134(2): 161-170. 449
Munoz, B., Lesser V. M. and Ramsey, F. L.., 2008. Design-based empirical orthogonal 450
function model for environmental monitoring data analysis, Environmetrics, 451
19: 805–817. 452
North G.R., 1984. Empirical orthogonal functions and normal modes. Journal of the 453
Atmospheric Sciences 41: 879–887. 454
Rimon, Y., Dahan, O., Nativ, R. and Geyer, S., 2007. Water percolation through the 455
deep vadose zone and groundwater recharge: Preliminary results based on a 456
new vadose zone monitoring system. Water Resources Research, 43(5). 457
Sophocleous, M., 2002. Interactions between groundwater and surface water: the 458
state of the science. Hydrogeology Journal, 10(1): 52-67. 459
Tartakovsky, D. M., 2007, Probabilistic risk analysis in subsurface hydrology, 460
Geophysical Research Letters, 34(5), L05404. 461
TPWCB, 1996. Project of investigation on land subsidence in the coastal area of 462
western Taiwan - investigation of land subsidence in the YunLin area (in 463
Chinese), Taiwan Provincial Water Conservancy Bureau, Taipei, Taiwan. 464
TPWCB, 1997. Project of investigation on land subsidence in the coastal area of 465
western Taiwan - investigation of land subsidence in ChangHua area (in 466
Chinese), Taiwan Provincial Water Conservancy Bureau, Taipei, Taiwan. 467
Vermeulen, P.T.M., Heemink, A.W. and Stroet, C.B.M.T., 2004. Reduced models for 468
linear groundwater flow models using empirical orthogonal functions. 469
Advances in Water Resources, 27(1): 57-69. 470
Weare B.C., Nasstrom J.S. 1982. Examples of extended empirical orthogonal function 471
analysis. Monthly Weather Review 110:481–485. 472
Wikle, C.K. and Cressie, N., 1999. A dimension-reduced approach to space-time 473
Kalman filtering. Biometrika, 86(4): 815-829. 474
Yang, T.C. and Yu, P.S., 2006. Application of fuzzy multi-objective function on reducing 475
groundwater demand for aquaculture in land-subsidence areas. Water 476
Resources Management, 20(3): 377-390. 477
478 479
ACCEPTED MANUSCRIPT
Figure Captions 480
Figure 1 Geographical location of the Choshui River alluvial fan in Taiwan 481
Figure 2 Conceptual hydro-geological profile of the Choshui River alluvial fan 482
Figure 3 The piezometric head (in meter) maps using BME on (a) March, 2001, and 483
(b) October, 2001 484
Figure 4 Variance percentage of rank of EOFs 485
Figure 5 The first five EOF interpolations (Unit: m) 486
Figure 6 Time series of the ECs (black line) and the hydrologic components: (a) 487
rainfall distribution in Da-Pu (b) piezometric head distribution in Yi-Wu (c) rainfall 488
distribution in Dou-Nan (d) streamflow distribution in Chang-Yun Bridge (e) 489
piezometric head distribution in Shi-Kang 490
ACCEPTED MANUSCRIPT
ACCEPTED MANUSCRIPT
ACCEPTED MANUSCRIPT
(a)
(b)
Figure 3 The piezometric head (in meter) maps using BME on (a) March, 2001, and (b) October, 2001
ACCEPTED MANUSCRIPT
ACCEPTED MANUSCRIPT
(a) (b)
(c) (d)
(e)
ACCEPTED MANUSCRIPT
Figure 6 Time series of the ECs (black line) and the hydrologic components: (a) rainfall distribution in Da-Pu (b) piezometric head distribution in Yi-Wu (c) rainfall distribution in Dou-Nan (d) streamflow distribution in Chang-Yun Bridge (e) piezometric head distribution in Shi-Kang