EPSL
ELSENIER
Earth and Planetary Science Letters 146 (1997) 59-72Deep sea and lake records of the Southeast Asian paleomonsoons
for the last 25 thousand years
Chi-Yue Huang a**, Ping-Mei Liew a, Meixun Zhao b, Tzu-Chun Chang a,
Chao-Ming Kuo a, Min-Te Chen ‘, Chung-Ho Wang d, Lian-Fu Zheng e
’ Department of Geologv. National Taiwan University, 24.5. Choushan Road. Taipei, IO7 Taiwan, ROC h Department of Earth Sciences, Dartmouth College, Hanover, NH 03755, USA
’ Institute of Applied Geophysics, National Taiwan Ocean Unicersity. Keelung, Taiwan, ROC ’ Institute of Earth Sciences, Academia Sinica, Nankang, Taipei, Taiwan, ROC
’ Second Institute of Oceanography, State Oceanic Administration, Hanghou 31lWl2. People’s Republic of China Received 4 March 1996; revised IO October 1996; accepted 12 October 1996
Abstract
High resolution paleoceanographic proxy records from a deep-sea core in the northern South China Sea (SCS) and palynological records from a lake core in central Taiwan have been measured for the last 25 kyr. The variations in these proxy records are interpreted in terms of the past variation in the Asian monsoons. The two consistent and complementary records suggest that the East Asian monsoon system has fluctuated significantly from a strengthened winter monsoon during the last glaciation (2.5,000-12,000 yr BP) through a moderate to weak winter and summer monsoons during the deglaciation (12,000-10,000 yr BP) to an enhanced summer monsoon in the Holocene. Strengthening of the winter monsoon during the glacial is deduced from decreases in winter SST and increases in productivity indicators, such the abundances of alkenones and total organic carbon in the SCS. A stronger summer monsoon during the Holocene is inferred from the increases in floral productivity, the sedimentation rate of peat, the deposition of storm-related clay layers in the lake sediment, and the higher abundance of thermophyte Castanopsis. The 25 kyr paleomonsoon history registered in the SCS core and the Taiwan lake sediments is in agreement with the climatic records of the Chinese Loess plateau.
Kexw0rd.r: Southeast Asia; monsoons; South China Sea; Taiwan
1. Introduction
Generally speaking, monsoon systems are driven by the differential heating between the continent and the adjacent oceans [1,2]. Due to their importance in modulating regional weather and climate, many in- vestigations have been carried out to document the
* Corresponding author. Tel: + 886 2 363 35 14. Fax: + 886 2 363 6095. E-mail: huangcy@ccms.ntu.edu.tw
variations in the monsoon climate during glacial/in- terglacial cycles [l-4]. The East Asia Monsoon is characterized by the seasonal changes in air pres- sures, wind systems, rainfall and temperature gradi- ent over East and Southeast Asia [5]. Unlike the Southwest Asian monsoon which is characterized by a strong summer monsoon [1,3,6,7], the East Asia Monsoon is characterized by both summer and win- ter monsoons [2,5]. Their influence on the regional climates extends from Northern China to the South
0012-821X/97/$12.00 Copyright 0 1997 Elsevier Science B.V. All rights reserved. PII SOO12-82 I X(96)00203-8
60 C.-Y. Hung et al./ Earth and Planetar?, Science Letters 146 (1997) 59-72
(a)
Continent of Ash
Table 1
C.-Y. Huang et al. / Earth and Planetary Science Letters 146 (1997) 59-72 61
Distribution of vegetation zones in central Taiwan [17]
Vegetation zone Elevation
(m) Mean temperature (“C) Climatic zone Alpine vegetation Albies Zone Tsuga-Picea Zone Quercus (Upper) Zone a Quercus (Lower) Zone a Machilus-Castanopsis Zone Ficus-Machilus Zone > 3600 3 100-3600 2500-3 100 2ooo-2500 1500-2000 500-1500 <500 <5 5-8 8-11 S-14 14-17 17-23 > 23 Subarctic Cold temperate Cool temperate Temperate Warm temperate Subtropical Trouical
’ On the leeward side, Quercus Zone is replaced by Abuts Zone at the same altitude. The Quercus Zone is characterized by the occurrence of Cyclobalanopsis and Quercus.
China Sea throughout the calendar year. Previous
reconstructions of the East Asian paleomonsoon his-
tory have focused on the variability of the monsoons
[2,4,8,9] using proxies preserved in the loess-paleo-
sol sequences in central China. These studies have
generally concluded that the winter monsoon was
strengthened during the last glacial period. In con-
trast, there has been little attention to the East Asian
paleomonsoon signals recorded in the deep-sea cores
off the Chinese coast, especially in the SCS [lo].
Here we report high resolution paleoceanographic
data from a deep-sea core in the northern SCS and
palynological data from a lake core in central Tai-
wan to reconstruct the summer and winter Asian
monsoon variations in the tropical regions for the
last 25 kyr.
The South China Sea (5-22”N, 1 IO-120”E; Fig.
la) is a semi-closed Asian marginal sea. High sedi-
mentation rates along its northern slope (8-20
cm/kyr)
provide good records for high resolution
paleoceanographic and paleoclimatic reconstructions
[I I- 141. At present, the surface water circulation and
sea surface temperature (SST) of the SCS are gener-
ally controlled by the monsoon climate [ 151. During
the winter, the dominant influence of the cold and
dry northeasterly monsoon winds, together with the
southward flow of the cold Chinese Coastal Waters
(CCW) result in low SST in the northern SCS and a
north-south gradient (Fig. lb). During the summer,
by contrast, the warm southwesterly monsoon winds
and the warm Indian surface waters flow northeast-
ward into the southern SCS through the Sunda Shelf.
The resulting SST is relatively high and homoge-
neous all over the SCS (28-29”C, Fig. lb) [15-171.
During the last glaciation, the lowering of sea-level
exposed the present-day shallow water gates between
the SCS and the open ocean except for the Bashi
Strait (sill depth: 2500 m; Fig. la). Thus the SCS
was more isolated and the surface circulation and
biological productivity could have been quite differ-
ent
[10-141. For example, the lowering of sea-level
by approximately 120 m during the LCIM could have
inhibited the entry of cold CCW into the SCS through
the Taiwan Strait (< 70 m in depth) (Fig. la). Thus,
the main mechanism of lowering the winter SST in
the northern SCS during the last glaciation would be
the cold winds resulting from the northeast winter
monsoon.
Temperature and precipitation in central Taiwan
are heavily influenced by the oscillations of the
monsoon systems
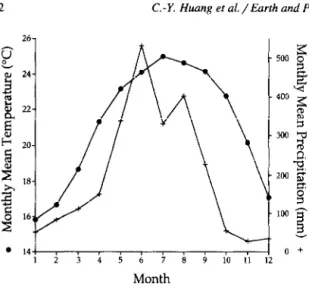
[181. More than 70% of the annual
rainfall (2000-2500 mm/yr) occurs during the warm
season from June to August when the summer mon-
soon prevails (Fig. 2). In contrast, when the winter
monsoon prevails, from October to April, the climate
is cold and dry. Due to the steep slope and high
elevation of the mountain range (up to 4000 m), a
variety of floral assemblages can be found in Tai-
Fig. 1. Physiographic map of the South China Sea showing (a) locations of deep-sea core SO50-31KL and Toushe Lake core in central Taiwan, directions of the Chinese Coastal Waters (CCW) into the northern SCS during the winter season, (b) summer and winter sea surface temperature, and the summer and winter surface water circulations [49,16].
62 C.-Y. Humg et al. / Earth and Planetary Science Letters 146 (1997) 59-72 26- e - 500 0 z ij f 24 22- - 400 ‘, 2: z w i? - F- 300 CJ zo- ti 2 0. ! 1% T. - 200 c 3 g ti - 100 - z 161 . i . 14-1 , , , , I , , I , , 0 + 1 2 3 4 5 6 7 8 9 10 ,I 12 Month
Fig. 2. The 30 year average mean monthly temperature (0) and precipitation (+) for the Toushe region (23”52’N, 120”54’E, elevation 650 m) in central Taiwan.
wan, ranging from the tropical to the subarctic. Seven vegetation zones have been recognized and are listed in Table 1 [19]. During the latest Pleis- tocene these floral zones migrated up and down in accordance with the global glacial-interglacial cli- matic fluctuations [20-221. The present-day vegeta- tion in the Toushe area (650 m in elevation) in central Taiwan belongs to the Much&s-Custanopsis Zone (elevation 1500-500 m; temperature range 17- 23°C; Table 1). The Toushe Basin is a desiccated dry lake (1 x 1.88 km) formed by strike-slip faulting in the late Quaternary [23]. The lake is filled with more than 40 m of peat, in the central part of which the upper 14.7 m sequence represents the last 25.2 kyr.
2. Core sites and study methods
2.1. Deep-sea core
Core SO50-31KL was drilled in the northern SCS in 1987 (18”45.3’N, 115”52.39’E, water depth 3360 ml. The age model of this core has been established by accelerator mass spectrometry CAMS) 14C dating of mixed planktonic foraminifera and the foraminifera oxygen isotope stratigraphy. No visible turbidite lay- ers were found in the core which is also supported by the normal sequence of the AMS 14C dates. The sedimentation rate is 15 cm/kyr for the glacial and 7 cm/kyr for the Holocene (Fig. 3). The increase in
glacial sedimentation rate could be due to a low-stand of level [l 11 and, presumably, also an increase in eolian flux by an enhanced winter monsoon.
The sampling interval was 2 cm, corresponding to 200-400 yr in the Holocene and loo-150 yr in the last glaciation. Oxygen isotopes of the planktonic foraminifera G. sacculifer (> 350 p,m) were deter- mined using a VG SIRA 10 isotope ratio mass spectrometer with a precision of 0.08%0 (+ 1 a). Core SO50-31KL is located near the present-day CCD (3500 m) [24] and there is a high probability of carbonate dissolution in this core. Foraminifera-based SST estimation could not be easily applied to this core. Hence, we have used the U$ method [25,26] to estimate sea surface temperatures (SSTs) for the last 25 kyr. Long-chain unsaturated ketones (alkenones) were extracted from the sediments using organic solvent and determined by gas chromatography in the Organic Geochemistry Laboratory of the Univer- sity of Bristol, UK [27]. The temperature was calcu- lated using the calibration equation of Prahl et al. [28]:
SST (“C) = (II;; - 0.039)/0.034 where U,“; = C37:2/@37:2 + C37:J.
Mass accumulation rates (MAR) of alkenones, total organic carbon and carbonate were calculated
ray)
Sedimentation Rate
As (kyr)
Fig. 3. Composite plot of depth vs. age for the deep-sea core S050-31KL and Toushe lake core. Ages were determined by “C dating of foraminifera and peat and corrected by 400 yr. For the deep-sea core the sedimentation rates were higher in the glacial, due to the wide exposure of continental shelf in the northern SCS, while the sedimentation rates of the lake core were lower during the last glacial, due to the low floral diversity and productivity under the cold and dry climate.
C.-Y. Huang et al./Eanh and Planetary Science Letters 146 (1997) 59-72 63 using concentration and sedimentation rate data to
estimate paleoproductivity [29].
2.2. Toushe Lake sediment
A 40 m long peat sequence from Toushe Lake (23”49’N, 120”53’E, elevation 650 m) in central Taiwan (Fig. 1 a) was recovered in 1993. The age model of the lake core were determined by both conventional and AMS 14C dating of the peat (Table 2; Fig. 3). The first 16.9 m of this lake core can be divided into two sections based on sedimentation rate. The first interval (30-941 cm, or 2000- 12,500 yr BP) has a constant and higher sedimentation rate of 87 cm/kyr. The second interval (941-1690 cm, or 12,500-29,000 yr BP) also has a constant, but lower sedimentation rate of 43 cm/kyr. At least 500 grains of the pollen in each sample were identified. In some herb-predominant samples, more than 100 grains of woody plant pollen were counted.
The interpretation of pollen taxa to paleoecologi- cal condition was based largely on studies of the ecology and altitude distributions of modern plants
Table 2
List of dated samples from Toushe lake sediments and marine core SO50-3 1KL
Toushe Lake Core
Depth Age
(cm) (yr BP)
Deep-sea core SO50-3 1 KL
Depth Age (cm)
(yr BP)
30-40 184Ort50 80-90 2230 + 50 172-182 4230 + 50 310-320 5640560 420-430 6480 * 60 413-483 7370 f 60 535-545 8270 + 70 610-620 87X0*60 705-707 9600*130= 700-7 10 9720 f 60 787-796 10,450 f 70 86 I-870 12.100*90 930-941 12,350 f 90 1177-1187 18,130& 160 1587-1597 28,0001250 16X0-1690 29,300 * 300 4-6 1790* 100 34-36 6063 f 89 40-42 7400+ 120 80-82 11.080+87 132-134 14,780&210 272-274 2 1,990 f 250 300-302 24,600 f 280Dating was performed by the AMS 14C method for the marine sediments and the conventional 14C method for the lake sedi- ments.
a This sample was also dated by the AMS 14C method.
in the mountain range of Taiwan [19]. The sampling interval for the palynological study is 10 cm, which corresponds approximately to 240 year intervals in the last glaciation and 120 year intervals in the Holocene. Pollen percentages of four tree taxa (Al- nus, Cyclobalnopsis, Quercus and Castanopsis) and three herbs ( Artemisia, Cyperaceae and Gramineae) were determined to be ecologically significant and provide palynological insight in the lake core.
3.
Results and discussions
3. I.
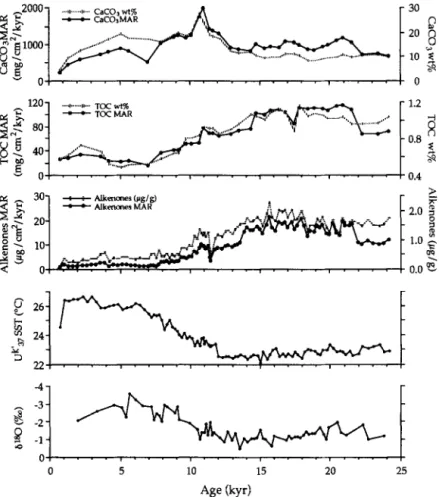
Paleomonsoon records in the SCS coreThe core
SO50-3
1 KL II,“; SST curve parallels the oxygen isotopic curve recorded by Globigerinoides sacculifer (Fig. 4). It shows a glacial/interglacial difference of 4°C. The SST minimum is centered around the LGM, with a value of 22.5”C (Fig. 4). The SST increased sharply around 12,000 yr BP and reached 26.2”C around the Holocene Optimum at 6000 yr BP and to 26.5”C at 2000 yr BP. It has been suggested that the U$ index normally records the SST of the season of maximum coccolithophorids production [30-341. However, core-top U37k’ values often correlate well with average annual SST, sug- gesting no significant seasonal bias of alkenones in recording surface temperatures 135,361. In the mod- em northern SCS, the marine productivity maximum occurs from early winter to early spring when the winter monsoon prevails [37]. However, the late Holocene IJt; SST value of 26°C is almost the same as the present annual mean SST for this location, indicating the U,“; index also records the annual SST in the SCS. Several studies have indicated that the summer SST in the SCS has remained relatively constant over the last 30 kyr [ 10,11,14]. Thus, any significant change in the annual SST as recorded by the U,“; index is probably a result of the change in the winter SST. A simple exercise will indicate that the glacial/interglacial changes in winter SST is larger than the annual (the U3k;) SST changes.If we define Ts as the summer SST, Tw as the winter SST and Ta as the annual SST at a given time; Ta = (Ts + Tw)/2 = U,” SST. We also define STx as the difference in TX for the late Holocene
64 C.-Y. Huang et aL/Earth and Planetary Science Letters 146 (1997) 59-72
minus the TX at a given time, where x could be s, w
or a. Hence 6 Ta = (S Ts + STw)/2. If we assume
S Ts is zero, then, S Tw = 6 2Ta. Thus, as a first-order
approximation, the maximum glacial/interglacial Tw
difference should be 8”C, since 6Ta is 4°C based on
I_J,k;
SST measurements. If 6Ts is 2°C then 6Tw
would be 6°C. This glacial/interglacial
SST differ-
ence of 6-8°C is comparable with the recent transfer
function estimates
[11,141. We admit that this calcu-
lation is too simplistic, however, it does illustrate
two very important aspects of the glacial/intergla-
cial changes in winter SST. Firstly, since summer
SST has remained relatively constant over the last 25
kyr, changes in the U,k SST mainly reflected changes
in the winter SST. Hence the winter SST profile
should be very similar to the U,k; SST profile. Sec-
ondly, the glacial/interglacial
difference in winter
SST is larger than the U3”; SST difference. Using
these assumptions, we will take the U,” SST profile
as a proxy for the winter SST trend only, not the
absolute value. As we have argued in the introduc-
tion section, the lowering of sea-level by approxi-
mately 120 m during the LGM could have cut off the
entry of cold CCW into the SCS through the Taiwan
Strait. Hence, the northeast winter monsoon would
be the main mechanism of cooling the SCS during
the winter season. We further propose that changes
in the U,“;’ SST can be used to monitor the relative
intensity of the winter monsoon in the northern SCS.
Based on these assumptions, the paleo-winter mon-
soon intensity can be divided into three modes based
on the SST record: (1) lower SST for the period of
“,.._.,....,....,....,... ,
0 5 10 15 20 25
Age Gyr)
Fig. 4. Paleoceanographic proxies of the South China Sea SO50-31 KL during the last 25 kyr: CaCO, (wt% and MAR - Mass Accumulation Rate), TOC (wt% and MAR), alkenones (abundance and MAR). @i-derived Sea Surface Temperature (SST), and oxygen
C.-Y. Huang et al. /Earth and Planetar?, Science Letters 146 11997) 59-72 65 25,000-12,000 yr BP indicates a stronger winter
monsoon in the last glaciation; (2) an increase in the SST from 12,000 to 6000 yr BP reflects a decrease in the winter monsoon intensity during the deglacia- tion and the early Holocene; and (3) higher SST since 6000 yr BP suggests an even weaker winter monsoon in the late Holocene.
Concentration and mass accumulation rates (MARS) of TOC and alkenones have almost an inverse relationship with the SST profile (Fig. 4). They were higher during the glacial period and lower in the Holocene. The decrease started at the begin- ning of the deglaciation stage. The content of this biogenic component in the sediments is an end-prod- uct of their surface production and sedimentary preservation. In order to use TOC and alkenones as productivity indicators, it is imperative to demon- strate that the TOC and alkenones are primarily of marine origin and that their content variations are not determined by the preservation factor. Thunell et al. [12] and Huang et al. [lo] have argued that variations in TOC in the SCS sediments mainly reflect changes in their surface productivity. The similarity of the TOC and alkenones profiles in core SO50-3 1KL further demonstrates that the TOC is mainly derived from marine productivity, since alkenones are only produced by the marine algae prymnesiophytciae. Thus, the core SO50-3 1KL TOC and alkenones records indicate that the productivity level was higher during the glacial period than that of the Holocene. Several processes could have contributed to this glacial increase in surface productivity, such as a local upwelling, changes in the oceanic circulation pattern to favor nutrient-trapping in the SCS, the deepening of the mixed-layer for more efficient nu- trient recycling and increased nutrient supply from terrigenous sources. Based on multi-proxy analyses of a nearby core SCS90-36, Huang et al. [lo] con- cluded that the most likely cause of the increases in glacial productivity in the SCS is the deepening of the surface layer. This conclusion is consistent with the winter monsoon history inferred from the SST record above. The increases in the winter monsoon strength would not only cause a decrease in SST, but also the deepening of the mixed layer to enhance productivity to cause the increases in the TOC and alkenone content. During the deglaciation stage, the winter monsoon began to relax, SST started to in-
crease and productivity was on the decrease. During the Holocene, a weaker winter monsoon is responsi- ble for the higher SST and lower productivity.
The carbonate content and MAR do not show a clear glacial/interglacial trend (Fig. 4). On average, glacial carbonate content is only slightly higher than that of the Holocene. The carbonate maximum is around 11 ka, coeval with the YD time. Because the core site is above the CCD but below the lysocline, carbonate dissolution plays an important role in de- termining the carbonate profile [14,24,38]. The peak during the YD time is puzzling since we did not observe significant increases in marine productivity. It probably suggests an increased preservation during the deglaciation, but further studies and more records are needed to address this question.
3.2. Paleomonsoon record from Toushe Lake
Previous paleoceanographic studies have already shown that the SCS summer SST has remained relatively constant over the last the last 25 kyr [I 1,14,38]. This may seem to suggest that the sum- mer monsoon intensity may not have changed much over this period. However, oceanic proxies such as SST are not sensitive indicators of the summer mon- soon. We thus present palynological results from the Toushe lake, central Taiwan, to provide complemen- tary records of the paleo-monsoons, especially the summer monsoon (Fig. 5).
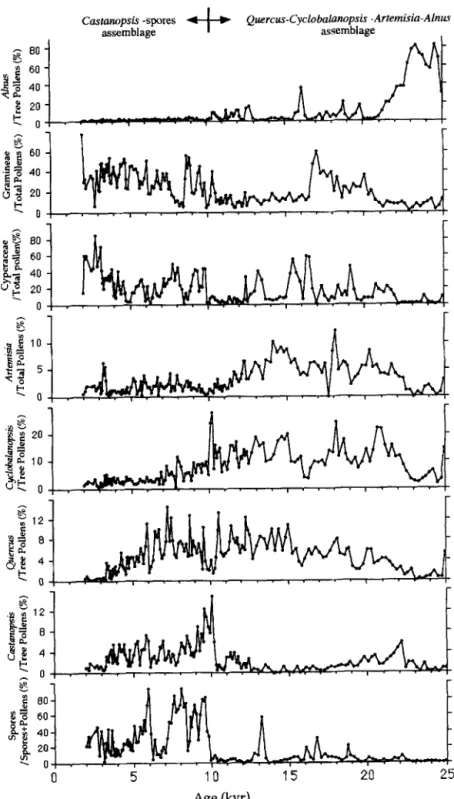
During the last glaciation, the pollen assemblages were sequentially dominated by xerophyte Alnus (20-80% of the tree pollen from 25,000 to 21,000 yr BP), herbs Gramineae (20-60% of the total pollen from 20,500 to 16,500 yr BP) and Cyperaceae (20- 40% of the total pollen from 16,500 to 15,000 yr BP). Other important but less dominating species were trees Salix, Ilex and Symplocos (each less than 15% of the tree pollen, not shown here) and herbs Artemisia (7-12% of total pollen) from 25,000 to
12,000 yr BP. Spore was almost absent in the last glaciation. Alnus is usually abundant as a pioneer plant in a newly developed forest community and also is rich on the dry/cool leeward sides of moun- tains of 1500-2500 m. Xerophytic Gramineae and Cyperacea without ferns commonly occur in high montane (> 2500 m) open grass and shrubland in central Taiwan [19]. Two montane evergreen broad-
66 C.-Y. Huang et al. / Earth and Planetary Science Letters I46 (1997) 59-72 Cawmopsis -spores +I+ Quercudyclobalanopsis -Artemisia-Ahur assemblage assemblage A.-Lh I- 5 ID 15 20 25 Age (kyd
Fig. 5. Characteristic palynological composition from the Toushe Lake,central Taiwan, showing a floral change from the Quercus-Cycle balanopsis-Arremisia-Alnus assemblage in the last glaciation to the Castanopsis-spores assemblage in the Holocene.
C.-Y. Huang et al. /Earth and Planetary Science Letters 146 (1997) 59-72 67 leaved plants Cyclobalanopsis
and
Quercus werecommonly observed in the last glacial interval. Cy- clobalanopsis, the characteristic genus in the present- day Quercus Zone, was more abundant during the last glacial than in the Holocene, while the abun- dance of Quercus was high from 19,000 to 6000 yr BP.
The Holocene pollen assemblage is dominated by the open herbaceous vegetation of Cyperaceae and Gramineae with ferns. The percentage of the thermo- phyte Castanopsis reached 14% during the early Holocene. Castanopsis is often the main species of the submontane evergreen broad-leaved forests. In the subtropical warm and humid climate of the low- land central Taiwan ( < 1500 m), it is the dominating wooden element. The percentage of trilete and mono- lete spores increased sharply at the beginning of the Holocene and stayed high over the last 10,000 yr. Spores are common among warm and humid sub- tropical forests. Their abundance typically increases with increases in temperature and rainfall.
The palynological data show a remarkable floral change from the Quercus-Cyclobalanopsis- Artemisia-Alnus assemblage in the last glacial to the Castanopsis-spores assemblage in the Holocene (Fig. 5). The glacial vegetation of the Toushe lake region (elevation 650 m) is analogous to the flora of the present-day Quercus Zone (elevation 1500-2500 and mean temperature range of 8-17°C) of montane evergreen broad-leaved forest, or its counterpart, the Alnus Zone of deciduous forest on the leeward side, within the warm temperate to temperate climatic Zone of central Taiwan (Table 1). By contrast, the Holocene vegetation is similar to the flora of the present-day Machilus-Castanopsis vegetation Zone (elevation 500-1500 m and mean temperature range of 17-23°C). This is the submontane evergreen broad-leaved forest of the subtropical climatic Zone in the lowland of central Taiwan, The change of pollen assemblages over the last 25,000 yr suggests that the climate of the Toushe region has changed from a cooler and drier warm temperate/temperate regime in the glacial to a warmer and more humid subtropical regime in the Holocene. We estimated that the flora were displaced by at least 850 m elevation during the last glacial period, implying a decrease of 5.1”C in annual temperature assuming a 0.6”C/ 100 m lapse rate [ 181. The estimated tempera-
6 4 8 5 x 6 b E 10 m 3 g 8 12 10 14 16 12 18 20 22 14 24 26
Fig. 6. Weight loss on ignition of samples from Toushe Lake, central Taiwan. The clay layers with values of weight loss on ignition < 50% were deposited by the heavy rain of the strong summer monsoon or by storms in the summer. The more frequent occurrence of these clay layers in the Holocene than that of the glacial period may have reflected a wetter summer. caused by a stronger summer monsoon.
ture decrease between the last glaciation and the Holocene in the Toushe Lake, central Taiwan, is slightly larger but comparable with that of the SCS estimated using the U$ and foraminifera transfer function methods [ 11,141.
The Toushe Lake core is composed of peat in- terbedded with thin layers of clay (each layer is about 2-4 cm thick, Fig. 6). Variations in the sedi- mentation rate and the occurrence frequency of the clay layers are thought to be controlled by monsoon-dominated climate changes. The sedimen- tation rate in the peat sequence increased from an average value of 43.4 cm/kyr before 12,000 yr BP to 86.17 cm/kyr (Fig. 3) in the Holocene. Diagene- sis could have compacted the deeper part of the core and reduced its apparent sedimentation rate. If this is the case, we would expect a gradual change in sedimentation rate. The sharp change in sedimenta- tion rate seems to suggest that compaction was not responsible for the sedimentation rate difference be- tween the upper and deeper parts of the core. The lower value during the last glacial period may have
68 C.-Y. Huang et at. /Earth and Planetary Science Letters 146 (1997) 59-72
reflected low floral diversity and productivity under
the dry conditions. On the other hand, the increase in
lake sedimentation rate during the Holocene may
indicate an increase in productivity under the warm
and humid conditions, due to a strengthening of the
summer monsoon after 12,000 yr BP. The unusual
occurrence of the clay layers interbedded in the peat
sequence, as represented by low values (< 50%) in
the weight loss on ignition (WLOI) curve (Fig. 61,
may have resulted from the deposition of eroded
elastics by heavy rains, which usually occur in the
modem summer season. The frequency of the clay
layers has gradually increased from 0.38 layer/kyr
in the last glacial to 0.5 layer/kyr
during the
deglaciation, and to 0.75 layer/kyr in the Holocene.
This increase may also reflect a gradual increase in
the strength of the summer monsoon or, altema-
tively, an increasing frequency of summer tropical
storms.
To summarize the lake evidence, the Asian mon-
soon has experienced three modes: (1) the frequent
occurrence of xerophyte and the displacement of the
floral zone from 25,000 to 12,000 yr BP suggests a
weak summer monsoon and a strong winter mon-
soon; (2) the abrupt increase in sedimentation rate
and rain-related clay layers with the occurrence of
the rare thermophyte from 12,000 to 10,000 yr BP
indicates a shift to a weak/moderate summer mon-
soon during the deglaciation; and (3) a sharp in-
crease in thermophyte combined with the high sedi-
mentation rates since 10,000 yr BP reveals a stronger
summer monsoon since the early Holocene. How-
ever, the fluctuations in the warm and humid pollen
and spores in the Holocene indicate that the inter-
glacial mode of the climate has not been stable for
the last 10,000 yr.
4. General discussion and comparison with other
records
In our interpretation, the SCS paleoceanographic
proxies reflect mainly the winter monsoon variabil-
ity, while the lake palynological data record fluctua-
tions of both summer and winter monsoons. The
major conclusions regarding the monsoon history are
0
Age(yrs B.P.) L 6,000 I 10,ooo I 12,ow I 25,wo
South
weak highChina
-k
Sea
low weak to moderate -=sagrnlrillIl~) gradual decrease moderate . . ..rirt*rtttttl~lllgradual increase low high Low High
Taiwan
sbundent stronToushe m
weak wnmm monsoon Rareweak summer monsoon Low
Lake
niOn
weak summer monsoonhigh gradual decrease Low
I I I I
VZI
Y;g
lntearation
Wesk winter monsoon Whlt&U monsoon---o- -~~~
and
- strong summer moneoon moderate - wwk toConclusion
monsoon - strong sununsr summerStrong winter monsoon -weak summer monsoon
_ _~._.__~_
monsoon monsoon
Fig. 7. An integrated monsoon history inferred from the proxy records in the South China Sea and Toushe Lake cores for the last 25,000 yr. The marine and lake records are complementary, with the marine records providing more positive evidence of the winter monsoon intensity and the lake records supporting the strong summer monsoon history.
C.-Y. Huang et al. /Earth and Planetary Science Letters 146 (1997) 59-72 69
summarized in Fig. 7. These findings are generally
in agreement with previous monsoon reconstruction
and are compared briefly here.
4.1.
Comparison with previous studies from the SCSA few studies during the 1980s suggested that
glacial summer
SSTwas less than 2°C cooler than
present, and glacial winter SST was 2-4°C cooler
than present for the SCS [39-411. However, several
recent studies have shown that the winter anomaly
could have been much larger, up to 9°C (1 l,l4,38].
Our result seems to be in agreement with these more
recent estimates. However, the mechanisms responsi-
ble for this significant winter cooling are still not
resolved. Wang et al. [38] proposed that the main
mechanism of this glacial cooling was the entry of
the cooler subtropical western Pacific water into the
SCS through the Bashi Strait. The entering cool
water would also form a counterclockwise circula-
tion pattern, which would explain the N-S gradient
in winter SST during the last glacial period. We find
that the model of Wang et al. cannot explain the
glacial SST and productivity results. The main diffi-
culty with Wang et al.‘s suggestion is that it requires
cooler water from just outside the Bashi Strait to
cool the SCS. Thunell et al. 1421 and Chen et al. [43]
have shown that the western tropical Pacific re-
mained warm during the last glacial. Based on these
estimates, the last glacial winter SST of the region
just outside the Bashi Strait is 20-2 1°C warmer than
Wang et al.‘s estimates for the SCS. If this is the
case, water from this region could not have cooled
the SCS during the last glacial period. The model of
Wang et al. also fails to explain the increase in
productivity during the glacial period. In Wang’s
model, the entry of subtropical water would have
brought nutrient-poor water into the SCS and caused
a decrease in productivity. As discussed above, we
propose that a stronger winter monsoon was respon-
sible for the decrease in the glacial winter SST and
the increases in surface productivity. Our monsoon
model would also be in agreement with the N-S
gradient of the winter SST in the glacial winter.
4.2.
Comparison with Chinese loess recordsMultiple paleomonsoon proxies, such as magnetic
susceptibility, particle flux and grain size, recorded
in the Chinese paleosol (S,, the Holocene) and loess
(L ,
, the last glacial period) suggested a weak winter
monsoon/strong
summer monsoon
during the
Holocene and a strong winter monsoon/weak sum-
mer monsoon during the last glacial period [4,9,44].
Thus, our conclusions regarding the monsoon history
from the tropical region are in agreement with those
from the Asian continent. However, the ampiitude of
the monsoon influence is different in different re-
gions. For example, the last glacial temperature was
7°C lower in Shaanxi [45] compared with our esti-
mates of 4°C in the SCS and 5°C in central Taiwan.
On the other hand, we estimate that last glacial
rainfall was 800 mm lower in central Taiwan com-
pared with 120-200 mm in Northern China 145,461.
These observations seem to indicate that the temper-
ature effect of the winter monsoon was greater on
the Asian continent, while the precipitation effect of
the summer monsoon was more significant in the
tropical region.
4.3.
Comparison with Indian Ocean resultsAlthough the Arabian SST record for the last 25
ka also shows a glacial/interglacial profile similar to
ours [47,48], direct comparison of these two records
is misleading. For the Holocene, the coastal Arabian
Sea SST is mainly controlled by the intensity of
upwelling, which is driven by the summer southwest
monsoon. Coastal upwelling also enhanced produc-
tivity, as is apparent from the much higher TOC
content in the sediments (up to 6%). On the other
hand, there is not a significant upwelling system in
the SCS and the SST is controlled by the surface
currents which, in turn, are controlled by the oscillat-
ing winter and summer monsoon systems. For the
Holocene, SCS summer SST is higher than that of
the Arabian Sea while the winter SST is much lower.
The SCS TOC content is also much lower, due to the
lack of upwelling. During the last glacial period,
Arabian Sea upwelling was reduced substantially and
the main mechanism to account for the lower SST
was proposed to be the increased winter monsoon
strength or length [48]. In the SCS, SST was still
controlled by the monsoon systems, only the winter
monsoon was increased, which cooled the SST by
4°C during the glacial period. Thus, the Arabian Sea
operated very much like the SCS during last glacial
period. However, the TOC content for the two seas
70 C.-Y. Huang et al. /Earth and Planetary Science Letters 146 (1997) 59-72
shows very different glacial/interglacial
profiles.
Since the surface productivity in the Arabian Sea is
controlled by the coastal upwelling, the glacial re-
duction in upwelling strength resulted in lower pro-
ductivity and lower TOC content in the sediments.
However, SCS glacial TOC increased by a factor of
3, due to the increased depth of the surface mixed
layer, as a result of the increase in the winter mon-
soon. It appears that the records from the SCS and
the Arabian Sea are consistent in indicating a stronger
winter monsoon regime over a large region of the
Asian continent and adjacent seas.
These comparisons confirm that the global cli-
matic boundary conditions are probably the driving
forces of the East Asian monsoon variations. Reduc-
tion in solar insolation and the depression in the
Asian continental snowline during the glacial could
have increased the winter atmospheric pressure gra-
dient, thus strengthening the winter monsoon, but
decreased the summer atmospheric pressure gradient
to weaken the summer monsoon. More analyses and
comparison of monsoon records over a longer time
scale and with a larger area1 coverage are needed to
distinguish these forcing mechanisms and to corre-
late with other monsoon systems.
5. Conclusion
Based on the comparison of paleoclimatic records
from a SCS (South China Sea) deep-sea core and a
Taiwan lake peat sequence, we conclude that the
Asian monsoons have varied significantly during the
last 25,000 kyr. These records can be divided into
three periods characterized by a strong winter mon-
soon/weak
summer monsoon regime in the last
glaciation from 25,000 to 12,000 yr BP, a moderate
winter monsoon/weak
to moderate summer mon-
soon regime during the deglaciation from 12,000 to
10,000 yr BP and a moderate to weak winter mon-
soon/strong
summer monsoon
regime in the
Holocene. A strong glacial winter monsoon resulted
in lower winter SST, and increasing seasonality and
biological productivity in the SCS. On land the
enhanced winter monsoon caused a reduction in
floral productivity and the sedimentation rate of peat,
reduced deposition of storm-related clay layers but
increased abundance of xerophyte in Toushe Lake.
The strengthening of the summer monsoon during
the Holocene resulted in higher SST, lower seasonal-
ity and biological productivity in the SCS. In the
lake, the increases in temperature and precipitation
resulted in the increase in floral productivity and the
sedimentation rate of peat, as well as the deposition
of storm-related clay layers. The occurrence of ther-
mophyte also increased.
Acknowledgements
We thank Pinxian Wang, Zhisheng An, Kuo-Yen
Wei, Xihao Wu and Stephen C. Porter, P.B. Yuan
and K.B. Liu for constructive discussions. [IVY
References
[ll
121
131 141 [51161
[71 RIW.L. Prell and J.E. Kutzbach, Monsoon variability over the past 150,000 years, J. Geophys. Res. 92, 8411-8425, 1987. Z. An, X. Wu, P. Wang, S. Wang, G. Dong, X. Sun, D. Zhang, Y. Lu, S. Zheng and S. Zhao, Paleomonsoons of China over the last 130,000 years, Sci. China 34, 1016-1024,
1991.
S.C. Clemens and W.L. Prell, Late Pleistocene variability of Arabian Sea summer monsoon winds and continental aridity: Eolian records from the lithogenic component of deep-sea sediments, Paleoceanography 5, 109-145, 1990.
Z. An, T. Liu, Y. Lu, S.C. Porter, G. Kukla, X. Wu and Y. Jua, The long-term paleomonsoon variation recorded by the loess-paleosol sequence in central China, Quat. Int. 7/8, 91-95, 1990.
M.M. Yoshino, Water balance problems in monsoon Asia from the viewpoint of climatology, in: Water Balance of Monsoon Asia, M.M. Yoshino, ed., pp. l-23, Univ. Hawaii Press, Honolulu, HI, 197 1.
F. Sirocko, M. Samthein, H. Erlenkeuser, H. Lange, M. Arnold and J.C. Duplessy, Century-scale events in mon- soonal climate over the past 24,000 years, Nature 364, 322-324, 1993.
F. Sirocko, D. Garbe-Schonbcrg, A. McIntyre and B. Molflno, Teleconnections between the subtropical monsoons and high-latitude climates during the last deglaciation, Science 272, 526-529, 1996.
Z. An, G. Kukla, S.C. Porter and J. Xiao, Magnetic suscepti- bility evidence of monsoon variation on the loess plateau of central China during the last 130,000 years, Quat. Res. 36, 29-36, 1991.
[9] B.A. Maher, R. Thompson and L.P. Zhou, Spatial and tem- poral reconstructions of changes in the Asian paleomonsoon: A new mineral magnetic approach, Earth Planet. Sci. Lett.
C.-Y. Huang et al. /Earth and Planetaq Science Letters 146 (1997) 59-72 71 [IO] C.Y. Huang, S.F. Wu, M. Zhao, M.T. Chen, C.H. Wang, X.
Tu and P.B. Yuan, Surface ocean and monsoon climate variability in the South China Sea since last glaciation, Mar. Micropaleontol., in press.
[ 111 L. Wang and P. Wang, Late Quaternary paleoceanography of the South China Sea: Glacial-interglacial contrasts in an enclosed basin. Paleoceanography 5, 77-90, 1990. [12] R.C. Thunell. Q. Miao, S.E. Calvert and T.F. Pederson.
Glacial-Holocene biogenic sedimentation patterns in the South China Sea: Productivity variations and surface water pCO,, Paleoceanography 7, 143-162, 1992.
[13] P. Wang, Z. Jian and Z. Liu, Late Quatemary sedimentation rate in the South China Sea, in: Contributions to late Quater- nary paleoceanography of the South China Sea. 2. Ye and P. Wang, eds., pp. 22-41, Qingdao Ocean Press. Qingdao, 1992 (in Chinese with English abstract).
[14] Q. Miao. R.C. Thunell and D.M. Anderson, Glacial-Holo- cene carbonate dissolution and sea surface temperatures in the South China and Sulu seas, Paleoceanography 9. 269- 290, 1994.
1151 K. Wyrtki, Physical oceanography of the southeast Asia waters. Scientific results of maritime investigations of the South China Sea and the Gulf of Thailand 1959-1961. Naga Rep. 2, Scripps Inst. Oceanogr., La Jolla, CA. 1960. [16] S. Chen, T. Chen. X. Xu, Z. Chen and S. Sui, The Vast
South China Sea, 218 pp., China Sci. Press. Beijing, 1985 (in Chinese).
[17] S. Hellerman and M. Rosenstein, Normal monthly wind stress over the world ocean with error estimates, J. Phys. Oceanogr. 13. 1093-l 104, 1983.
[18] C.H. Chi. The tnontane climate of Taiwan, Quat. J. Taiwan Bank 20, 155-207. 1969.
[19] H.J. Su, Studies on the climate and vegetation types of the natural forests in Taiwan (II). Altitudinal vegetation zones in relation to temperature gradient. Quart. 3. Chin. For. 17. 57-73. 1984.
[20] M. Tsukada. Vegetation in subtropical Formosa during the Pleistocene glaciations and the Holocene, Paleogeogr. Paleo- climatol. Paleoecol. 3, 49-64, 1967.
1211 P.M. Liew and S.Y. Huang, Pleistocene cool stages and geological changes of western Taiwan based on palynologi- cal study. Acta Geol. Taiwan, 29, 21-32, 1991.
[22] P.M. Liew and S.Y. Huang. A 5000 year pollen record from Chitsai Lake, central Taiwan, Terr. Atmos. Oceanic Sci. (TAO) 5. 421-429, 1994.
[23] C. Biq, The Yushan-Hsuehshan megashear zone in Taiwan, Proc. Geol. Sot. China 32, 7-20, 1989.
[24] M.L. Rottman, Dissolution of planktonic foraminifera and pteropods in the South China Sea sediments, J. Foram. Res. 9,41-49. 1979.
[2.5] S.C. Brassell, G. Eglinton. I.T. Marlowe, U. Pflaumann and M. Sarnthein, Molecular stratigraphy: A new tool for cli- matic assessment, Nature 320, 129-133. 1986.
1261 F.G. Prahl and S.G. Wakeham, Calibration of unsaturation patterns in long-chain ketone composition for palaeotempera- ture assessment, Nature 330, 367-369, 1987.
[27] M. Zhao. N.A.S. Beveridge, N.J. Shackleton. M. Samthein
and G. Eglinton, Molecular stratigraphy of cores off north- west Africa: Sea surface temperature history over the last 80 ka, Paleoceanography 10, 661-675, 1995.
[28] F.G. Prahl, L.A. Muehlhausen and D.L. Zahnle, Further evaluation of long-chain alkenones as indicators of paleo- ceanographic conditions. Geochim. Cosmochim. Acta 52, 2303-2310, 1988.
[29] M. Samthein. K. Winn. J.C. Duplessy and M.R. Fontugne, Global variations of surface ocean productivity in low and mid latitudes: influence on CO, reservoirs of the deep ocean and atmosphere during the last 2 1,000 years. Paleoceanogra- phy 3, 361-399, 1988.
[30] LT. Marlowe, S.C. Brassell, G. Eglinton and J.C. Green, Long chain unsaturated ketones and esters in living algae and marine sediments. Org. Geochem. 16, 135-141. 1984. [31] F.G. Prahl. N. Pisias, M.A. Sparrow and A. Sabin, Assess-
ment of sea-surface temperature at 42”N in the California Current over the last 30.000 years, Paleoceanography IO. 763-773. 1995.
[32] E. Sikes and L.D. Keigwin. Equatorial Atlantic sea surface temperature for the last 30 kyr: A comparison of U$, a’s0 and foraminiferal assemblage temperature estimates, Paleo- ceanography 9. 3 l-45, 1994.
[33] M.H. Conte, G. Eglinton and L.A.S. Madureira. Long-chain alkenones and alkyl alkenoates as palaeotemperature indica- tors: their production, flux and early sedimentary diagenesis in the Eastern North Atlantic, Org. Geochem. 19. 287-298,
1992.
[34] M.R. Chapman, N.J. Shackleton, M. Zhao and G. Eglinton, Fauna1 and alkenone reconstructions of subtropical North Atlantic surface hydrography and paleotemperature over the past 28 k.y., Paleoceanography 11. 343-358, 1996. [35] E.L. Sikes, J.W. Farrington and L.D. Keigwin, Use of the
alkenone unsaturation ratio LJ$ to determine past sea surface temperatures: Core-top SST calibrations and methodology considerations, Earth Planet. Sci. Lett. 104, 36-47. 1991. 1361 A. Rosell-Melt, G. Eglinton. U. Pflaumann and M. Sam-
thein. Atlantic core-top calibration of the U,k, index as sea-surface palaeotemperature indicator, Geochim. Cos- mochim. Acta 59, 3099-3107. 1995.
1371 State Oceanic Administration, A report of comprehensive investigation on environmental resources in the central part of the South China Sea. pp. 1499162. China Ocean Press,
1988 (in Chinese).
[38] P. Wang, L. Wang, Y. Bian and Z. Jian, Late Quaternary Paleoceanography of the South China Sea: surface circula- tion and carbonate cycles, Mar. Geol. 127, 145-165, 1995. 1391 CLIMAP (Long-Range Investigation. Mapping and Predic-
tion Members), Seasonal reconstruction of the Earth’s sur- face at the last glacial maximum, GSA Map Chart Ser. MC-36, l-18. 1981.
[40] T.C. Moore, L.H. Burckle. K. Geitzenaauer. 8. Lus. A. Molina-Cruz, J.H. Robertson, H. Sacks, C. Sancetta, J. Tbiede. P. Thompson and C. Wenkam. The reconstruction of sea surface temperature in the Pacific Ocean of 18,OOtl B.P.. Mar. Micropaleontol. 5, 215-247. 1980.
72 C.-Y. Huang et al./ Earth and Planetary Science Letters 146 (1997) 59-72
[431
[441
[451
Pacific during the past 150,CfIO years: Comparison of modem and fossil assemblages, Palaeogeogr. Palaeoclimatol. Palaeoecol. 35, 241-279, 1981.
R. Thunell, D. Anderson, D. Gellar and Q. Miao, Sea-surface temperature for the tropical Western Pacific during the last glaciation and their implications for the Pacific warm pool, Quat. Res. 41. 255-264, 1994.
M.P. Chen, C.K. Huang, L. Lo and C.H. Wang, Late Pleis- tocene paleoceanography of the Kuroshio Current in the area offshore Southeast Taiwan, Terr. Atmos. Oceanic Sci. (TAO) 3, 81-110, 1992.
J. Xiao, SC. Porter, Z. An, K. Xiao and S. Yoshikawa, Grain size of quartz as an indicator of winter monsoon strength on the loess plateau of central China during the last 130,000 yr. Quat. Res. 43, 22-29, 1995.
N. Wu, H. Lu, X. Sun, Z. Guo, J. Liu and J. Han, Climate factor transfer function from opal phytolith and its applica- tion in pa&climate reconstruction of China Loess-Paleosol sequence, Sci. Geol. Sin. Suppl. Issue 1, 105-I 14, 1995.
1461
I421
[471
[481
[491
M.H. WinkIer and P.K. Wang, The late-Quatemary vegeta- tion and climate of China, in: Global Climates Since the Last Glacial Maximum, H.E. Wright Jr., J.E. Kutzbach, T. Webb III, W.F. Ruddiman. F.A. Street-Perrott and P.J. Bartlein, eds., pp. 221-261, Univ. Minnesota Press, Minneapolis, MN,
1993.
F. Rostek, G. Ruland, F.C. Bassinot, P.J. Muller, L.D. Labeyrie, Y. Lancelot and E. Bard, Reconstructing sea sur- face temperature and salinity using 6’*0 and alkenone records, Nature 364, 319-321, 1993.
K.-C. Emeis, D.M. Anderson, H. Doose, D. Kroon and D. Schulz-Bull, Sea-surface temperature and the history of mon- soon upwelling in the Northwest Arabian Sea during the last 500,000 years, Quat. Res. 43, 355-361, 1995.
National Oceanic and Atmospheric Administration (NOAA), World Ocean Atlas, Natl. Oceanogr. Data Center, Ocean Climate Lab., Washington, DC, 1994.