This article was downloaded by: [National Chiao Tung University 國立交通大學]
On: 30 April 2014, At: 15:49
Publisher: Taylor & Francis
Informa Ltd Registered in England and Wales Registered Number: 1072954 Registered office: Mortimer
House, 37-41 Mortimer Street, London W1T 3JH, UK
Journal of the Air & Waste Management
Association
Publication details, including instructions for authors and subscription information:
http://www.tandfonline.com/loi/uawm20
Air Pollution Directional Risk Assessment for Siting
a Landfill
Wei-Yea Chen
a& Jehng-Jung Kao
a aInstitute of Environmental Engineering , National Chiao Tung University , Hsinchu ,
Taiwan , People’s Republic of China
Published online: 28 Mar 2012.
To cite this article: Wei-Yea Chen & Jehng-Jung Kao (2008) Air Pollution Directional Risk Assessment for Siting a
Landfill, Journal of the Air & Waste Management Association, 58:12, 1539-1545
To link to this article:
http://dx.doi.org/10.3155/1047-3289.58.12.1539
PLEASE SCROLL DOWN FOR ARTICLE
Taylor & Francis makes every effort to ensure the accuracy of all the information (the “Content”)
contained in the publications on our platform. However, Taylor & Francis, our agents, and our licensors
make no representations or warranties whatsoever as to the accuracy, completeness, or suitability for any
purpose of the Content. Any opinions and views expressed in this publication are the opinions and views
of the authors, and are not the views of or endorsed by Taylor & Francis. The accuracy of the Content
should not be relied upon and should be independently verified with primary sources of information.
Taylor and Francis shall not be liable for any losses, actions, claims, proceedings, demands, costs,
expenses, damages, and other liabilities whatsoever or howsoever caused arising directly or indirectly in
connection with, in relation to or arising out of the use of the Content.
This article may be used for research, teaching, and private study purposes. Any substantial or systematic
reproduction, redistribution, reselling, loan, sub-licensing, systematic supply, or distribution in any
form to anyone is expressly forbidden. Terms & Conditions of access and use can be found at
http://
www.tandfonline.com/page/terms-and-conditions
Air Pollution Directional Risk Assessment for Siting a Landfill
Wei-Yea Chen and Jehng-Jung Kao
Institute of Environmental Engineering, National Chiao Tung University, Hsinchu, Taiwan, Republic
of China
ABSTRACT
Air pollution directional risk (APDR) is an essential factor to be assessed when selecting an appropriate landfill site. Because air pollutants generated from a landfill are dif-fused and transported by wind in different directions and speeds, areas surrounding the landfill will be subject to different associated risks, depending on their relative po-sition from the landfill. This study assesses potential APDRs imposed from a candidate landfill site on its adja-cent areas on the basis of the pollutant distribution sim-ulated by a dispersion model, wind directions and speeds from meteorological monitoring data, and population density. A pollutant distribution map layer was created using a geographic information system and layered onto a population density map to obtain an APDR map layer. The risk map layer was then used in this study to evaluate the suitability of a candidate site for placing a landfill. The efficacy of the proposed procedure was demonstrated for a siting problem in central Taiwan, Republic of China. INTRODUCTION
Despite the availability of various alternatives, landfilling remains an essential disposal method for municipal solid waste (MSW). However, new landfill sites are extremely difficult to obtain because of increasing land costs and the NIMBY (not in my back yard) consensus from the general public.1,2 Regulations for construction of landfills have become quite restrictive because of increased understand-ing of their significant environmental impact. Landfill siting is now a sensitive environmental issue, particularly for a densely populated island such as Taiwan.
Choosing a suitable location for placing a landfill requires evaluation of potential air pollution impact. A landfill can emit pollutants such as methane and volatile organic compounds, although soil covering is generally
applied on the top of landfilled waste to reduce emissions. The odors from a landfill also pose significant impacts on its neighboring population. Furthermore, occasional fires in landfills increase the emission of organic pollutants.3 These pollutants can significantly affect human health and the environment. Lindberg et al.4 indicated that methylated mercury species have been detected in gas generated from a municipal waste landfill as a result of fluorescent lights, batteries, electrical switches, and ther-mometers being landfilled, despite recommendations that these wastes should be avoided. To protect the health of the population, an appropriate landfill site should not impose a significant air pollution impact on its adjacent downwind area.
Because air pollutants are transported by wind, wind direction determines the direction pollutants are carried to, and wind speed determines how far the pollutants can be diffused. As Thanh and Lefevre5 pointed out, wind speed and direction strongly influence the level of health impacts because of air pollution at varied locations. Al-though landfill sites are usually located in areas of low population density, air pollutants generated by the land-fill can be transported by wind to affect downwind areas with high population density.
Different locations have different meteorological characteristics with different wind direction and speed patterns. Wind directions and speeds are not constant over time, and are generally subject to seasonal or tem-poral variation. To analyze air pollution risk, a windrose plot analyzing wind direction and speed patterns is gen-erally prepared. The windrose plot displays the distribu-tion of wind speeds in different direcdistribu-tions. The prevailing wind direction is the direction with the highest frequency of occurrence. However, in many cases nonprevailing wind directions may also have significant distant diffu-sion and cause significant impact on high population density areas. Assessing air pollution risk on the basis of the prevailing wind direction only may thus be inappro-priate. Even with the same emission rate, different wind directions and speeds will cause different air pollutant impacts on downwind areas. This study therefore assesses the potential air pollution directional risk (APDR) posed by a candidate landfill site. There are several other meth-ods available for assessing the potential risk induced by a landfill. For example, Macleod et al.6 developed a risk screening approach for assessing human exposures to air pollution control residues released from landfills. Butt and Oduyemi7developed a holistic computer model of 12
IMPLICATIONS
For evaluating the suitability of a candidate landfill site, this study proposed a method to estimate APDR on the basis of population density and a simulated spatial pollution distri-bution. A site located in an area with low population density may still induce high APDR in its downwind areas, and the direction with the highest APDR may not occur in the pre-vailing wind direction. Thus, siting decisions based on the prevailing wind direction alone may be misleading. The proposed APDR is expected to improve the quality of siting decisions, although it should not the sole factor considered in making a final determination of a siting.
modules to carry out concentration assessment for evalu-ating landfill risk. However, although quite comprehen-sive, these methods are not suitable for use in a siting analysis. In general, siting requires analysis of various factors. As risk assessment is just one consideration, albeit important, it is not appropriate to use a complex or ex-pensive method during the siting stage. The proposed APDR, although simple, is capable of assessing the poten-tial directional risk caused by a landfill site.
To estimate the potential risk from a landfill, it is necessary to know the spatial pollution distribution. For instance, Sengupta et al.8used air pollution data to create an air quality map, which was combined with a land-use map to produce an air quality index map. A population pressure map, based on population density and popula-tion growth data, is then overlaid with the air quality index map to find out the pollutant risk zones. The im-pact of air pollution on any location can be assessed by analyzing the population in conjunction with the air pollution concentration at that location.9Beer and Ricci10 also considered the population pattern and concentration distribution for evaluating the risk. An air quality model, ISCST3,11was thus applied to simulate air pollutant con-centration distribution at areas surrounding a candidate landfill site. The proposed APDR was then calculated by multiplying the simulated concentration by the popula-tion density. Populapopula-tion density data were obtained from a census database. Meteorological observation data were available only for the few locations containing monitor-ing stations. Meteorological data for all other locations were estimated using the Draxler method12according to the data collected at closest monitoring stations.
Landfill-siting analysis requires processing of a signif-icant amount of spatial information to evaluate various environmental, social, economic, and engineering fac-tors. Because collecting and analyzing this spatial data is time consuming and tedious, in recent years a computer-ized geographical information system (GIS) has often been implemented to facilitate siting-related tasks.13–20A GIS can process digital map layers of pollutant and pop-ulation density distributions, provides analysis functions for implementing map layer computation, and presents a georeferenced illustration of analytical results. ArcView21 is the GIS used in this study to process and create various map layers to facilitate landfill-siting analyses.
The following sections describe the proposed method for assessing the potential APDR imposed by a candidate landfill site on its adjacent areas on the basis of the sim-ulated pollutant distribution, wind direction and speed patterns, and population density. Overlaying a popula-tion density map onto a pollutant distribupopula-tion map layer created using a GIS formed an APDR map layer. This APDR map layer was then used to evaluate the suitability of a candidate landfill site. A case study for a local landfill-siting problem in central Taiwan, Republic of China, was implemented to demonstrate the efficacy of the proposed method.
METHODOLOGY
A landfill site should be situated at a location with mini-mal APDR to protect the health of the surrounding pop-ulation. A risk estimate primarily based on the prevailing
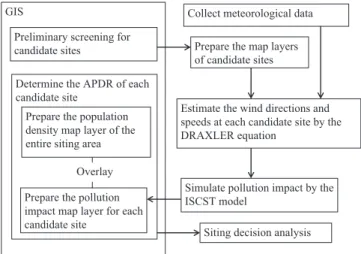
wind direction is not appropriate, especially in areas of significant seasonal wind direction variation. Conse-quently, this study assesses the APDR on the basis of wind directions and speeds, population density, and the pollu-tion concentrapollu-tion distribupollu-tion simulated by the ISCST311 dispersion model. The suitability of a candidate site can be then evaluated based on its estimated APDR value. The procedure for implementing the proposed APDR assess-ment is illustrated in Figure 1, and each step of the pro-cedure is detailed as follows.
Preliminary Screening
Various criteria were adopted to preliminarily screen out areas that were obviously inappropriate for constructing a landfill on the basis of environmental, sociocultural, and engineering/economic factors. Map layers for environ-mental, sociocultural, and engineering/economic factors were thus prepared by ArcView.21 The cell size of these map layers is 500⫻ 500 m. This prescreening process (e.g., see Kao et al.13) can eliminate many inappropriate loca-tions within the siting area, thereby minimizing further siting analysis and reducing analysis time.
Wind Direction and Speed Estimation Completion of this study requires temporal and spatial wind direction and wind speed data for candidate sites. However, most candidate sites do not have a meteorolog-ical observation station in their immediate vicinity to provide this data. Therefore, wind directions and speeds must be based on the data collected from neighboring observation stations. Two kinds of methods are available to perform such an estimation: diagnostic methods and prognostic methods.22Prognostic methods are too com-plex and expensive to apply to this siting problem. In-stead, this study used a practical diagnostic method known as the DRAXLER method.12 The DRAXLER method estimates the wind directions and speeds at a location according to its distance from observation sta-tions. Hourly meteorological data were collected from several observation stations, and wind directions of N (north), north-northeast (NNE), northeast (NE), east-northeast (ENE), E (east), east-southeast (ESE), southeast (SE), south-southeast (SSE), S (south), south-southwest
GIS Collect meteorological data
Estimate the wind directions and speeds at each candidate site by the DRAXLER equation
Simulate pollution impact by the ISCST model
Determine the APDR of each candidate site
Prepare the population density map layer of the entire siting area
Prepare the pollution impact map layer for each candidate site
Overlay Preliminary screening for candidate sites
Siting decision analysis Prepare the map layers of candidate sites
Figure 1. The procedure of the proposed APDR assessment.
Chen and Kao
(SSW), southwest (SW), west-southwest (WSW), W (west), west-northwest (WNW), northwest (NW), and north-northwest (NNW) were recorded. Wind speeds below 0.51 m/sec were regarded as a calm wind. Wind directions and speeds were estimated by the following DRAXLER equation:
共us,vs兲ij⫽
冘
k ␣s rsk2 䡠 共uk,vk兲冘
k ␣s rsk2 (1)where usand vsare the E and N vector components of the wind direction to be estimated at the grid point s(i,j); uk and vkare the E and N vector components of the wind direction observed at station k; rsk is the distance from grid point s(i,j)to the observation station;␣sis a weighting parameter, ␣s ⫽ 1 ⫺ 0.5 sin⌿s; and⌿s is the angle, in degrees, between the observed wind direction and the line connecting grid point s(i,j)and observation station k.
Pollution Impact on the Vicinity
To determine the APDR, it is important to assess the potential impact of pollution on the vicinity of a candi-date site. A spatial pollution distribution was therefore simulated using the ISCST3model.11The area adjacent to the candidate site was divided into several receptor zones. As shown in Figure 2, the center of a receptor zone is located in one of 16 directions, consistent with the direc-tions used for drawing a windrose plot. The area of a receptor zone spans 11.25 ° either side of the centerline, connecting the center and the candidate site. The dis-tance between each receptor zone and the candidate site is a multiple of 500 m, as illustrated in Figure 2. A typical emission rate was applied to each candidate site to esti-mate the average monthly pollutant concentration for each simulated location. This monthly average was then used to compute the risk, as described below.
APDR
The proposed APDR of a receptor zone was computed by multiplying the population in the zone by the pollutant concentration simulated at the center of the zone. The
computation was performed using the spatial calculation function in a GIS, ArcView.21Two map layers were pre-pared for pollutant concentrations at all simulated loca-tions and population densities for all map cells, respec-tively. The size for each map cell is 100⫻ 100 m. A GIS map calculation function was then applied to multiply the pollution concentration map layer by the population density map layer and the logarithm function was used to obtain a new map layer for APDR values at all map cells. The APDR map layer could then be used to assess the suitability of a candidate site.
CASE STUDY
The siting area for this study includes the three counties of Howlong, Shihwu, and Tong-Shiiau of Miaoli Prefec-ture in central Taiwan, Republic of China. A regional landfill is desired for the three counties. The size of the study area is approximately 224.7 km2. Various GIS map layers and related information were collected for the study area. The average population density is 402 capita/ km2, whereas the maximum is 14,746 capita/km2and the minimum is 16 capita/km2. Although selecting a landfill site in an area with low population density can decrease the risk, transportation costs may be significantly in-creased. It is therefore a challenge to site a landfill at a considerable distance from an area of significant popula-tion density variapopula-tion. Different locapopula-tions have different population densities and wind direction and speed pat-terns. Therefore, the scope of the impact posed by air pollutants emitted from a landfill is also different for different locations and directions. Further analysis is thus required to assess the suitability of each candidate site by the proposed APDR.
Preliminary Screening
Before applying the proposed method to estimate APDR, various raster-based geo-referenced map layers were col-lected and prepared. These layers include fault zones, rivers, road networks, water resources and groundwater protection areas, historical sites, and land slope.13 Accord-ing to the collected criteria, a landfill site is restricted from the following sensitive areas:
• Environmental Factors: groundwater protection areas; water source, water quality, and water quantity conservation districts; buffer zones close to a stream (a 180-m buffer zone was set); natural ecology conservation districts; fault and unstable areas (a 60-m buffer zone was set); and the 100-yr flood plain.
• Sociocultural Factors: urban areas (a 150-m buffer zone was set), cultural and historic sites (a 350-m buffer zone was set), and national parks.
• Engineering and Economic Factors: areas distant from accessible roads (an acceptable distance of 1100 m was set) and land slopes greater than 25%.
Various map layers were collected and prepared based on the criteria listed above. Map layer analysis functions provided by a GIS, ArcView,21 were applied to process these digital map layers to eliminate the areas that are inappropriate to be a landfill site. Figure 3 illustrates the
Figure 2. Pollution concentrations simulated in different directions and locations.
194 sites remaining after this preliminary screening pro-cess. Although the prescreening process screens out a large unsuitable portion of the siting area, further analysis is required to determine the most suitable site. Seven candidate sites, as illustrated in Figure 4, have been se-lected to demonstrate the proposed method.
Population Density Map Layer
A population density map layer for the study area, as shown in Figure 4, was prepared to determine the pro-posed APDR. The cell size of this map layer is 100⫻ 100 m and the unit of population density is capita/10,000 m2, (equivalent to 100 capita/km2. The maximum population density is 777 capita/10,000 m2and the minimum is only one capita/10,000 m2. Approximately 5% of the area has a population density over 17 capita/10,000 m2; approxi-mately 30% between 4 and 10 capita/10,000 m2; 36.5% between 2 and 3 capita/10,000m2; and 13.5% 1 capita/ 10,000 m.2
In general, placing a landfill at a location with low population density is preferred. However, Taiwan is a heavily populated country and it is difficult to find a location that is far away from residential areas. For can-didate sites located at areas with similar population den-sity, a method is desired to make a further decision. The proposed directional risk is thus applied herein to facili-tate landfill-siting analysis.
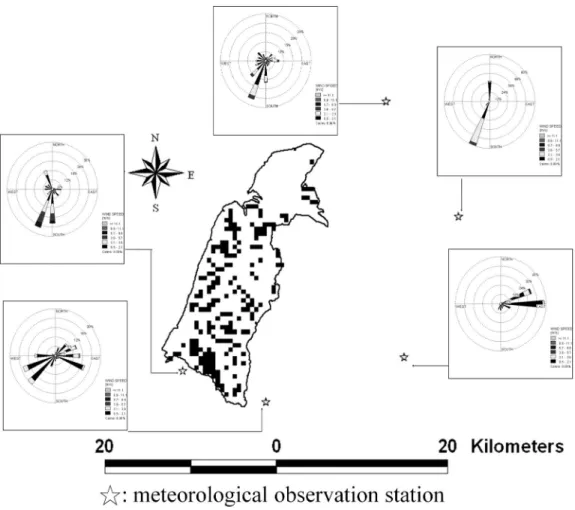
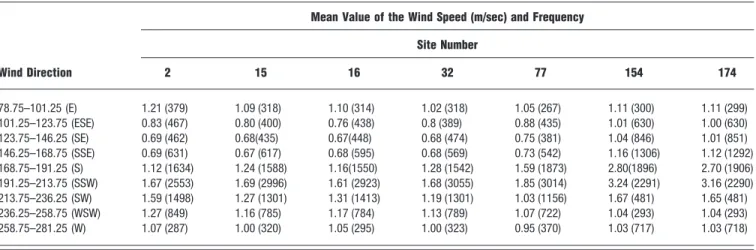
Wind Direction and Speed Estimation There are five meteorological observation stations sur-rounding the study area. Windrose plots for each station are illustrated in Figure 3. The prevailing wind directions for these stations are SW for one station, SSW for three stations, and E for one station. As previously mentioned, the DRAXLER method12was used to estimate wind direc-tions and speeds at seven candidate sites and the associ-ated windrose plots were drawn by the WRPLOT View,23 as shown in Figure 4. This study defines calm as the wind speed under 0.51 m/sec, as used by Rama Krishna.24As listed in Table 1, the range for wind directions mainly spans over [90° 270°]. Therefore, the pollutants are rarely diffused towards the N area of the sites. Table 1 also lists the average wind speed in each direction at candidate sites. A significant variation of wind speeds can be ob-served from the list.
Pollutant Distribution Simulation
The pollutant distribution for each site was simulated using the ISCST311model. In this study, the emission rate at each site is assumed to be 0.018 mg/(s䡠 m2), a typical average emission rate measured from 2- to 3-yr-old local landfill sites.25If required, a different emission rate can be applied, and a particular pollutant can be specified. How-ever, there is generally no need to do so because siting is
Figure 3. Map layer of the 194 candidate sites remaining after the preliminary screening process, and the locations and associated windroses for five meteorological observation stations in the study area.
Chen and Kao
primarily based on a relative comparison among candi-date sites. The simulation region is a circular area of radius of 5 km that surrounds each candidate site. The simula-tion results are converted into GIS pollutant distribusimula-tion map layers, as illustrated in Figure 4. The darker area indicates the area with higher pollutant concentration and vice versa. It can be observed that, for sites 154 and 174, the directions of high concentration are not the same as the direction of prevailing wind because the dis-persion of pollutant is also influenced by wind speed. The
direction with high pollutant concentration generally oc-curs at a low mean speed, such as the SSE direction for sites 2, 15, 16, 32, and 77. However, low mean speed is not the only factor to affect the simulated pollution distri-bution. The occurrence frequency is also essential. For example, the direction W of sites 2, 15, 16, 32, and 77 has a low mean speed and low occurrence frequency, and, as illustrated in Figure 4, the areas with high pollutant concentration are obviously smaller than those with high occurrence frequency, such as sites
Figure 4. The population density map layer for the study area, and the pollutant concentration (PC), APDR distribution, and windrose diagrams for each candidate site.
Table 1. Mean wind speeds and frequencies estimated by using the DRAXLER method12in different wind directions for each candidate landfill site.
Wind Direction
Mean Value of the Wind Speed (m/sec) and Frequency Site Number 2 15 16 32 77 154 174 78.75–101.25 (E) 1.21 (379) 1.09 (318) 1.10 (314) 1.02 (318) 1.05 (267) 1.11 (300) 1.11 (299) 101.25–123.75 (ESE) 0.83 (467) 0.80 (400) 0.76 (438) 0.8 (389) 0.88 (435) 1.01 (630) 1.00 (630) 123.75–146.25 (SE) 0.69 (462) 0.68(435) 0.67(448) 0.68 (474) 0.75 (381) 1.04 (846) 1.01 (851) 146.25–168.75 (SSE) 0.69 (631) 0.67 (617) 0.68 (595) 0.68 (569) 0.73 (542) 1.16 (1306) 1.12 (1292) 168.75–191.25 (S) 1.12 (1634) 1.24 (1588) 1.16(1550) 1.28 (1542) 1.59 (1873) 2.80(1896) 2.70 (1906) 191.25–213.75 (SSW) 1.67 (2553) 1.69 (2996) 1.61 (2923) 1.68 (3055) 1.85 (3014) 3.24 (2291) 3.16 (2290) 213.75–236.25 (SW) 1.59 (1498) 1.27 (1301) 1.31 (1413) 1.19 (1301) 1.03 (1156) 1.67 (481) 1.65 (481) 236.25–258.75 (WSW) 1.27 (849) 1.16 (785) 1.17 (784) 1.13 (789) 1.07 (722) 1.04 (293) 1.04 (293) 258.75–281.25 (W) 1.07 (287) 1.00 (320) 1.05 (295) 1.00 (323) 0.95 (370) 1.03 (717) 1.03 (718)
Notes: Wind frequency values are given in parentheses.
154. On the other hand, similar reasons can be applied to explain why the area with high pollution concentra-tion does not occur in the prevailing wind direcconcentra-tion for sites 2, 15, 16, 32, 77, and 174. For example, the pre-vailing wind direction for site 154 is the SSW direction, but the direction with high pollutant concentration is in the SE direction because the mean speed is higher in the SSW. If wind speeds in the prevailing direction are frequently high, the emitted pollutant will be effec-tively dispersed and hence the impact on the direction will be minimized.
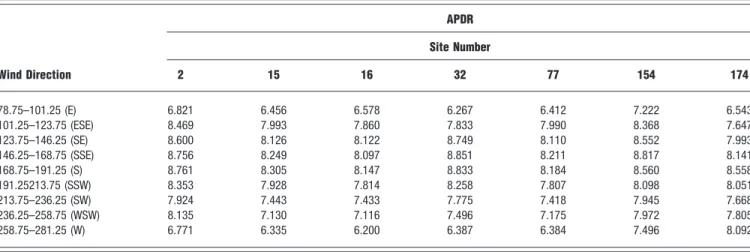
APDR
The APDR estimated in this study is equal to the popula-tion density multiplied by pollutant concentrapopula-tion for the receptor zones located in each wind direction. Figure 4 displays the logarithmic annual APDR plot for each site. The darker area implies higher risk and vice versa. Table 2 lists the APDR values of all candidate sites. As listed in the table and illustrated in Figure 4, the direction of high pollutant concentration is not always consistent with the direction of high risk. This is because the population densities of receptor zones vary significantly in different directions. For example, for site 2, the direction with high pollutant concentration is pointed towards the SSW, but the high APDR direction is instead pointed S. The pollut-ant concentrations simulated for sites 15 and 32 are sim-ilar in the direction of SSW, whereas the APDR values in that direction are higher for site 32 than for site 15. In comparison, the pollutant concentrations simulated for site 154 are lower than those for site 16, but the APDR values for site 154 are higher than those for site 16 be-cause their population densities at receptor zones are sig-nificantly different. A decision made primarily based on pollution distribution may thus be inappropriate, and therefore the proposed APDR can be used to enhance the quality of a siting decision.
CONCLUSIONS
Suitable landfill sites should have low potential impact to the environment and human health. This study thus pro-posed an APDR siting factor for assessing the suitability of a candidate site. The pollution concentration estimated at receptor zones in the prevailing wind direction is not
always the highest concentration. This is because the dis-tribution of wind speeds may vary with directions, causing significant variation in the APDRs in different wind direc-tions. The direction with high pollution distribution may be different from the direction with high APDR because of the population distribution. The correct positioning of a landfill is at a site with relatively low APDR for its vicinity. The proposed APDR siting factor is expected to enhance the quality of site selection for landfill construction.
ACKNOWLEDGMENTS
The authors thank the National Science Council, Taiwan, for providing partial financial support of this work under Grant No. NSC 95-2221-E-009-115.
REFERENCES
1. Sasao, T. An Estimation of the Social Costs of Landfill Siting Using a Choice Experiment; Waste Manage. 2004, 24, 753-762.
2. Ham, R.K. Overview and Implications of U.S. Sanitary Landfill Prac-tice; J. Air & Waste Manage. Assoc. 1993, 43, 187-190.
3. Wichmann, H.; Kolb, M.; Jopke, P.; Schmidt, C.; Alawi, M.; Bahadir, M. Assessment of the Environmental Impact of Landfill Sites with Open Combustion Located in Arid Regions by Combined Chemical and Ecotoxicological Studies; Chemosphere 2006, 65, 1778-1783. 4. Lindberg, S.E.; Wallschla¨ger, D.; Prestbo, E.M.; Bloom, N.S.; Price, J.;
Reinhart, D. Methylated Mercury Species in Municipal Waste Landfill Gas Sampled in Florida, USA; Atmos. Environ. 2001, 35, 4011-4015. 5. Thanh, B.D.; Lefevre, T. Assessing Health Impacts of Air Pollution from
Electricity Generation: the Case of Thailand; Environ. Impact Assess. Rev. 2000, 20, 137-158.
6. Macleod, C.; Duarte-Davidson, R.; Fisher, B.; Ng, B.; Willey, D.; Shi, J. P.; Martin, I.; Drew, G.; Pollard, S. Modeling Human Exposures to Air Pollution Control (APC) Residues Released from Landfills in England and Wales; Environ. Int. 2006, 32, 500-509.
7. Butt, T.E.; Oduyemi, K.O.K. A Holistic Approach to Concentration Assessment of Hazards in the Risk Assessment of Landfill Leachate; Environ. Int. 2003, 28, 597-608.
8. Sengupta, S.; Patil, R.S.; Venkatachalam, P. Assessment of Population Exposure and Risk Zones due to Air Pollution Using the Geographical Information System; Comput. Environ. Urban Systems 1996, 20, 191-199.
9. Zhang, J.; Hodgson, J.; Erkut, E. Using GIS to Assess the Risks of Hazardous Materials Transport in Networks; Eur. J. Oper. Res. 2000, 121, 316-329.
10. Beer, T.; Ricci, P.F. A Quantitative Risk Assessment Method based on Population and Exposure Distributions Using Australian Air Quality Data; Environ. Int. 1999, 25, 887-898.
11. User’s Guide for the Industrial Source Complex(ISC3)Dispersion Models; EPA-454/B-95-003a; U.S. Environmental Protection Agency; Office of Air Quality Planning and Standards: Research Triangle Park, NC, 1995. 12. Draxler, R.R. Modeling the Results of Two Recent Mesoscale
Disper-sion Experiments; Atmos. Environ. 1979, 13, 1523-1533.
Table 2. The APDR values in different wind directions for each candidate landfill site.
Wind Direction APDR Site Number 2 15 16 32 77 154 174 78.75–101.25 (E) 6.821 6.456 6.578 6.267 6.412 7.222 6.543 101.25–123.75 (ESE) 8.469 7.993 7.860 7.833 7.990 8.368 7.647 123.75–146.25 (SE) 8.600 8.126 8.122 8.749 8.110 8.552 7.993 146.25–168.75 (SSE) 8.756 8.249 8.097 8.851 8.211 8.817 8.141 168.75–191.25 (S) 8.761 8.305 8.147 8.833 8.184 8.560 8.558 191.25213.75 (SSW) 8.353 7.928 7.814 8.258 7.807 8.098 8.051 213.75–236.25 (SW) 7.924 7.443 7.433 7.775 7.418 7.945 7.668 236.25–258.75 (WSW) 8.135 7.130 7.116 7.496 7.175 7.972 7.805 258.75–281.25 (W) 6.771 6.335 6.200 6.387 6.384 7.496 8.092
Chen and Kao
13. Kao, J.J.; Chen, W.Y.; Lin, H.Y.; Guo, S.J. Network Expert Geographic Information System for Landfill Siting; J. Comput. Civil Eng. 1995, 10, 295-299.
14. Siddiqui, M.Z.; Everett, J.W.; Vieux, B.E. Landfill Siting Using Geo-graphic Information Systems: a Demonstration; J. Environ. Eng. 1996, 122, 515-523.
15. Jolly, I.D.; Walker, G.R.; Dowling, T.I.; Christen, E.W.; Murray, E. Regional Planning for the Siting of Local Evaporation Basins for the Disposal of Saline Irrigation Drainage: Development and Testing of a GIS-Based Suitability Approach; J. Environ. Manage. 2001, 63, 51-70. 16. Chen, W.Y.; Kao, J.J. A Fuzzy Markov Approach for Assessing
Ground-water Pollution Potential for Landfill Siting; Waste Manage. Res. 2002, 20, 187-197.
17. Kontos, T.D.; Komilis, D.P.; Halvadakis, C.P. Siting Municipal Solid Waste Landfills with a Spatial Multiple Criteria Analysis Methodology; Waste Manage. 2005, 25, 818-832.
18. Lin, H.Y.; Kao, J.J. Grid-Based Heuristic Method for Multifactor Land-fill Siting; J. Comput. Civil Eng. 2005, 10, 369-376.
19. Yesilnacar, M.I.; Cetin, H. Site Selection for Hazardous Wastes: a Case Study from the GAP Area, Turkey; Eng. Geol. 2005, 81, 371-388. 20. Sener, B.; Su¨zen, M.L.; Doyuran, V. Landfill Site Selection by Using
Geographic Information Systems; Environ. Geol. 2006, 49, 376-388. 21. ArcView GIS; Environmental Systems Research Institute, Inc.:
Red-lands, CA, 1996.
22. Kim, J.Y.; Ghim, Y.S.; Kim, Y.P.; Dabdub, D. Determination of Domain for Diagnostic Wind Field Estimation in Korea; Atmos. Environ. 2000, 34, 595-601.
23. Lake Environmental Software, Version 5.3.0; available at http://www. weblakes.com/lakewrpl.html (accessed June 2006).
24. Rama Krishna, T.V.B.P.S.; Reddy, M.K.; Reddy, R.C.; Singh, R.N. Im-pact of an Industrial Complex on the Ambient Air Quality: Case Study Using a Dispersion Model; Atmos. Environ. 2005, 39, 5395-5407. 25. Hegde, U.; Chang, T.-C.; Yang, S.-S. Methane and Carbon Dioxide
Emissions from Shan-Chu-Ku Landfill Site in Northern Taiwan; Che-mosphere 2003, 52, 1275-1285.
About the Authors
Wei-Yea Chen is a candidate for doctoral degree and Je-hng-Jung Kao is currently a professor at the Institute of Environmental Engineering at the National Chiao Tung Uni-versity in Hsinchu, Taiwan, Republic of China. Please ad-dress correspondence to: Jehng-Jung Kao, Institute of En-vironmental Engineering, National Chiao Tung University, 75 Po-Ai Street, Hsinchu, Taiwan, Republic of China; phone: ⫹886-3-573-1869; fax: ⫹886-3-573-1759; e-mail: jjkao@mail.nctu.edu.tw.