Choice of high and
low
thresholds in the rate-based
flow
control scheme
Y.-C. Lai and Y.-D. Lin
Abstract: In a rate-based flow control scheme, the important issue is how to determine congestion occurrence and congestion relief. The most common method is to set two thresholds of queue length, a hgh threshold and a low threshold. The values of these two thresholds seriously influence the system performance. Hence the authors present the concept of ‘best area’ to determine how to set the high and low thresholds to guarantee good performance (i.e. cell loss probability is zero and utilisation is one, if it is possible). Some rules are also given to prevent unnecessary cell loss and under-utilisation, when good performance is not achieved due to too many connections or too large a propagation delay.
1 Introduction
ATM (asynchronous transfer mode) is the most promising transfer technology for implementing B-ISDN. It supports applications with distinct QoS requirements such as delay,
jitter, and cell loss and with distinct demands such as band- width and throughput. To provide these services for a wide variety of applications, in addition to CBR (constant bit rate), rt-VBR (real-time variable bit rate) and nrt-VBR (non-real-time variable bit rate) service, the ATM forum defined a new service class known as ABR (available bit rate) service to support data applications economically. Also, an end-to-end adaptive control mechanism called closed-loop rate-based flow control is applied to this serv- ice. In this control scheme, the allowed cell transmission rate of each ABR connection is dynamically regulated by feedback dormation from the network [14]. If the net- work is congested, the source end decreases its cell trans- mission rate when it receives congestion indication. Also, the source end increases its cell transmission rate when con- gestion is relieved. The rate-based control mechanism can efficiently control the connection flows and utilise the net- work bandwidth.
Recently several analyses and simulations have been con- ducted for rate-based flow control schemes. First, Bolot and Shankar used differential equations to model the rate increase and decrease [7]. Yin and Hluchyj proposed ana- lytical models for early versions of ABR control with a timer-based approach [8, 91. Ramamurthy and Ren devel-
oped a detailed analytical model to capture the behaviour of a rate-based flow control scheme and obtain approxi- mate solutions in closed forms [lo]. Ohsaki et al. made an analysis and comparison between different switches in the steady state and initial transient state [ll-131. Ritter derived
OIEE, 1999
IEE Proceedhgs online no. 19990279
DOL lO.l049/ipm:19990279
Paper fust received 2nd April 1997 and in revised form 17th September 1998
Y.-C. Lai is with the Department of Computer hence and Information Engi- neering, National Cheng Kung Univmity, 1 Ta Hsueh Road, Tainan, Taiwan Y.D. Lin is with the Department of Computer and Information Science, National Chiao Tung University, 1001 Ta Hsuch Road, Hsinchu, Taiwan
the closed form expression to quickly estimate the buffer requirements of different switches [14].
These analyses assume that no cell loss OCCUTS at the
switch. Based on this assumption, the maximum queue length (buffer requirement) at the switch is derived. How- ever, the switch capacity of a buffer is of finite size, which may be less than the maximum queue length derived. Actu- ally, the maximum queue length ought not to exceed the buffer size at the switch, and extra arrival cells will be lost when the buffer is full. In this paper, we assume the switch capacity of the buffer is finite to reflect real conditions. Also, the performance issues that we are concerned with change from the maximum queue length to cell loss proba- bility and utilisation.
In a rate-based flow control scheme, the common method is to set two thresholds of queue length to deter- mine congestion occurrence and congestion relief. The val- ues of these two thresholds vastly influence the system performance. For example, when the high threshold is large, the switch detects congestion later and thus, cell loss probability would be larger. SimLlarly, when the low thresh- old is small, the detection time of congestion relief would be late and cause buffer to underflow and utilisation to drop. Hence some rules, which determine how to set the high and low thresholds, are needed to avoid unnecessary cell loss and under-utilisation.
2 Rate-based flow control
First, we briefly introduce the basic operation of a closed- loop rate-based flow control algorithm [l]. The source end system (SES) sends a forward resource management (RM) cell every N , data cells to probe the congestion status of
the network. The destination end system (DES) returns the forward RM cell as a backward RM cell to the SES.
Depending on the received backward RM cell, SES adjusts its allowed cell rate (ACR), which is bounded between peak cell rate (PCR) and minimum cell rate (MCR).
The RM cell contains a 1-bit congestion indication (CI), which is set to zero, and an explicit rate (ER) field which is set to PCR initially by the SES. Depending on the different ways to indicate congestion status, two types of switches are implemented. One is the explicit forward congestion indication (EFCI) the other is the explicit rate (ER) switch.
95 IEE Proc.-Commun., Vol. 146, No. 2, April 1999
In the EFCI type, the switch in congestion status sets the EFC[ bit to one (EFCI = 1) in the header of each passing data cells. The DES, if a cell with EFCI = 1 has been received, marks the CI bit (CI = 1) to indicate congestion in each backward RM cells. In the ER type, the switch sets the EFCI bit of the RM cells to indicate whether there is congestion or not, and sets the ER field to indicate the bandwidth the VC should use. The performance results and comparisons between two types of switches are shown in [13] in detail.
When the SES receives a backward RM cell, it modifies its ACR using additive increase and multiplicative decrease. The new ACR is computed as follows, depending on CI:
ACR = max(min(ACR
+
RIF-
PCR, E R ) , M C R )if CI = 0 AC'R = max(min(ACR
.
(1 - R D F ) , E R ) , MCR) if CI = 1 where RIF is the rate increase factor and RDF is the rate decrease factor.In this paper, we focus on the EFCI switch and use a simple model as shown in Fig. 1. There are N,, homogene-
ous traffic sources sharing a bottleneck link where the bandwidth is BW. We assume that each SES always has
cells to send. This assumption allows us to investigate the performance of an EFCI switch in the most stressful situa- tions.
I.
Tsx I_ Txd4
Qh QI
Fig. 1 Analytic model for rate-bmedflow control
Congestion condition is determined by the switch accord- ing to its queue length. There are two values, high thresh- old Qh and low threshold Ql, which decide whether congestion occurs or not. When the queue length exceeds
Qh, the EFCI bit of passing data cells is set to one to indi- cate congestion. Congestion is relieved when the queue length drops below Q!.
We define ,z as the propagation delay between the SES
and the switch, and zxLi as the propagation delay between the switch and the DES. Also, the feedback propagation delay from the switch to the SES is denoted by zxh, and the round trip propagation delay is denoted by z. Thus we get the relation zxd = ,z
+
2 t x d and z = 2(z,+
zxd). The prop-agation delay is a critical parameter of system performance. Note that the buffer at the switch is of finite capacity denoted by Qe. Due to this fact, the arrival cells shall be lost when the buffer is full. The act of cell loss causes the derivation of the dynamic behaviour of the allowed cell rate, ACR(t), and the buffer size, Q(t), to have some differ- ences with other previous studies.
3 Basic description
We describe the four elementary phases and four different cycles in this Section. A cycle is composed of some elemen- 96
tary phases. Depending on the various compositions of the phases, four different cycles are constructed.
3. I Elementary phases
The evolution of the ACR can be characterised into four elementary phases differentiated by (i) the increase or decrease of the ACR, and (ii) the speed of the increase or decrease. The speed of adjustment is determined by the rate at which RM cells are received in the SES. Meanwhde, ths rate is influenced by the status of the buffer qd3 time units before. So, actually the evolution of the ACR is partitioned into four phases depending on the ACR(t) and Q(t - zxdJ.
Phase 1: ACR(t)
t,
Q(t - zxdJ > 0: During this period,each SES receives the backward RM cells with CI = 0 at constant rate BWINv$rm. When a backward RM cell is received, the SES increases its ACR by RIF . PCR, to a rate not greater than PCR. We use a continuous time approximation to model this discrete increase for simplicity. This approximation is accurate to characierise the dynamic behaviour of rate-base control [14]. Thus the following dif- ferential equation for ACR,(t) is giver, by:
dACRl ( t ) - BW . RIF . PCR dt NucNrm - which gives ACRi
( t )
BW.
R I F . P C R t , p C R NVCNT, (1)Phase 2: ACR(t) J, Q(t - zxd3) < Q,: During this period,
each SES receives the backward RM cells with CI = 1 at constant rate B W I N V f l r m . When a backward RM cell is received, the SES reduces its ACR by ACR . RDF? to a rate not lower than MCR. We thus have the following continu- ous approximation for ACR,(t).
dACR2(t) = -ACR2(t) B W . RDF
dt NVCNT,
which gives:
ACRz(t) = max ( A C R 2 ( 0 ) C z B W . R D F t ,MC'R)
(2)
Phase 3: ACR(t)
T,
Q(t - rXh) = 0: When the buffer isempty, the switch is not fully utilised. In order not to waste the bandwidth with idle time, we ought to avoid the occur- rence of this phase. In this phase, RM cells arrive at the SES depending on its own rate z time before (i.e. ACR,(t -
z)). So, the differential equation for ACR3(t) is given by:
which gives:
ACR3(t) = min (ACR3(0)ePt, PCR) (3) where /3 is given as the root of the equation /3 = (RIF '
PCNNrm) e-t?
Phase 4: ACR(t) J, Q(t - txdJ = Q,: When the buffer is
full, the arrival cells are discarded at the switch. In order not to waste the bandwidth with retransmission of the lost cells, we also hope not to enter this phase. In this phase, although the cell loss happens, RM cells arriving at the
SES are still the same as in the previous phase. This is
caused by the delay of cells queued in the buffer. After the time QJB W which is the queueing time of cells when the buffer is full, the receiving rate of RM cells at the SES will
change because of the lost cells. For example, if we assume that only data cells can be discarded and RM cells are never lost at the switch, the number of data cells between two consecutive RM cells sent from the same SES are N,.,BWINv$CR(t), not N,. That is, after the time
Qd
B W , the rate of the SES receiving the backward RM cells will change from BW/NvJV,., to ACR(t - QB/BW)IN,.,.In most cases, the interval QdBW is long enough that the change happens after t h s phase. Hence this change causes the derivation of subsequent phases to be incorrect. Fortunately, data cells and RM cells are both discarded in the switch when the buffer is full. So, the number of data cells between two consecutive RM cells can be approxi- mated as N,. These approximations show that the deriva- tion of the above phases is still valid. The behaviour of ACR during this phase is given by:
BW
.
RDF= -ACR,(t) dACR,(t)
dt N 7 J C N T T n
ACR4(t) = max (ACRl(O)e--', MCR)
Although the equations of phase 2 and phase 4 are the same, we differentiate between them since there is dflerent meaning.
Note the M CR and PCR are not considered in the anal- ysis below since we assume MC R = 0 and PCR = BW.
The analysis of M CR > 0 or PCR < B W can be expanded from our analysis, but the equations are more complex.
3.2 Various cycles
According to the elementary phases described in the last Subsection, four dlfferent cycles are constructed. In all four cycles, phase 1 and phase 2 are the essential phases. The cycles are dlfferentiated by whether phase 3 and phase 4 occur or not.
Best cycle: This perfect cycle is composed of phase 1 and phase 2. They occur alternatively as Fig. 2. When the queue length is below the low threshold (i.e. at the time tQ,)
congestion is relieved in the switch, and t h s congestion relief signal wdl arrive at the SES after the propagation
delay zxh. Then the SES increases its ACR and phase 1 begins. For convenience in explaining the time shift between ACR(t) and Q(t) caused by the propagation delay, we use the ti and t- to denote the 'after zxh' and 'before
'
z,
time units from the time t, respectively. So, the phase 1begins at t&, and s d a r l y , the beginning time of phase 2 is ti,! where tQ,, is the time that queue length exceeds
eh.
whch gives (4) ACRlt) - time [ AtQ, n " t ~ l %nin tQh timeFig.2 Evolution of ACR and Q in best cycle
Let to and tl be two time stamps for our analysis. At the time to and t,, ACR is equal to BWIN,,.
Worst cycle: Phase 3 and 4 occurs in this worst case. The cycle behaves as in Fig. 3. In this Figure, phase 4 interrupts phase 2 and phase 3 interrupts phase 1.
Fig.3 Evolution of ACR and Q in worst cycle
When the queue length exceeds Q B , cell loss starts. Hence
phase 4 begins at the t i B , and consequently, the ending time of phase 4 is after z from to. This is because the aggre- gate cell arrival rate at the switch is below the bandwidth
BW at time to, and the queue starts to decrease after the propagation delay between the SES and the switch,
zyr
Similarly, the starting time of phase 3 is t&, where tQ is the time that queue length reaches zero, and the ending time of phase 3 is z time units after the time tl.
Cell loss cycle: During this cycle, phase 4 occurs and phase
3 does not occur. From Figs. 2 and 3, the sequence of this cycle is phase 1-2-42. Also, the beginning time of each phase is obtained in the same way as before.
Under-utilisation cycle: Phase 3 occurs and phase 4 does not occur in this cycle. The sequence of this cycle is phase 1-3- 1-2.
4
If we do not carefully choose Qh and Ql, not only do the phase 3 and 4 occur, but also the duration of each becomes
longer (i.e. more bandwidth is wasted). In t h s Section, we investigate how to choose the Qh and Ql to prevent the sys- tem falling into the worst cycle. As shown in Figs. 2 and 3, the evolution of ACR and queue length are deterministic. Hence we can use a differential equation approach to obtain minimum queue length, Qminr maximum queue
length,
emax,
and cycle time Tcj,cle. Because the derivations are quite complex and trivial, the processes are explained in the Appendix. Note that the derived Qrnx and Qmin are notlimited (i.e. the value of QrnX might be bigger than the buffer size and the value of Q,, might be less than zero).
4.
I
Cell loss probability and utilisationThe wasted bandwidth in the cell loss probability and utili- sation of four various cycles are calculated as follows.
Best cycle: Q,, s Q B and Q,, 2 0: In this cycle, the maxi-
mum queue length is less than the buffer size in the switch. Also the minimum queue length is larger than zero. In this perfect case, cell loss probability is zero, P,oss = 0, and utili- sation is 1, p = 1.
Choice of high and low thresholds
Worst cycle: Qmx > Q B and
em,
< 0: The events of cell loss and under-utilisation occur in this worst case.As
we know, when the maximum queue length is larger than the buffer size, the system enters phase 4 and some cells are lost to keep the maximum queue length as buffer size. Simi-larly, when the minimum queue length is less than zero, the system enters phase 3 and some bandwidth is wasted because of the idle time.
Hence the wasted bandwidth and the number of the lost cells in this cycle are given by:
Nwaste = 0 - Qmin
N l o s , = Q m a x - Q B
( 5 ) ( 6 )
Now utilisation and cell loss probability are:
(7)
Cell loss cycle: Q- > Q B and Q,, 2 0 For the cycle
where phase 4 occurs and phase 3 does not occur, utilisa- tion is 1, p = 1, and cell loss probability is directly com- puted from the worst cases. Nloss and Pro,, are obtained from eqns. 6 and 8.
Under-utilisation cycle: Qm s Q B and
em,
< 0: For thecycle where phase 3 occurs and phase 4 does not occur, cell loss probability is zero, PI,,, = 0, and utilisation is directly computed from the worst cases. N,,, and p are obtained from eqns. 5 and 7.
The derivations of PlosJ and p of four various cycles can be integrated by modifying eqns. 5 and 6 to Nwas, = max(0, 0 -
em,)
and Nloss = max(0, Qmax - Q B ) , respectively. We differentiate them to emphasise the distinction of these cycles.4.2 Choice of Qh
and
Q,That Qm, is influenced directly by Ql is obviously observed from above equations. Meanwhile, Q,, is also influenced by ACR,, which is determined by min(QB,
e-).
Hence we use the functionf
to denote the complex expressions. Similarly, let g be the function to calculate Q,,.Qmin
f
( Q L ,
m i n ( Q ~ , Q m a z ) ) Q m a x = g ( Q h , Q m i n ) )To keep the system operating in the best cycle, we define ‘best area’ to determine how to set the high and low thresh- olds. When the point of high and low thresholds is located in the best area, good performance is guaranteed, namely, utdisation is one and cell loss probability is zero. Note the best area may not exist if N,, or zis large. Ir
First, we get two thresholds Q; and,Qh by solving the equation 0
=fie;,
Q J and Q B = gQ, 0). The best area can be obtained according to Q; or Qh.
None the less, the same best area is obtained whether according to Qh* or Q;. Below, we only discuss the solution according toQi:
Case 1: Qh = x 2Qi:
In this case, Q,, must be larger thanzero to avoid cell loss (i.e. the expected value Qik is the solution of the equation QB = g(x,
e:,)).
Also, we getQr
by solvingpm,
=A@,
QB). Therefore, we get the best area (Qh = X,QI
Case 2: Qh = x < Q;: In this case, the main concern is to avoid the occurrence of underutdisation. We get
Qim
by solving the equation Q& = g(x, 0), and get Qf by solving the equation 0 =AQf,
e;
,).
Therefore, we get the best area ((2h = X,QI
=[Q?,
4).
[er,
-4).
98
Loolung at Fig. 4, we partition the space into five areas. If (QZ, Ql) is located in the area ‘best’, the system w d oper- ate in the best cycle. If Qh >
Qi
and Ql < Q;, that causesQm > Q B and
emin
< 0, the worst cycle occurs. Similarly, areas ‘cell loss7 and ‘under-utilisation’ correspond to the cell loss cycle and under-utilisation cycle, respectively. Area ‘nonexistence’ does not exist because we cannot set Qh < Qi.3000
0 1000 2000 3000
Qh
Fig4 Five areas to deternine Q,, and Q,
Rules: (i) When Q; 2 Q;, good performance can be
achieved. We set
(eh,
Ql) to locate in the best area. Also to provide more number of connections and larger propaga- tion delay, we ought to set ( e h , Ql) to close the centre point of the best area as much as possible. (ii) WhenQi
< Q;, good performance cannot be achieved. When we feel the effect of cell loss is more serious than the effect of under- utilisation, such as loss-sensitive applications, we set (Qh =eh”,
Ql = Q;) to avoid cell loss. (iii) WhenQi
<QP
and applications are delay-sensitive, we set(eh
=QP,
Ql = Q;) to avoid under-utilisation.In a real system, we can create a table of the best areas for the main situations. When the number of sources or the propagation delay changes, the switch can check the table to find the proper values of Qh and Qk
5 Simulation and discussion
Some examples are presented to show the correctness of
our analysis of cell loss probability and utilisation. The parameters of the overall systems are set to N,,, = 10, B W =
155Mbps, PCR = 155Mbps, ICR = PCRI20, RIF = 1/64,
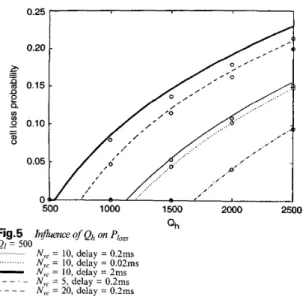
Qh = 2500, and Ql = 500.
Fig. 5 shows the cell loss probability as a function of the high threshold. There is a good agreement between the analytical and simulation results, whch are shown by cir- cles. The small gaps are due to the continuous time approach and the synchronous assumption in the analysis. When Qh is set too high, Ploss increases. This is because the detection time of congestion is too late. Also as Nvc becomes larger, cell loss probability is larger. When N,, becomes big, the increase speed of total allowed cell rate,
Nvc . ACR, does not change (i.e. the speed is still B W . RIF
. PCR/Nrm). Hence the maximum total
ACR
(N,,c .ACRm,) does not change. However, the decrease speed of total
ACR
slows down. Therefore, cell loss probabdity increases. When the propagation delay becomes longer, the detection time of congestion between the switch and the sources becomes longer. The slower detection at the sources leads Ploss to increase.R D F = 1/16, zsizxd = 1:1, Z = 0.2ms, N , = 32, Q B = 3000,
A
.- 0 % 0.15 - ne
- .- P U) - 2 0.10 - - - a, 500 0.20 ~ .- 0 % 0.15 - ne
- .- P U) - 2 0.10 - - - a, 0.05 - 00 500 1000 1500 2000 2500 Qh Fig.5 Q l = 500 ~-
- - _ _ h$'uence of Qh on Ploss Nu, = 10, delay = O.2ms N,, = 10, delay = 0.02ms N,, = 10, delay = 2ms N,, = 5 , delay = 0.2ms N,, = 20, delay = 0.2ms ... Fig.5 ~ Influence of Qh on Ploss N,,? = 10. delav = O.2ms Q l = 500 d e l 6 = 0.02ms delay = 2ms lelay = 0.2ms delay = 0.2msActually the value of Qh not only directly influences QMx, but also indirectly influences
emin.
Hence we also observe the influence of Qh on the utilisation in Fig. 6. In the case with no cell loss, utilisation drops quickly when Qh increases. However, in the case with cell loss, p rises slightly when Qh increases. As we know, the increment of Qh directly causes Qmx to uprise. In the case with no cell loss, the increment of Q,, will cause Q,, to drop, with the result that utilisation decreases. But in the case with cell loss, Q,, is influenced by QB, not by Qw Hence the wasted bandwidth of under-uthsation does not change. However, the increment of Qh causes the interval AtQh, which is that the queue length increase from Qm, to e h , tolast longer. Hence the total cycle time is longer and thus, utilisation increases. 1 .oo 5 0 0 0.97 !- d I I 500 1000 1500 2000 2500 Qh Fig.6 I n j l m e of Qh on p QI = 500 ~ N,, = 10, delay = 0.2ms N,, = 10, delay = 0.02ms
-
N,, = 10, delay = 2ms N,, = 5, delay = 0.2ms - - _ _ N,, = 20, delay = 0.2ms ...Note that the case of NVc = 20, z = 0.2ms has no underu- tilisation. This is because Q;' is less than Q,, which is 500 in this experiment. The s d a r condition also happens in the case of N,, = 10, z = 0.02ms.
Figs. 7 and 8 show the utilisation and cell loss probability as a function of Ql, respectively. Again, the analytical and simulation results agree well. The same reasons mentioned above can be applied.
We observe the influence of the number of connections and the round-trip propagation delay, on the best area in IEE Proc-Commun.. Vol. 146, No. 2, April 1999
0.25
r
I 500 1000 1500 2000 2500 0 QI Fig.7 __-
. _ .~ Influence of QI on Ploss N,, = 10, delay = 0.2ms N,,< = 10, delay = 0.02ms N,, = 10, delay = 2ms N,,,. = 5, delay = 0.2ms N,, = 20, delay = 0.2ms Qh = 2500 ... - _ ~ Ql Fig.8 Influxace of Q, on p QjZ = 2500 __ N,, = 10, delay = 0.2ms N,, = 10, delay = 0.02ms-
N , , = 10, delay = 2ms N,, = 5, delay = 0.2ms N , , = 20, delay = 0.2ms ... . - .. _ -~~ "0 500 1000 1500 2000 2500 3000 Qh Fig.9 __-
_ _ _ _Cornparkon of best areas among d&rent N , and T
N,, = 10, delay = 0.2ms Nu, = 10, delay = 0.02ms N,, = 10, delay = 2ms N,, = 5, delay = 0.2ms N,, = 20, delay = 0.2ms Qh = 2500 ...
Fig. 9. When Nyc becomes large, the best area shrinks, and the centre point of the area slightly drops. The reason is
that cell loss probability and utilisation increase when the number of sources increases. Hence
QL
and Q; is lower in 99the condition of no cell loss and full utilisation. Siinilarly, when ’r becomes large, the best area shrinks. In this case, however, the centre point of the area does not drop. This is caused by the growth of cell loss probability and the reduc- tion of utilisation when the propagation delay becomes large. Note that the best area of N,, = 10, z = 2ms is empty because of
eh*
< Q;.6 Conclusions and future work
In ths paper, an analysis for rate-based flow control is pro-
vided. The equations of cell loss probability and utilisation are derived. When the number of sources increases, the cell loss probability increases and utilisation increases. How- ever, when the propagation delay is lengthened, the cell loss
probability increases and utilisation decreases.
The concept of ‘best area’ help us to determine the high and low thresholds. By setting the high and low thresholds in the best area, the system can achieve good performance. When the number of connections becomes larger or the propagation delay becomes longer, the best area shrinks.
When the best area shrinks to empty, cell loss or under- utilisation is unavoidable. Nevertheless, rules 2 and 3 are provided to prevent unnecessary cell loss or under- utilisation.
In the future, some directions are also our concerns. First, the generated traffic of sources is usually bursty. The assumption of greedy sources could cause an overestima- tion of Qh and Ql resulting in under-utilisation. Hence the choice of these thresholds under the bursty sources shall be studied. Secondly, the model of a single switch should be expanded into the model of multiple switches. The approach for a multiswitch model is worth developing. 7 1 2 3 4 5 6 7 8 9 References
SATHAYE, S.S.: ‘Traffic management specification version 4.0’. ATM Forum Contribution 96-tm-0056.000, April 1996
CHEN, T.M., LIU, S.S., and SAMALAM, V.K.: ‘The available bit rate service for data in ATM networks’, IEEE Commun. Mug., 1996, 34, (51, PP. 5 6 7 1
FLAVIO, B., and KERRY, W.F.: ‘The rate-based flow control framework for the available bit rate ATM service’, IEEE Nelw., 1995, 9, (21, PP. 2S39
LAI, Y.C., and LIN, Y.D.: ‘Interoperability of EFCI and ER switches 3443
CHARNY, A., RAMAKRISHNAN, K.K., and LAUCK, A.: ‘Time scale analysis and scalability issues for explicit rate allocation in ATM networks’, IEEE/ACM Trans. Netw., 1996,4, (4), pp. 569-581 ALTMAN, E., BASAR, T., and SRIKANT, R.: ‘Robust rate control for ABR sources’. Proceedings of IEEE INFOCOM’98, San Fran- cisco, 1998
BOLOT, J.C., and SHANKAR, A.U.: ‘Dynamical behaviour of rate- based flow control mechanisms’, Cornput. Commun. Rev., 1990, U), (21, PP. 3-9
YIN, N., and HLUCHYJ, M.G.: ‘On close-loop rate control for ATM cell relay networks’. Proceedings of IEEE INFO-COM94, Toronto, 1994, pp. 99-108
I”, N.: ‘Analysis of a rate-based traffic management mechanism for
ABR service’. Proceedings of IEEE GLOBECOM95, Singapore, 1995. DD. 1076-1082
for ABR services in ATM networks’, ZEEE Netw., 1998, 12, (l), pp.
10 RAI\;IxMURTHY, G., and REN, Q.: ‘Analysis of the adaptive rate control for ABR service in ATM networks’. Proceedings of IEEE GLOBECOM’95, Singapore, 1995, pp. 1083-1088
11 OHSAKI, H., MURATA, M., SUZUKI, H., IKEDA, C., and MIYAHARA, H.: ‘Analysis of rate-based congestion control algo- rithms for ATM networks, Part 1: Steady state analysis’. Proceedings of IEEE GLOBECOM’95, Singapore, 1995, pp. 296303
12 OHSAKI, H., MURATA, M., SUZUKI,H., IKEDA,C., and MIYAHARA, H.: ‘Analysis of rate-based congestion control algo- rithms for ATM networks, Part 2 Initial transient state analysis’. Pro- ceedings of IEEE GLOBECOM’95, Singapore, 1995, pp. 1095-1101 13 OHSAKI, H., MURATA, M., SUZUKI, H., IKEDA, C., and
MIYAHARA, H.: ‘Rate-based congestion control for ATM net- works’, Comput. Commun. Rev., 1995,25, (2), pp. 6&72
14 RITTER, M.: ‘Network buffer requirement of the rate-based control mechanism for ABR services’. Proceedings of IEEE INFOCOM’96, San Francisco, 1996, pp. 119e1197
100
8 Appendix
Depending on which phase the time marking is located in, different cases should be considered. For example, t& can be in phase 1 or phase 2, and t a , can be in phase 3 or phase 1. However, when we carefully set the Qh and Q,
according to the rules described in the section 4, the time between te, and tQo is long and the duration of phase 3 is short. Therefore, most situations shall be the case shown as Figs. 2 and 3. Due to a lack of space, we will only derive the equations of the cases in Figs. 2 and 3.
At time to, the aggregate cell arrival rate at the switch is below bandwidth, BW, and queue starts to decrease after the propagation delay between the SES and the switch, q,. After the time Atel, the buffer content reaches the low threshold, Ql, and the ACR at the SES stops decreasing at
t& Although this period crosses phase 2 and phase 4, the same dynamic behaviour exists for phase 2 and phase 4. Thus we have
At Q
,
1
BW (1 - e--‘ )
dt = min ( Q m a z , Q B ) - Ql0
Hence the time interval AtQl is got as the root of:
The minimum rate, ACR,,,,, is given by: BW B W - R D F
ACR . - -e N,,N,,, ( A t ~ l - t r )
Let ACR,(t) be the evolution of the ACR from time to, which is gven by:
mzn -
NU,
At the time that the ACR becomes minimum, the SES begins to increase its ACR and the system enters phase 1. After the time At&,,n the aggregate cell arrival at the switch is over B W. Hence we get:
Nrm (BW - N u c ACRmtn) BW * R I F
.
PCR%,zzn =
Now the minimum queue length, Q,,,,, is given by:
Qmzn = min(Qmaz, Q B ) At,, +r -
1
(BW - N u ,.
ACRt,(t)) d t - r t n ( B r U - Nu, ACR,(t))dt 0 At, 0Using ACR1(0) = ACR,,,,, Atec, At&n, and ACRto(t) from the above equations, finally we have:
Q m Z n = Q i - T . BW
-
r > N,,Nrm+
~ . e N v C N w n t g i . (1 - e- NvcN,.rL - Nmn(BW - Nuc.
ACRmzn)2 R D F 2 . B W . R I F . PCR (9) If Qmm is larger than zero, phase 3 does not occur, and nobandwidth is wasted. On the other hand, if Qmm is less than IEE Proc -Cornmm Vol 146 No 2 tlpirl 1999
zero, phase 3 occurs. Below we consider two cases accord-
ing to whether phase 3 occurs or not. Case I : phase 3 does not occur
First, we get the equation of the interval Ateh, which is the time that the queue length increases from Qrmn to Q h .
Since the increasing rate of ACR at each SES is ( B W . RIF . PCR)/(N,,
.
Nr,) from eqn. 1, we get:2Nrm(Qh - Q m i n ) The maximum rate, ACRmx is given by:
At the time that the ACR becomes maximum, the SES begins to decrease its ACR and the system enters phase 2. After the time A ~ G ~ , the aggregate cell arrival at the switch is below BW, and the queue length begins to decrease. So we have: B W . R D F At- ACR,,,e N v c N r m . Q m a z = BWIN,, whch is solved as: NwcNrm BW - BW . RDF log N,,
.
ACR,,, at,m,, =Now the maximum queue length, Q,,, is given by:
At,, +T
.
t ) dt B W . R I F . P C R NT, Q m a x = Q m i n . +J
(
0 A t G m a z+
1
(Nut . A C R , ( t ) - BW)dt 0Using ACR2(0) = ACR-, AtQ,,, At&m and ACR2(t) from above equation, fmally we have:
Q m a X = Q h NwcNrm RDF (10) -
9
Nu,.
ACRmax + BWCase 2: phase 3 occurs
T o obtain the ACRmx in this case, first we compute the
length of phase 3, AtwQste, as:
Atwaste = -
where A t , is the interval between the time of the mini- mum rate and the time t& We get AtQo by solving the equation, 0 = d n ( Q ~ , Q m a z ) At,, - k ~ -
1
( B W - N u ,.
ACRt,(t))dt 0 At;, -/
( B W - N,, + A C R l ( t ) ) d t 0Now we calculate the ACRm.x:
BW BW . R I F . P C R Nwc NucNTm ACRs(0) 1 -
+
(r - Atwaste) in phase 1 in phase 3 ACRl ( 0 ) = ACR3(0)ePAtwaste B W . R I F . P C R NucNrm At,,& ACRG, zz A C R l ( 0 )+
in phase 1 7 B W . R I F ' P C R NwcNrm ACR,,, = ACRGh+
in phase 1where A t , is the interval between the beginning time of
phase 1 and the time le,,. We get AtGh by solving the equa- tion, 0 A t w a s t e
+
1
(N,,ACR3(0)ePt - B W ) d t 0 A t , - B W ) dtThe maximum queue length is obtained as:
c