Abstract
In this research, commercial digital cameras and computers are applied for developing a low-cost digital image correlation coefficient method for deformation measurement. The practicability of this technology using a single camera to collect images for analyzing the coefficient technology is confirmed. The test results reveal that the first mode shape of test beam with and without defect can be easily detected by this proposed method. The test curves, calculated based on the tests, are highly correlated to the theoretical variation curves. These results are practical for achieving the objective of real-time on-line monitoring of building movement and deformation.
Keywords: digital image correlation method, healthy diagnosis of structure, dynamic digital image correlation method, real-time on-line monitoring of building.
1 Introduction
Emission of greenhouse gases in recent years has led to global warming those results in rising sea level and sea water temperature. Additionally, the vigorous sea bed volcano activities cause frequent occurrence of global earthquake. Taiwan is located on the joint edge of the Eurasian, Pacific, and Philippine Plates, with island climate. Hence, the shortening of earthquake period and increasing precipitation intensity seriously threaten the life and property of people living in Taiwan. Previously, prevention of earthquake disaster is an emphasized engineering concern for protecting properties and lives. The climate change caused by greenhouse effect leads to more frequent typhoon that causes flood, land slide and river bed erosion to bring about great economic loss and property damages with equal magnitude as earthquake. Additionally, human factors such as improper project management and building construction causing frequent building collapse and failed grouting operation is often heard in recent years. Hence, strengthening the building
quake-Paper 65
Using the Digital Image Correlation Technique to
Measure the Mode Shape of a Cantilever Beam
M.H. Shih1, W.P. Sung2 and S.H. Tung31 Department of Civil Engineering
National Chi-Nan University, Nan-Tou, Taiwan
2 Department of Landscape Architecture
National Chin-Yi University of Technology, Taichung, Taiwan
3 Department of Civil and Environmental Engineering
National University of Kaohsiung, Taiwan
©Civil-Comp Press, 2010
Proceedings of the Tenth International Conference on Computational Structures Technology, B.H.V. Topping, J.M. Adam, F.J. Pallarés, R. Bru and M.L. Romero, (Editors), Civil-Comp Press, Stirlingshire, Scotland
resistance capacity, controlling construction quality, and implementing new quake-resistance technology will assist new buildings in sustaining natural disasters. For older buildings, evaluating and strengthening the structural capacity to resist earthquake require the establishment of structural function monitoring system and diagnosis methods for understand the conditions of the building in question. Monitoring the building functions has two aspects of practical uses: (1) providing early warning, evacuating and strengthening the buildings, and (2) allowing comparison of the structural function before and after damages so that the building can be strengthened or replaced. Traditional measurements of structural deformation, external force, and acceleration using sensitive instrument will provide the needed information but the cost involved is too high to be practical. In this study, a new cost-effective and reliable monitoring method will be developed based on developing and applying the digital photographing technology in monitoring building deformation and movement.
The Digital Image Correlation (DIC) is a method proposed by Peter et al [1] in 1982 for obtaining surface movement and strain using computers to analyze the digital images of an object subject to external force. Chu et al [2] in 1989 proposed the use of correlation coefficient between the deformation theory and digital images, and the interpolation method for expanding the application of this method. In 1989, Bruck et al. [3] suggested the use of Newton-Raphson method to replace the coarse-fine method for obtaining the optimal deformation parameters. Sutton et al. [4] in 1991 suggested a method for reducing the analysis noise. Lu et al [5] proposed a high-order interpolation function for simulating the movement field to study the influence of the slope of high-order movement terms on the application of DIC for strain analyses. Vellinga et al [6] in 2000 reported the success of combining scanning electronic microscopy and DIC to observe nano-scale movement.
For practical application, Tong [7] in 1997 applied DIC in studying the plastic deformation of magnesium-aluminum alloy. Vendroux [8] in 1998 used the scanning tunneling microscopy and DIC to perform nano-scale deformation. This method saves about 25% of time and increases the stability of analysis convergence as comparing with the traditional Newton-Raphson method. Additionally, many old buildings in Europ were constructed by laying stones joined with mud mortar. In 2001, the French researcher Raffard et al. applied DIC in measuring the deformation of stone and mud mortar to conduct a series of experiment for mud mortar of various width and height to gain insight of the deformation behavior of stone and mud mortar. Kuo et al. [10,11] used the method proposed by Raffard et al in analyzing the plastic deformation of bi-crystal aluminum plate and visualizing the deformation process. Tatschl et al. [12,13] in 2003 successfully used the scanning electronic microscopy and DIC for photographing and analyzing the plastic behavior of copper and polycrystal.
The concept of structural health monitoring is to evaluate the residual functionality of a structure based on the force (static or dynamic) exerted on the structure with emphases on the response of the structure when it is subject to
dynamic or static forces [14]. When a structure is damaged to a certain degree, its stiffness is lowered to change the structural frequency of vibrating module and characteristics of vibrating vectors; these factors can be used for evaluating the degree of structural damages. Hence, the structural diagnosis requires the constant dynamic monitoring of the structure in question including collecting information on acceleration and displacement in order to conduct the structural behavioral mode analyses [15-16]. Finally, the structural damages are defined using well-defined indices that include: (1) Inter-Store Drift Mode Shape, IDMS, (2) Approximation Story Damage Index, ASDI, and (3) other damage indices that are based on the first vibrating behavior as the damage indices. Basically, DIC can be used to distinguish individual vibrating mode so that all the above indices are included as references.
Our research team [17-19] has applied the DIC method for observing cracks developed in brick walls, microscopically observing metal anisotropic behavior, observing warp cracks developed in reinforced concrete, testing steel plate damages mechanically, studying cracks developed in brittle material, observing warp cracks developed in light aggregate concrete, and monitoring bridge deformation under traffic loads. In this research, the digital image analysis technology with capability of re-construct 3-D information, which is based on the establishing the correlation coefficients of digital images, for analyzing building vibrating mode will be developed and verified.
2 Methodology
The technology developed in this research is based on the “Recognition Algorithm” using digital image correlation (DIC) for comparing the local correlations of two images for evaluating the local correlation relationship between the images of an object before and after deformation. Using the finite element method, the images are divided into small mesh; the total gray scale values of mesh in original image can be compared with those in the image after deformation so that the corresponding location of a selected mesh in the deformed image can be identified. Knowing the relative locations of mesh before and after deformation, the total strain of various mesh can then be calculated. The 3-D DIC and dynamic analysis method is illustrated as follows:
2.1 The digital image correlation method based on a single digital
camera with 3-D digital images
Two or more cameras have been widely applied for conducting 3-D monitoring; however, the parameters to be calibrated are excessive. Numerous parameters such as the distance between two cameras, angles and the 6-phase relative parameter, and camera-related parameters such as lens distortion, and photosensitive element, need to be accurately calibrated or the resulting 3-D accuracy is worse than 2-D accuracy. Hence, in this research, the methods for using a single 3-D camera will greatly
reduce the number of parameters to be calibrated so that the 3-D accuracy can be greatly enhanced.
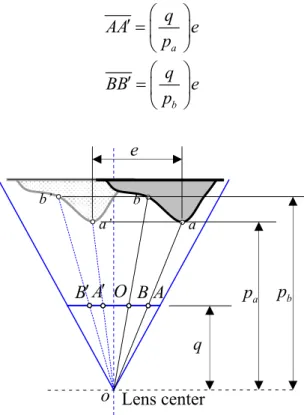
If the horizontal distance for the camera to move to the right (or the object to move to the left) is “e”, the horizontal displacements on the photosenstive element is “ AA ′ ” for a relatively closer point “a”, and “ BB ′ ” for a relatively farther point “b”
as shown in Figure 1. The geometric relationship is:
a q AA e p ⎛ ⎞ ′ = ⎜ ⎟ ⎝ ⎠ (1) b q BB e p ⎛ ⎞ ′ = ⎜ ⎟ ⎝ ⎠ (2)
Figure 1: The parallax phenomenon caused by the difference of object distance Where: q , p and a p are the distance between center of lens and photosensitive b
element, point a and point b respectively. The horizontal movement on the sensing element is expressed in pixels, thus:
AA a q N e p γ ′ ⎛ ⎞ = ⎜ ⎟ ⎝ ⎠ (3)
Where: γ is the number of pixels of a unit sensing element in pixelsmm; NAA′
is the horizontal displacement of “a” in pixels. Because the correct values of γ and
q are unknown, these two parameters can be combined into a single parameter “Λ”. Hence: q γ = Λ (4) B A′ q a p p b O a’ b’ B′ A a b e o Lens center
Equation (3) can be re-written as: AA a N p e ′ Λ = (5)
The value of Λ can be found using calibration algorithm; the object-distance p b
can then be calculated:
b BB p e N ′ Λ = (6)
Knowing the object-distance of any point, the horizontal and vertical coordinate with respect to the lens center (x,y) can be found. Equation (6) can be used to
calculate the distance of any object “b”, and the theoretical error can be estimated by
differentiating the equation:
2 b BB BB e dp dN N ′ ′ −Λ = (7)
Equation (7) indicates that the error is inversely proportionally to the distance between the object or the camera distance. Hence, a greater camera distance will lead to more precise results.
When the camera is horizontally moved “e” distance, the horizontal displacement in pixels of “a” on the sensing element is NAA′. If the horizontal coordinate of “a” with respect to the lens center is x , its relationship to the photo horizontal a
coordinate X fits the following relationship: A
A A A a N e X x ′ = (8)
Moving the terms, one obtains:
A A A a N e X x ′ = (9) Similarly: A A A a N e Y y ′ = (10)
A well-polished plane with obvious “structural speckles” marked with precise coordinates is subject to the aforementioned 3-D test. Using a plane testing object
assures that all measured values of x, y, z coordinates fall on a single plane. Hence, regression analyses of all measured points will result in a regression plane that is a true optimal plane equation for calculating the distance of various points to the regression plane as the “errors” of these points.
2.2 Dynamic Digital Image Correlation Coefficient Method
Identifying the structural vibration mode must meet two conditions: (1) using instrument that is sensitive to detect displacement or velocity (or acceleration) for reflecting the complicate geometrical conditions of the structure, and (2) collecting dynamic responses with sufficient frequency or sufficient readings for each recoding channel within a unit time.
The first condition can be well met by using the DIC method. For meeting the second condition, using a regular digital camera may not be appropriate. Hence, in this study, Camel Nexshot 2C-2.1M industrial camera with 41 Hz capturing frequency to collect un-compressed photographs with high quality was used, and the image was then analyzed for object displacement using the DIC method. In other words, the structural response with frequency below 21.5 Hz can be fully recorded. The camera is appropriate for analyzing the major vibration mode of ordinary buildings because the contribution of high vibration mode to the total structural response can be negligible, and vibrations of frequencies exceeding 10 Hz are insignificant for earthquake or wind loads. The dynamic DIC analysis uses optical instrument to record the process of object deformation or displacement in digital video. When played back rapid, the images can be animated and viewed with naked-eyes due to persistence of vision for analyzing the object deformation or displacement.
3 Laboratory Analyses
3.1 Plane Examination Use in the Single-Camera 3-D DIC
Prior to conducting the correlation of lens distortion, the 3-D DIC was used to determine the surface coordinates of the testing object; the error caused by a curved plane was then calculated by deducting the z-coordinate of the regression plane. The distribution of errors is bowl-shaped with more than 0.4 mm between the highest and the lowest point for an average object distance of 355 mm, or the error is 1/1000. Hence, the 3-D measurement must be subject to lens distortion calibration. In this research, the radiation warp method is used for calibrating the image coordinates using the same image for analyses to calculate the 3-D error curved plane. As shown in Figure 2, the maximum error is only 0.055mm that is 1/5 of the 0.4 mm obtained without lens distortion correlation. This indicates that the calibration will reduce about 80% error. The absence of curved plane regularity confirms that the problem caused by lens distortion has been satisfactorily solved. In this experiment, the theoretically error as calculated using Equation 7 was
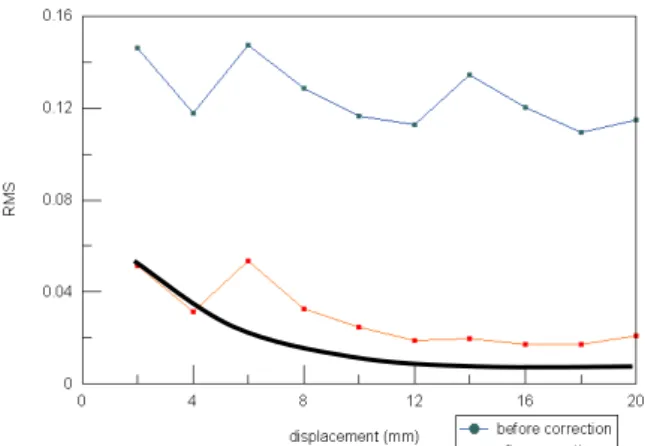
examined by conducting plane examination using camera distances of 2, 4,… 20 mm. The square root of camera distances is shown in Figure 3 that indicates somewhat discrepancies between the DIC and theoretical results (Equation (7)). However, after calibration, the difference between the DIC and theoretical results is greatly reduced confirming that the lens distortion problem has been solved.
Figure 2: 3-D curved surface error after distortion adjustment
Figure 3: The relationship of theoretical and experimental error
3.2 Experiments on Dynamic Digital Images
The dynamic DIC analysis uses optical instrument to photograph the process of testing object deformation or displacement, and animate the images for view with naked-eyes based on persistence of vision. However, if the photographing frequency is relatively lower than the object vibrating frequency, the disassembled images may have dynamic blur that interferes with the gray-scale value of the selected mesh, and further causes lower correlation coefficients between the images of the object before and after deformations, and higher displacement response errors. This may even cause the analysis results not convergent.
The aforementioned experimental problems can be improved by: (1) Selecting adequate points: The points that may lead to poor results should be avoided. Using regression analyses on points that may be precisely analyzed will result in the displacement of inadequate points. Hence, prior to carrying out DIC, the
-0.035 -0.03 -0.025 -0.02 -0.015 -0.01 -0.005 1.7347 0.005 0.01 0.015 0.02 0.025 0.03 0.035 0.04 0.045 0.05 0.055 0 00
coordinates of poorly selected points can be evaluated to benefit the later DIC analyses; (2) Selecting proper photographing frequency: The optical equipment used in this research can be used to take photos at the highest frequency currently available to cameras sold on the market. The relationship between the test object vibrating frequency and the photographing frequency of the camera must be considered in order to reduce the influence of dynamic blur; (3) Calibrating the reference images: In dynamic experiment, the movement of testing object will move within an exposure time unit, and hence the images recorded cover a continuous movement of the testing body. The DIC programs developed in this research use the static initial image as the reference image and compare it with the images (with dynamic blur) of the test object at the end of the movement for calculating the relative movement of the test object. When the test object moves at high speed, the image recorded after movement has a low correlation coefficient with the initial reference image. Hence, the initial reference image is usually enhanced with photographic software for raising the correlation between the initial and the final images; and (4) eliminating noise of the image: The background noise generated by the heat generated by photographic equipment such as the photo-sensing CCD or CMOS when it consumes electricity. The heat causes electrons in these photo-sensing elements to become active thus generating the so-called “black level” to cause background noise. Adequate noise reduction will eliminate the background noise to improve the photographic quality, and the accuracy of the subsequent DIC analyses.
4 Deformation and Damage Evaluation for Structures
with Continuous Parameters
The concerns discussed in above sections are addressed so that static deformations test for structures using continuous parameters to improve the DIC technology for evaluating the structural dynamic deformation and assessing the structural damages.
A reduced-scale cantilever vibrating platform is designed in this research to investigate the applicability of using DIC in monitoring dynamic behavior of a test body. The vibrating platform has the following specifications:
Dimensions: 1398 mm long, 95 mm wide and 20 mm thick Material of the testing object: PP plate
Basic material: 20 mm-pp plate
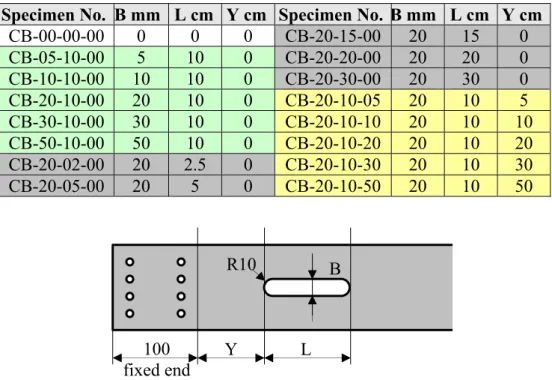
Defect control: Defects with various dimensions and locations were made on the central axis of the test object with a milling machine by reducing the modulus of the cross-section of the test object at where the defect is located. The definition of defect is: B = defect width in mm, L = defect length in cm, and Y= defect starting point in cm as shown in Figure 4. Table 1 lists the test object identification number and definition of defect marked.
Specimen No. B mm L cm Y cm Specimen No. B mm L cm Y cm CB-00-00-00 0 0 0 CB-20-15-00 20 15 0 CB-05-10-00 5 10 0 CB-20-20-00 20 20 0 CB-10-10-00 10 10 0 CB-20-30-00 20 30 0 CB-20-10-00 20 10 0 CB-20-10-05 20 10 5 CB-30-10-00 30 10 0 CB-20-10-10 20 10 10 CB-50-10-00 50 10 0 CB-20-10-20 20 10 20 CB-20-02-00 20 2.5 0 CB-20-10-30 20 10 30 CB-20-05-00 20 5 0 CB-20-10-50 20 10 50
Figure 4: Artificial defects on the end of cantilever beam
Design of “structural speckles” markings: The sides of the cantilever arm was painted white and then marked randomly with 4-mm dark-gray spots on the surface
Installing accelerometers: Accelerometers were installed at the fixed end, the mid-point and the free end of the cantilever arm to record the acceleration response at 1000 Hz. The mass of accelerometers used in this experiment is less than 1.5 g (equivalent to the weight of 0.5 mm test body) so that the influence of accelerometer mass on the vibrating wave pattern and the subsequent acceleration calculation can be alleviated. The test body was fixed on a single-axis earthquake simulator and was subject to simulated vibrations of ramp, sinus, Kobe earthquake, El Centro earthquake, TCU072 Earthquake and self interference. The response was recorded with HD camera for later analyses. Figure 5 shows the installment of the test object on the vibrating simulator.
The cantilever test object has a great length/depth ratio. If the whole arm is shown on the photograph, the depth (divided by sensitivity) is greatly reduced so that the number of pixels along the depth is so limited that the accuracy of analysis is greatly affected. Hence, the primary object of the whole-picture accuracy analysis is to find out problems that may be faced when conducting the subsequent dynamic analyses. Because the major difference between static and dynamic photography is high frequency of photographing (41 frames per second) for dynamic photography to cause “residual image”. Using the static photography will eliminate this problem so that more precise identification of cross-sectional defect and damage can be obtained; 100 fixed end L Y R10 B
Photographic equipment: Canon EOS 400 D DIGITAL single-lens camera with a maximum of 3888x2592 pixels.
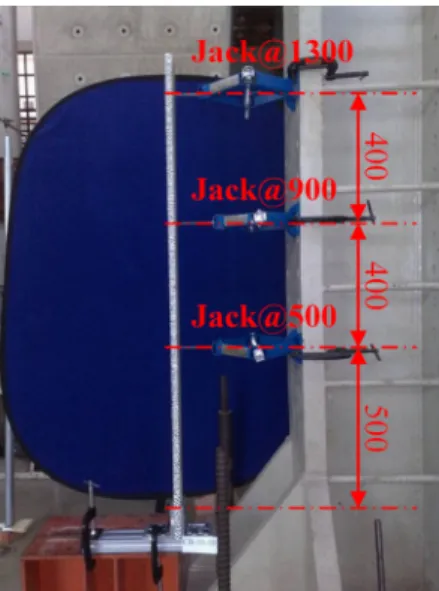
Loading mechanical jack: The loading was applied with mechanical jacks; the first jack was fixed at 500 mm above the fix end of the test body with the top and the rests were installed every 400 mm above the first jack, shown as Figure 6.
Figure 5: A full view of experimental installation
Figure 6: Installation of mechanical jack for applying static loading
Control of the defect width has an obvious influence of the deformation curve obtained using the DIC measurement. Figure 7 shows changes of curvature for the test body subject to various loadings with controlled defect length. The curvature functions in Figure7 were obtained by 4th order regression. The regression functions
can not accurately reveal reality, however they reveal somehow the influence of different defect levels. Figure 8 shows changes of curvature for the test body subject to various loadings with controlled defect initial point. These figures reveal that the curvature change is different in various defect structure. The theoretical deformation curve calculated using damage parameters such as defect width, length and height, and loading conditions has a high correlation coefficient with the laboratory measure deformation curve using the DIC method. Thus, Figure 7 and 8 show that the theoretical damage parameters based on the DIC methods have high accuracy of damage identification.
Figure 7: Curvature variation of specimen with various loading under the same length of defects
Figure 8: Curvature variation of specimen f with various loading under the starting point of defects
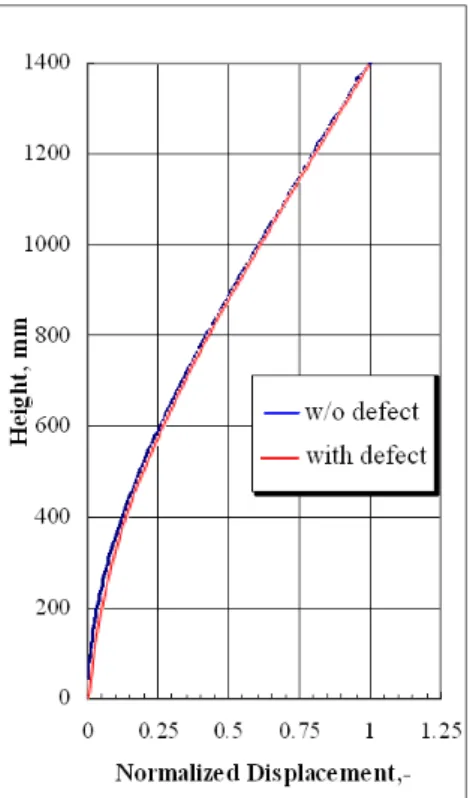
A series of dynamic tests have been processed in this research, Figure 9 reveals the first mode of cantilever beam without defect and with width 20 mm and length 20 cm flaw at fixed end of beam. This first mode is identified by the proposed DIC method to analyze dynamic imagine, picked by 41 Hz. The time history of displacement of the uniform distributed 129 points on cantilever beam can be obtained and then using the system realization with information matrix (SRIM) to find this first mode. Comparison the first mode shape (blue curve) of cantilever beam without defect between the first mode shape (red curve) of cantilever beam with flaws, it indicates that the first mode shape of beam with flaws has comparatively big curvature and it of beam without defect has relatively smooth curvature. This result demonstrates that this proposed DIC method can observe the structure with tiny damage.
Figure 9: The first vibration mode of the cantilever beam without (blue) and with (red) defect at the fixed end.
5 Conclusion
Laboratory studies confirm that the single-camera 3-D plane DIC analysis developed in this research has high accuracy. This method, which has been confirmed to solve the lens warp problem in this study, will allow the use of a single camera to conduct 3-D analysis. Laboratory studies confirm that some strategies initiated in this research is effective in solving the dynamic residual image problem to raise the accuracy of analysis. The laboratory study using a cantilever test object also confirm that the theoretical deformation curve calculated using the proposed DIC method is highly correlated with the laboratory results. This indicated that the accuracy of the proposed method is high enough for applying the proposed method to achieve the object of real-time on-line monitoring of structure.
Acknowledgements
The National Science Council of Taiwan supported this research through grant No. NSC 97-2625-M-327 -002. These supports are gratefully acknowledged.
References
[1] W.H. Peters and W.F. Ranson, “Digital Imaging Techniques in Experimental Stress Analysis”, Optical Engineering, Vol. 21 (3), 427-432, 1982.
[2] T.C. Chu, W.F. Ranson, M.A. Sutton and W.H. Peters, “Application of Digital-Image-Correlation Techniques to Experimental Mechanics”, Experimental Mechanics, 25(3), 232-244, 1985.
[3] H.A. Bruck, S.R. McNeil, M.A. Sutton and W.H. Peters, “ Digital Image Correlation Using Newton-Raphson Method of Partial Differential Correction ”, Experimental Mechanics, Vol. 29, 261-267, 1989.
[4] M.A. Sutton, J.L. Turner, H.A. Bruck and T.A. Chae, “Full-field Representation of Discretely Sampled Surface Deformation for Displacement and Strain Analysis”, Experimental Mechanics, Vol. 31, 168-177, 1991.
[5] H. Lu and P.D. Cary, “Deformation Measurements by Digital Image Correlation: Implementation of a Second-order Displacement Gradient”, Experimental Mechanics, Vol. 40 (4), 393-400, 2000.
[6] W.P. Vellinga and S. Onraet, “Measurement of Strain Fields in the Micron Range”, Proceedings of the joint Meeting of the BVM and the NVvM 2000 in Papendal, Arnhem, 110-111, 2000.
[7] W. Tong, “Detection of Plastic Deformation Patterns in a Binary Aluminum Alloy”, Experimental Mechanics, Vol. 37 (4), 452-459, 1997.
[8] G. Vendroux and W.G. Knauss, “Submicron Deformation Field Measurements: Part 2. Improved Digital Image Correlation”, Experimental Mechanics, 38(2), 86-92, 1998.
[9] D. Raffard, P. Ienny and J.-P. Henry, “Displacement and Strain Fields at a Stone/Mortar Interface by Digital Image Processing”, Journal of Testing and Evaluation, Vol. 29 (2), 115-122, 2001.
[10] J.C. Kuo, S. Zaefferer, Z. Zhao, M. Winning and D. Raabe, “Deformation Behavior of Aluminum Bicrystals”, Advanced Engineering Materials, 5,
563-566, 2003.
[11] S. Zaefferer, J.C. Kuo, Z. Zhao, M. Winning and D. Raabe, “On the influence of the grain boundary misorientation on the plastic deformation of aluminum bicrystals”, Acta Materialia, 51, 4719-4735, 2003.
[12] A. Tatschl and O. Kolednik, “A new tool for the experimental characterization of micro-plasticity”, Materials Science and Engineering A, Vol. 339, Issues 1-2, 265-280, 2003.
[13] A. Tatschl and O. Kolednik, “On The Experimental Characterization of Crystal Plasticity In Polycrystals”, Materials Science and Engineering A, Vol. 342, Issues 1-2, 152-168, 2003.
[14] Raimondo Betti, Structural Health Monitoring Using Vibration Measurement, International Workshop on Structural Health Monitoring and Damage Assessment, Taichung, Taiwan, December 14-15, 2006.
[15] S.W. Doebling, C.H. Farrar, M.B. Prime and D.W. Shevitz, Damage Identification and Health Monitoring of Structural and Mechanical System from Changes in their Vibration Characteristics: A Literature Review”, Report LA-13070-MS, Los Alamos National Laboratory, 1996.
[16] S.W. Doebling, C.H. Farrar and M.B. Prime, A summary Review of Vibration-Based Damage Identification Methods”, The Shock and Vibration Digest, Vol. 30,No.2, pp. 91-105, 1998.
[17] M.H. Shih, S. H. Tung and W. P. Sung, “Development of Digital Image Correlation Method to Analyze Crack Variations of Masonry Wall”, Sadhana Academy Proceedings in Engineering Sciences, Vol. 33, part. 6, pp. 767-779,
2008.
[18] W.P. Sung, M.H. Shih and C.H. Sui, “Digital Image Correlation Technique versus Infinitely Small Element Technique for Crack Analysis of Pipe with Crevice”, 2009 Sixth International Conference on Fuzzy Systems and Knowledge Discovery, IEEE Computer Society, DOI 10.1109/FSKD.2009.419, Tianjin, China, August 13-16, 2009.
[19] J. C. Kuo, D. Chen, S. H. Tung, M. H. Shih, “Prediction of the orientation spread in an aluminum bi-crystal during plane strain compression using a DIC-based Taylor model”, Computational Materials Science , Vol. 42/4 pp. 564-569, 2008.