Fuzzy Hopfield neural network with fixed weight
for medical image segmentation
Chwen-Liang Chang Yu-Tai Ching,MEMBER SPIE
National Chiao Tung University
Department of Computer and Information Science
Taiwan
Abstract. Image segmentation is a process for dividing a given image
into meaningful regions with homogeneous properties. A new two step approach is proposed for medical image segmentation using a fuzzy Hopfield neural network based on both global and local gray-level infor-mation. The membership function simulated with neuron outputs is de-termined using a fuzzy set, and the synaptic connection weights be-tween the neurons are predetermined and fixed to improve the efficiency of the neural network. The proposed method needs initial cluster centers. The initial centers can be obtained from the global information about the distribution of the intensities in the image, or from prior knowledge of the intensity of the region of interest. It is shown by experiments that the proposed fuzzy Hopfield neural network approach is better than most previous approaches. We also show that the global information can be used by applying the hardc-means to estimate the initial cluster centers.
© 2002 Society of Photo-Optical Instrumentation Engineers. [DOI: 10.1117/1.1428298] Subject terms: medical image segmentation; fuzzy clustering; Hopfield neural network.
Paper 010071 received Feb. 27, 2001; revised manuscript received July 19, 2001; accepted for publication July 20, 2001.
1 Introduction
Image segmentation, a process to divide a given image into meaningful regions with homogeneous properties, is an es-sential step in image analysis and recognition. A large num-ber of algorithms, for example Refs. 1–3, have been pro-posed in the past. Those conventional image segmentation algorithms can be categorized generally into three classes: 共1兲 histogram-based schemes, where the pixels are seg-mented into classes based on overall gray levels; 共2兲 region-based schemes, by which homogeneous properties around a given pixel are enlarged; and 共3兲 edge-based schemes, which detect the pixels with abrupt changes in gray levels, and then connects selected pixels to form com-pletely enclosed boundaries.
Recently, neural network-based architectures4 –11 have been applied for image segmentation. Dhawan and Arata4 proposed a two-dimensional self-organizing feature map-based approach that incorporates both local and global in-formation about the gray-level distribution of the image, and explores the useful features of the image to determine and extract meaningful regions of interest. They used the concept of competitive learning to find the overall gray-level distribution of the image as the global information. A contrast measure defining the homogeneity of the region was also used as the local information. In Refs. 5 and 6, the image segmentation process was formulated as a constraint satisfaction problem共CSP兲 by interpreting it as a process of assigning labels to pixels. A three-dimensional constraint satisfaction neural network was developed to form the con-straints in the CSP. A method using a competitive Hopfield neural network 共CHNN兲, based on the global gray-level values distribution, was proposed by Cheng, Lin, and Mao.7 The problem of image segmentation is regarded
there as minimization of a cost function, which, in turn, is defined as the mean value of distance measures between the gray-level values and the members of classes. Lin, Cheng, and Mao8 proposed a fuzzy Hopfield neural network 共FHNN兲, based on the pixel classification, for image seg-mentation. This approach added a fuzzy reasoning strategy into a neural network. In FHNN, the process of image seg-mentation is also regarded as a minimization problem in which the cost function is defined as the Euclidean distance between the gray levels in a histogram and the cluster cen-ters represented in the gray levels. In general, those meth-ods for medical image segmentation make use of the local information, i.e., the gray-level values of the neighborhood pixels, or the global information, i.e., the overall gray-level distribution in the image.
In medical image segmentation, the half volume effect in CT images and the noise in ultrasound images are typical difficulties encountered. The local information-based method cannot correctly find the boundary when the half volume effect is significant. The global information-based method cannot work correctly when there is significant noise, as in ultrasound images. We propose a segmentation algorithm that incorporates both local and global informa-tion for medical image segmentainforma-tion. First, the global gray-level information is used to segment the image for the ini-tial partition, and then local information is used to construct a Hopfield neural network, to simulate the membership function. Each neuron corresponds to a pixel in the image. A pair of neurons are connected if they are neighbors in the image, and the synaptic connection weights are predeter-mined and fixed to improve the efficiency. Second, the fuzzy set approach is applied and a defuzzification process is triggered to determine the outputs of the neurons; and
2 Hardc-Means and Fuzzyc-Means Algorithms The hard c-means and the fuzzy c-means algorithms are well known for classification of points in space into clus-ters. When these algorithms are applied for image segmen-tation, the pixels with similar intensity are gathered into clusters to identify the region of interest. In this section, these algorithms are briefly described for completeness. The details can be found in Ref. 12.
2.1 Hard c-Means Algorithm
A set of n points is denoted as X⫽兵x1,x2, . . . ,xn其 in space. Suppose we divide the set of points into c clusters. It is said that the matrix U⫽关uik兴苸Mnc is a hard c-partition of X if it satisfies the following conditions:
兺
k⫽1 c uik⫽1,兺
i⫽1 n uik⬍n, and兺
i⫽1 n兺
k⫽1 c uik⫽n, where uik苸兵0,1其.The procedure of the hard c-means algorithm is summa-rized in the following steps.
1. Choose a primary set of c points, 兵vk兩k ⫽1,2, . . . ,c其 as the cluster centers.
2. Calculate the membership matrix U based on the minimum Euclidean distance as follows:
uik⫽
再
1, if 共兩兩xi⫺vk兩兩兲2⫽min j⫽1
c
兵共兩兩xi⫺vj兩兩兲2其
, for all i,k. 0, otherwise
3. Update the new cluster centersvˆk,
vˆk⫽兺i⫽1 n 共uik兲共xi兲
兺in⫽1 uik
.
4. If Uˆ⫽U then stop; otherwise go to step 2.
The hard c-means algorithm is easy to implement. But
it is sensitive to the noise in the image.
兺
k⫽1 uik⫽1, 1⭐i⭐n,兺
i⫽1 n uik⬍n, 1⭐k⭐c, and兺
i⫽1 n兺
k⫽1 c uik⫽n,where 0⭐uik⭐1.
The procedure of the fuzzy c-means algorithm is sum-marized in the following steps.
1. Choose a set of points, 兵vk兩k⫽1,2, . . . ,c其, as the initial cluster centers.
2. Calculate membership matrix U for all points to all clusters using the following equation.
uik⫽ 关兩兩xi⫺vk兩兩
⫺2兴1/q⫺1 兺jc⫽1
关兩兩xi⫺vj兩兩⫺2兴1/q⫺1. 3. Update the new cluster centersvˆk,
vˆk⫽兺i⫽1 n 共uik兲qx
i 兺in⫽1共uik兲q .
4. If maxik兩uˆik⫺uik兩⬍⑀, where ⑀ is a stop criterion, then we stop the iteration. Otherwise the iteration restarts at step 2.
The fuzzification factor, q, a given real number which is greater than 1, decides the convergence speed and the sen-sitivity to noise. If q is set to 1⫹, then it converges quickly and is less sensitive to the noise. On the other hand, if q is set to a large number, it will converge slowly and will be more sensitive to the noise.
3 Proposed Method
In this section, we present the proposed fuzzy Hopfield neural network with a fixed weight model to simulate the membership matrix for image segmentation. Each pixel in the image is a point in the plane. If there are n pixels to be divided into c clusters, then each pixel has c neurons asso-ciated with it. There are n⫻c neurons in this network. Similar to that in FCM, the outputs of the neurons, denoted O⫽oik,0⭐i⭐n,1⭐k⭐c, form a membership matrix. A membership corresponds to a partition if it satisfies the fol-lowing conditions:
兺
k⫽1 c
oik⫽1, for all i,
兺
i⫽1 n
oik⬍n for all k, and
兺
i⫽1 n兺
k⫽1 c ⫽n,where 0⭐oik⭐1. Two neurons are neighbors to each other if their corresponding pixels in the image are neighbors to each other. As shown in Fig. 1, each neuron receives con-tributions from the neighboring neurons and itself as its input. These contributions are weighted by the synaptic weights W. In our approach, the synaptic weights are fixed and should be determined first. The synaptic weight be-tween two neurons i and j is determined by the Euclidean distance, and the similarity of their intensities in the image is as shown in the following equation.
wi j⫽ 1
␣1关⌬I共i, j兲兴2⫹␣2关D共i, j兲兴2
. 共1兲
In Eq. 共1兲, ⌬I(i, j) is the difference in intensity between pixel i and j, and D(i, j ) is the Euclidean distance between pixel i and j. ␣1 and␣2 are the weights to balance these two factors.
The proposed method requires a set of initial cluster centers. The initial cluster centers do not need to be exact, but they should not be far away from the true centers. The initial cluster centers can be either given by user assists or obtained from the global information about the gray-scale distribution of the image. In most of the cases for medical image segmentation, the intensities of the regions of inter-est are known. Users can provide the cluster centers from such available knowledge. Otherwise, the cluster centers can be estimated using a c-means method.
Given a set of c initial cluster centers, we perform the initial partition as:
oik(0)⫽ 兵1/关I共i兲⫺vk兴
2其1/q⫺1 兺j⫽1
c
兵1/关I共i兲⫺vj兴2其1/q⫺1, 1⭐i⭐n,1⭐k⭐c, where I(i) andvkare, respectively, the intensity values of pixel i and the k’th class center.
Recall that a neuron receives outputs from neighboring neurons and itself. The net value of the neuron i is de-scribed as Netik(t⫹1)⫽
兺
j苸Ni wi jojk (t)⫹ i, 共2兲where Netik(t⫹1) is the net value of neuron i associated with class k in iteration t⫹1, ojk
(t)
is the output state of neuron j associated with class k in iteration t, andiis the offset bias fed to the neuron i. In our approach, the of all neurons is set to zero. So Eq.共2兲 becomes
Netik (t⫹1)⫽
兺
j wi jojk (t) . 共3兲Each pixel has c neurons associated with c clusters to represent the membership degree of each cluster. When the net values of the neurons have been updated in Eq.共3兲, the outputs of all neurons will be updated depending on the new net values. Following the fuzzy c-means algorithm, the new output values can be obtained using the following equation:
oik(t⫹1)⫽ 关Netik
(t⫹1)兴1/q⫺1 兺jc⫽1关Neti j(t⫹1)兴1/q⫺1
.
The proposed segmentation algorithm is summarized as follows:
Fig. 2 The simulated image with (a) a constant gray level in back-ground and each disk; (b), (c), and (d) are the simulated images with added noise levelsK⫽20, 23, and 25, respectively.
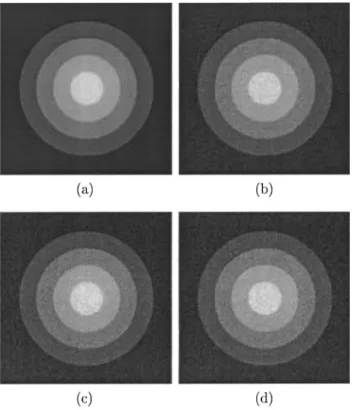
Fig. 3 The segmentation results with added noise levelK⫽20 using (a) HCM, (b) FCM, (c) CHNN, and (d) the proposed approach.
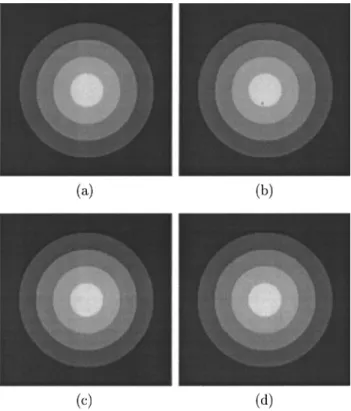
Fig. 4 The segmentation results with added noise levelK⫽23 using (a) HCM, (b) FCM, (c) CHNN, and (d) the proposed approach.
Fig. 5 The segmentation results with added noise levelK⫽25 using (a) HCM, (b) FCM, (c) CHNN, and (d) the proposed approach.
Table 1 The number of misclassified pixels and error rate with noise levelK⫽20. HCM FCM CHNN proposed approach Number of misclassified pixels 0 0 0 0 Error rate 0.00 0.00 0.00 0.00
Table 2 The number of misclassified pixels and error rate with noise levelK⫽23. HCM FCM CHNN proposed approach Number of misclassified pixels 31614 5090 9434 59 Error rate 0.4823 0.0776 0.1439 0.0009
Table 3 The number of misclassified pixels and error rate with noise levelK⫽25. HCM FCM CHNN proposed approach Number of misclassified pixels 31644 8898 14022 361 Error rate 0.4828 0.1357 0.2139 0.0055
Step 1. Determine the neighborhood window, N, and cal-culate the weights, wi j, 1⭐i⭐n, for a neuron j苸Ni using Eq.共1兲.
Step 2. Initial clustering.
Step 3. Calculate the net value using Eq.共3兲. Step 4. Update the output states using Eq.共3兲.
Step 5. If maxik兩oik(t⫹1)⫺oik(t)兩⬍⑀then go to Step 6; other-wise t⫽t⫹1 and go to Step 3.
Step 6. Output the final result using the defuzzification process as
Si⫽k, if oik⫽max1⭐j⭐c兵oij其,
where Si is the segmentation label of pixel i.
4 Simulation and Experiment Results
In our experiments, we used a set of phantom data and medical images to evaluate the performance of the pro-posed algorithm. The phantom data set based on CHNN7 was used, as shown in Fig. 2共a兲, which was produced from
four overlapping disks and the background. An average gray scale for each region was: the average gray value of the background was 30, and from the outer most circle to the center, the average gray values of four disks were 75, 120, 165, and 210, respectively.
The gray scale in each region was not a constant. Sup-pose that is the average gray scale in a region. The gray scales in the region were uniformly distributed over the range 关⫺k,⫹k兴, where k is a constant. Figures 2共b兲 through 2共d兲 are the phantom data sets containing noise with K⫽20, 23, and 25, respectively. We applied the hard c-means 共HCM兲, fuzzy c-means 共FCM兲, competitive Hopfield neural network 共CHNN兲, and the proposed ap-proach to process the phantom data sets. Figures 3–5 are the segmentation results with noise levels K⫽20, 23, and 25, respectively. In these figures, parts 共a兲 through 共d兲 are the results segmented by applying HCM, FCM, CHNN, and the proposed approach, respectively. We compared the amount of misclassified pixels and the error rates to evalu-Fig. 6 The images in the first column are the original images. Images in the second column were
obtained by first applying a mean filter to the original images, then applying intensity thresholding. The images in the third column were obtained by the proposed method.
ate the performance. Tables 1–3 show the comparison re-sults from these phantom data sets using these four meth-ods. All of the four methods perfectly segmented the objects when the noise level was K⫽20. If the noise levels were higher when K⫽23 and 25, the performance of the proposed approach was better than other three methods, both in perception quality and quantitative comparisons 共see Figs. 4, 5, and Tables 2 and 3兲.
We applied the proposed algorithm to segment the area of interest in medical images. The first was a set of CT images of a head scan. The region of interest in the CT images is a blood clot. The blood clot has higher intensity than the soft tissue. Two experiments were done on this set of images. The first experiment was to compare the pro-posed method against an intensity thresholding method. When we are partitioning the pixels into two classes, the effect of the proposed method is the same as the intensity thresholding method. The proposed method needs two ini-tial cluster centers, while the thresholding method needs an exact threshold value. When the thresholding method was applied, we first applied a mean filtering to the image. We then carefully chose the best possible threshold to segment the blood clot. The results are shown in Fig. 6. In Fig. 6, the first column shows the original image. The boundary points obtained by using the thresholding method are shown in the second column. The boundary points obtained by using the Fig. 7 (a) The original CT image of human head; (b), (c), and (d) are
the segmentation results using the proposed approach, HKM, and FKM, respectively.
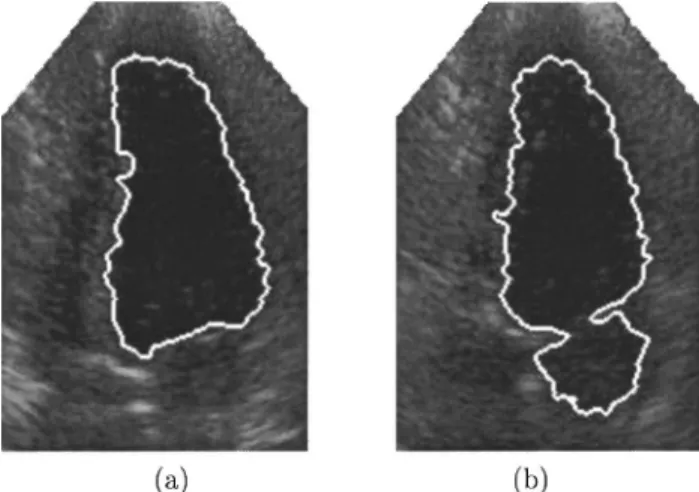
Fig. 8 (a) and (b) are two echocardiographic images with the boundaries obtained by the proposed approach.
Fig. 9 The pixels in the MR images are partitioned into four sets. From left to right, each column shows the original image (above) and the processed image (below).
proposed method are shown in the third column. The pro-posed method can obtain relatively clean images.
The second experiment was to compare the proposed method with the HCM and FCM. Figure 7共a兲 is an original CT image of a human head scan. Figure 7共b兲 shows the blood clot segmented using the proposed approach. We also segmented the blood clot by using HCM and FCM algo-rithms and show the results in Figs. 7共c兲 and 7共d兲. The result obtained by the proposed approach was much better than the other two methods.
We applied the proposed method to classify the pixels in the echocardiographic images. In this experiment, precor-dial echocardiographic images were used. The region of interest in the echocardiographic images is generally the heart chamber. The heart chamber in the image generally has low intensity. The segmentation of a heart chamber is difficult due to the speckle noise. The boundaries of the segmented results from the proposed approach are shown together with the original images in Fig. 8. These results
show that the proposed approach works well for cardiac ultrasound images.
The next experiment was to classify the pixels in MR images of a human head scan. We classified the pixels into four sets. Figure 9 shows the original images in the first row and the processed images in the second rows. The re-sults show that the proposed method also works well to classify the pixels in MR images.
In the following, we present the results obtained using a two step segmentation method. In the first step, we used the global information to estimate the cluster centers. We then applied the proposed method to classify the pixels into clusters. The first step was carried out using the hard c-means algorithm to divide the intensity into clusters. The centers of these clusters then serve as the initial centers for the proposed method. Figures 10共a兲, 10共d兲, and 10共g兲 are the original images of CT, MRI, and echocardiogram. Fig-ures 10共b兲, 10共e兲, and 10共h兲 are, respectively, the histo-grams of Figs. 10共a兲, 10共d兲, and 10共g兲. Figures 10共c兲, 10共f兲 Fig. 10 (a), (d), and (g) are the original images of (a) CT, (d) MR, and (g) echocardiography; (b), (e),
and (h) are the histogram of (a), (d) and (g). (c), (f) and (i) are the segmentation results by first applying the hardc-means algorithm for initial clustering, and then applying the proposed approach. The num-ber of cluster centers was, respectively, 5, 4, and 4 for CT, MR, and echocardiographic images.
A new medical image segmentation technique was pre-sented. The global gray-level information was incorporated to perform the initial clustering, and then the local gray-level information was used to construct a fuzzy Hopfield neural network. A fixed weights approach was utilized to reduce the computing time for neural network stabilization. According to our experiments on the phantom data set, the performance of the proposed approach is much better than the hard c-means, fuzzy c-means, and CHNN methods. Our experiments on the real medical images, demonstrated good results, which were either the initial cluster centers esti-mated by the hard c-means algorithm or the initial cluster centers obtained from the prior knowledge. However, de-ciding the best number of cluster centers for the hard c-means method becomes another problem. Our experi-ments show that increasing the number for cluster centers for the hard c-means method can achieve good result. Acknowledgment
This work was supported under contracts NSC-88-2213-E-009-019 and NSC-89-2213-E-009-098, National Science Council, Taiwan, Republic of China.
References
1. K. S. Fu and J. K. Mui, ‘‘A survey on image segmentation,’’ Pattern Recogn. 13, 3–16共1981兲.
2. N. R. Pal and S. K. Pal, ‘‘A review on image segmentation tech-niques,’’ Pattern Recogn. 26, 1277–1294共1993兲.
3. R. C. Gonzalez and R. E. Woods, Digital Image Processing, Addison-Wesley, Reading, MA共1992兲.
tive Hopfield neural network to medical image segmentation,’’ IEEE Trans. Med. Imaging 15共4兲, 560–567 共1996兲.
8. J. S. Lin, K. S. Cheng, and C. W. Mao, ‘‘A fuzzy Hopfield neural network for medical image segmentation,’’ IEEE Trans. Nucl. Sci.
43共4兲, 2389–2398 共1996兲.
9. J. S. Lin, K. S. Cheng, and C. W. Mao, ‘‘A modified Hopfield neural network with fuzzy c-means technique for multispectral MR image segmentation,’’ Proc. IEEE Int. Conf. Image Processing, 327–330 共1996兲.
10. G. Coppini, R. Poli, and G. Valli, ‘‘Recovery of the 3-D shape of the left ventricle from echocardiographic images,’’ IEEE Trans. Med. Im-aging 14共2兲, 301–317 共1995兲.
11. Y. Zhu and H. Yan, ‘‘Computerized tumor boundary detection using a Hopfield neural network,’’ IEEE Trans. Med. Imaging 16共1兲, 55–67 共1997兲.
12. J. C. Bezdek, Pattern Recognition with Fuzzy Objective Function Al-gorithm, Plenum, New York共1981兲.
Chwen-Liang Chang received the BS de-gree in computer science from Chung-Cheng Institute of Technology, Taiwan, in 1988. He is currently a PhD student in the computer and information science depart-ment at National Chiao-Tung University. His research interests are in the areas of image processing, computational geom-etry, medical imaging, deformable models, and neural networks.
Yu-Tai Ching received his BS degree in industrial engineering from Tsing Hua University, Taiwan, in 1980, and MS and PhD degrees in computer science from Northwestern University, Evanston, Illinois, in 1983 and 1987. His research interests are medical image analy-sis, computer graphics, design, and analysis of algorithms.