行政院國家科學委員會專題研究計畫 成果報告
低熱膨脹鑄鐵之鑄造性及加工性研究
研究成果報告(精簡版)
計 畫 類 別 : 個別型
計 畫 編 號 : NSC 95-2221-E-002-114-
執 行 期 間 : 95 年 08 月 01 日至 96 年 07 月 31 日
執 行 單 位 : 國立臺灣大學機械工程學系暨研究所
計 畫 主 持 人 : 潘永寧
計畫參與人員: 博士班研究生-兼任助理:林明山
碩士班研究生-兼任助理:洪文琦
報 告 附 件 : 出席國際會議研究心得報告及發表論文
處 理 方 式 : 本計畫可公開查詢
中 華 民 國 96 年 12 月 07 日
On The Riser Design of Cast Irons With Low Thermal Expansion Coefficient
E. N. PAN, M. S. LIN
Department of Mechanical Engineering, National Taiwan University, Taipei, Taiwan
發表期刊:
E.
N.
Pan
and
M.
S.
Li
n,
“On
t
he
Ri
s
e
r
De
s
i
gn
of
Cas
t
I
r
on
Wi
t
h
Low
The
r
mal Expansion
Coe
f
f
i
c
i
e
nt
,
”
Transactions of American Foundry Society (AFS Trans.), Vol.113, 2006.
ABSTRACTThe objective of this study is to evaluate the castability, alloy solidification shrinkage and the riser design in particular, of low thermal expansion (LTE) cast irons with relatively low C and Si content (< 2.0%). The solidification temperatures as well as the solidification shrinkage and solid contraction were analyzed, and also the riser design was performed in this work. Thermal analyses results indicate that the alloy liquidus temperatures are closely related with the CE value. In addition, the amounts of solidification shrinkage were measured to be around 5% for 1%C-1%Si-35%Ni FG irons, and around 6.5% for SG irons of similar compositions, with a difference of some 1.5%. Furthermore, the percent solidification shrinkage decreases as the Co content increases from nil to 6% at a constant NiE, with a 0.35% reduction for each 1% Co substitution for an equivalent amount of Ni. Increasing C and Si contents reduces the amount of solidification shrinkage, but no
noticeable effect of substitution of Co for Ni on solidification shrinkage was obtained as C and Si were increased. Finally, the optimal riser designs for LTE cast irons with various compositions were attained.
INTRODUCTION
In high-precision machining, semi-conductor manufacturing processes and pairs of conjugated rotating components, all of which generate heat, the demand for a high dimensional accuracy under the influence of thermal heat continuously increases. Alloyswith low thermalexpansion coefficients(α)aresuitableforsuch applications.
Guillaume developed Invar (Fe-Nialloys)in 1896.Theα valuesofInvararequitelow,typically at(1~ 3) x 10-6/oC (or (0.56 ~ 1.67) x 10-6/oF) (ASM Metals Handbook, 10thed., Vol. 2, 1990). However, the low C and Si contents (C<0.2%, Si<0.4%) and the austenitic phase in the microstructure cause Invar to exhibit relatively poor machinability and castability. In 1927, the International Nickel Company developed a series of high-Niausteniticcastirons(laterspecified asASTM “Ni-resist”)for various special applications. Of the ASTM Ni-resist alloys, Alloy D-5, which contains 34 ~ 36% Ni was designated for use in applications that require low thermal expansion. This high-Niausteniticcastiron hasα valueofabout(5~ 6) x 10-6/oC (or (2.8 ~ 3.3) x 10-6/oF), which is around one-third to one-half that of the ordinary cast irons (INCO, 1970, ASM Metals Handbook, 10thed., Vol. 1, 1990). The relatively high C and Si contents and the presence of the graphite phase in the microstructure allow Alloy D-5 to have much better machinability and castability than Invar. However, the coefficients of Alloy D-5 are still too high for specific applications.
In the authors’earlierwork (Pan et.al.,2003),issuessuch asdeveloping castirons with low thermal expansion coefficient with theα valueapproaching thatofInvar,therecovery ofalloying elementson melting and thesolidification characteristics ofthedeveloped alloys,wereinvestigated.Theresultsshow thatα decreasesasC and/orSi contents (or CE) decreases. Cast irons with a nominal composition of 1.0%C-1.0%Si-36%Ni have α valuesobtained in thetemperaturerange50 ~ 150oC of (2.3 ~ 3.3) x 10-6/oC for FG iron and (3.5 ~ 3.8) x 10-6/oC for SG iron, respectively. Coefficients can be further reduced by replacing someNiwith Co ataconstantNiE of36%.Forinstance,α valuesin therangeof (1.2 ~ 2.5) x 10-6/oC have been
achieved for alloys with a nominal composition of 1.0%C-1.0%Si-30%Ni-6%Co.
The development of low thermal expansion (LTE) graphite cast irons has led to the conclusions thatrelatively low α values can be obtained mainly by reducing C and/or Si contents. However, both machinability and castability are expected to fall as the C and Si contents decline. In the authors’another work (Pan et. al. 2005), the machinability of LTE cast irons had been studied. The objective of this study is to evaluate the castability, alloy solidification shrinkage and the riser design in particular, of LTE graphite cast irons with relatively low C and Si contents (both are less than 2.0%).
EXPERIMENTAL ALLOY DESIGN
Table 1 presents the alloy design for this study. Two nominal levels of C and Si were considered — 1.0%C-1.0%Si and 2.0%C-2.0%Si, and two nominal combinations of Ni and Co were evaluated — 35%Ni and 29%Ni+6%Co, for both gray and ductile irons. The chemical analyses of all heats are presented in Table 2.
Table 1. Summary of Alloy Design
Chemical composition, % Hea
t No. C Si Ni Co Graphite type
1.0 1.0 35 0 1.0 1.0 29 6 2.0 2.0 35 0 A1 A2 A3 A4 2.0 2.0 29 6 Flaky 1.0 1.0 35 0 1.0 1.0 29 6 2.0 2.0 35 0 B1 B2 B3 B4 2.0 2.0 29 6 Spheroidal
Table 2. Chemical Analyses of All Heats
Heat No. C, % Si, % Ni, % Co, % Mg, %
A1 0.95 0.93 33.6 - -A2 0.96 1.02 29.4 6.1 -A3 2.06 2.11 35.4 - -A4 1.82 2.13 29.4 6.1 -B1 0.97 1.11 35.5 - 0.026 B2 1.14 1.05 27.6 5.9 0.019 B3 1.83 2.19 34.3 - 0.021 B4 2.20 2.23 28.5 6.3 0.026
ANALYSES OF SOLIDIFICATION TEMPERATURES
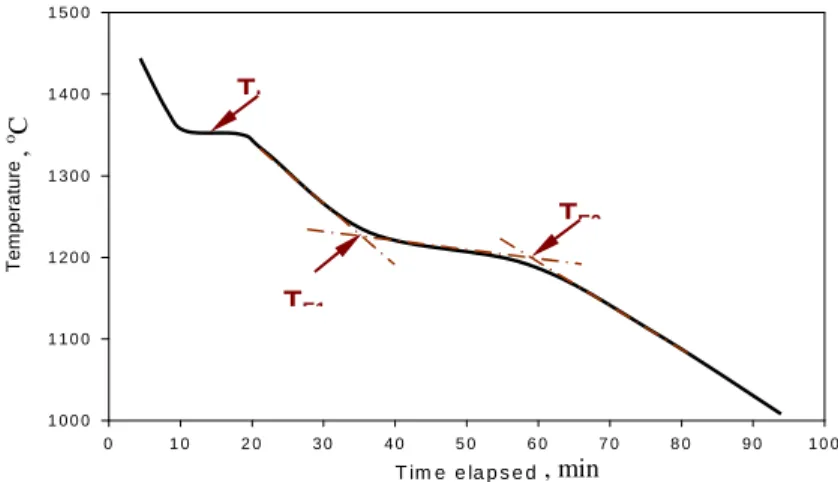
The analyses of the solidification cooling curves were conducted by equipping S-type thermocouples at the center of shell molds,φ40mm x 60 mm L.A typical solidification cooling curve is illustrated in Fig. 1, where the liquidus temperature (the primary arrest, TL) and the eutectic temperatures (the eutectic arrest) are indicated. Regarding the eutectic arrest temperature,
for the apparatus employed in the present study, one can see that the eutectic reaction occurred at continuing decreasing temperatures. For the sake of discussion, the beginning and the end of the eutectic reaction are respectively denoted as TE1
and TE2.
Fig. 1. An example of the solidification cooling curve.
T im e e la p s e d 0 1 0 2 0 3 0 4 0 5 0 6 0 7 0 8 0 9 0 1 0 0 T e m p e ra tu re 1 0 0 0 1 1 0 0 1 2 0 0 1 3 0 0 1 4 0 0 1 5 0 0 TE1 TE2 TL , o C , min
MEASUREMENTS OF SOLIDIFICATION AND SOLID SHRINKAGES
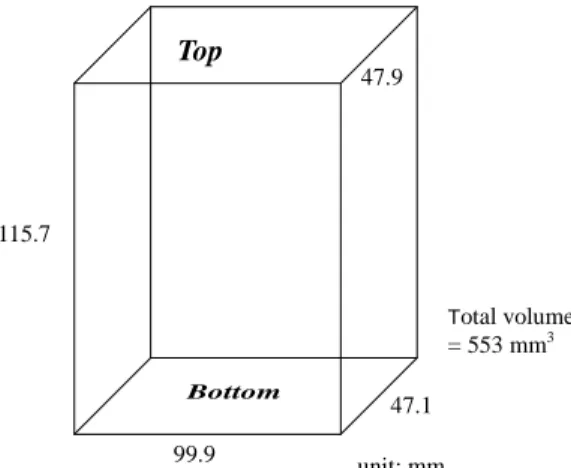
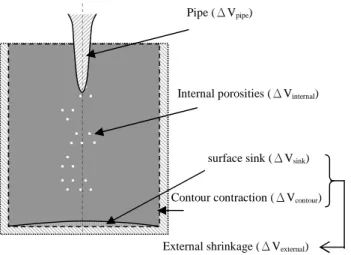
In order to study the mode and amounts of solidification shrinkage and solid contraction, the mold design as illustrated in Fig. 2 was employed (Harinath et al., 1979). The dimensions of a block-shaped pattern (casting) are shown in Fig. 3. The molds were made by CO2 process. When castings were poured and cooled, and then sectioned, various shrinkages can be observed. A schematic illustration of various solidification and solid shrinkages is depicted in Fig. 4. For detailed analysis, both the internal shrinkages (the pipe and the internal dispersed porosity) and the external shrinkages (the surface sink and the contour contraction) were considered and determined by volume and density measurements of the poured castings. In this study, both the internal shrinkages (the pipe ( Vpipe) and the internal dispersed porosity (Vinternal)) and the external shrinkages (the contour contraction and the surface sink), Vexternal, as illustrated in Fig. 4 (Patterson et al., 1962), were considered and determined by volume and density measurements (Archimedes’principle). The determinations of various types of shrinkages are stated below:
Vc1 = The volume of the solidified casting measured by Archimedes’principle without sealing the pipe opening. Vc2 = The volume of the solidified casting measured by Archimedes’principle by sealing the pipe opening. Vp = The volume of the original pattern.
Di = The density of the specimens taken from a Keel-block mold which was concurrently cast from the same melt, where a sound casting without the presence of porosity is assumed.
Wc = The casting weight.
From the measurements of Vc1, Vc2, Vp, Diand Wc, the amount of various types of shrinkages, Vpipe, Vinternaland Vexternal, can
be calculated as follows:
Vpipe= Vc2 ﹣Vc1
Vinternal= Vc1 ﹣ Wc/ Di
Vexternal= Vp﹣Vc2
The gross shrinkage which includes solidification shrinkage and solid contraction is equal to Vpipe﹢Vinternal ﹢Vexternal. The
solid contraction is defined as the contraction of the casting from the solidified temperature to the ambient temperature, which is calculated by the temperature change and the thermal expansion coefficient. Then, the solidification shrinkage can be determined by contracting the solid contraction from the gross shrinkage.
Fig. 2. Mold design for solidification and solid Fig. 3. Pattern (casting) for solidification and solid shrinkage test. shrinkage test.
Casting Overflow Overflow core Primary mold Pouring basin unit: mm Top Bottom 99.9 115.7 47.9 47.1 Total volume = 553 mm3
Fig. 4. A schematic illustration of various shrinkages.
RISER DESIGN
In this study, the riser design for the alloys studied, owing to their relatively low C and Si contents, was performed based upon the concept of cast steel (Chvorinov, 1940, Woldawer, 1966). The Geometric method developed by Heine (Heine, 1963) was adopted here for the riser design. Following is a brief review of the Geometric method. A complete riser system includes three sections: (1) the feeding section, (2) the pressure section, and (3) the riser base, as illustrated in Fig. 5. The feeding section serves as a reservoir that provides liquid metal to compensate for the solidification shrinkage of the casting. The pressure section is optionally added to ensure the feeding section being above the casting to achieve efficient feeding. While, the riser base serves as a channel between the feeding section and the casting. For a side-riser, all the three sections are usually required, whereas, only the feeding section is required for a top-riser.
Fig. 5. A complete riser system for the Geometric method.
Regarding the feeding section, it is further divided to two sub-sections, namely, the outer ring with a shell thickness of w and the central pipe section with a diameter Dpand a height Hp. The diameter and the height of the feeding section are DRand HP,
respectively, where DR= 2w + Dp. On the other hand, the shell thickness w is equal to 2Mc, where Mcis the casting modulus.
Furthermore, the volume of the pipe, (πDp2Hp) / 4, is equal to the amount of the solidification shrinkage of the casting alloy,
namely, (πDp 2
Hp) / 4 = b x Vc, where b is the percent solidification shrinkage and Vcis the casting volume. Based upon the
data of casting volume (Vc), percent solidification shrinkage (b), and casting modulus (Mc), together with the assumption of
Hp= n Dp(n is normally 1 ~3), the dimensions of the feeding section, DRand HP, can be readily obtained.
The experimental setup for evaluating the feeding efficient of various riser sizes is illustrated in Fig. 6, which includes a pouring basin, an overflow, a riser mold and a primary mold. The molds were made by the CO2process, and the treatment
surface sink (ΔVsink)
Contour contraction (ΔVcontour)
Pipe (ΔVpipe)
Internal porosities (ΔVinternal)
∴
∵
∴∵
∴
∵∴
External shrinkage (ΔVexternal)
H
mH
BD
RD
PW
W
H
P(Pipe)
H
Rthe feeding section
(the pressure section)
temperatures were set at (TL+ 200oC) for FG irons and at (TL+ 250oC) for SG irons. After treatments, the melt was poured
immediately into the molds.
Fig. 6. An assembly mold design for the feeding test of risers.
RESULTS AND DISCUSSION
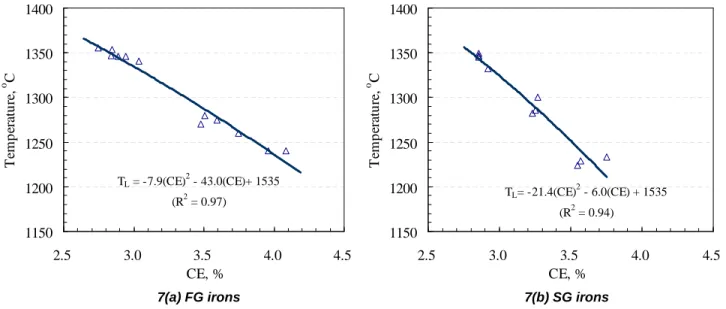
The solidification temperatures for the low C and Si LTE graphite cast irons had been investigated in authors’previous work (Pan, et.al. 2003), and a brief summary of the results is presented here. The relationship between the liquidus temperatures and the CE value for both FG and SG cast irons are shown in Figs. 7(a) and 7(b), respectively. The CE is defined as: CE = %C + 0.33 %Si + 0.047 %Ni –0.0055 (%Ni x %Si) (Schelleng, 1960). Note in Fig. 7 that the liquidus temperature decreases with increasing CE value. Here, non-linear regression equations were derived for both FG and SG irons as follows:
For FG irons: TL, (oC) = - 7.9 (CE)2–43 (CE) + 1535 (R2= 0.97) Equation 1
For SG irons: TL, ( o
C) = - 21.4 (CE)2–6 (CE) + 1535 (R2= 0.94) Equation 2
7(a) FG irons 7(b) SG irons
Fig. 7. The liquidus temperature with respect to CE value.
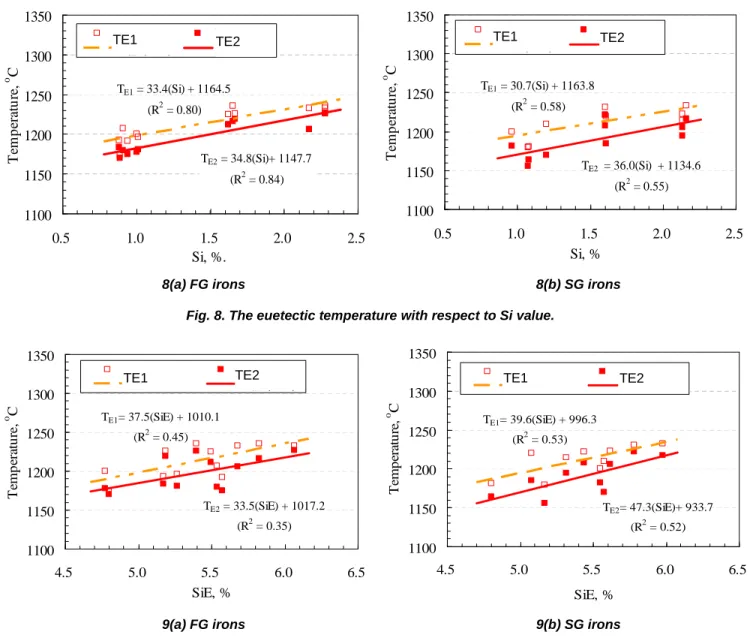
It has been well realized that in the Fe-C-Si system the eutectic temperatures of both the stable and metastable reactions are influenced mainly by the Si content. Therefore, change in eutectic temperatures (TE1and TE2)as affected by the Si content
was first plotted, with the results being depicted in Fig. 8(a) and Fig. 8(b) for flake and spheroidal graphite irons, respectively.
Pouring basin Casting Primary mold Riser mold Overflow Riser TL= -7.9(CE)2- 43.0(CE)+ 1535 (R2= 0.97) 1150 1200 1250 1300 1350 1400 2.5 3.0 3.5 4.0 4.5 CE, % T em p er at u re , o C TL= -21.4(CE)2- 6.0(CE) + 1535 (R2= 0.94) 1150 1200 1250 1300 1350 1400 2.5 3.0 3.5 4.0 4.5 CE, % T em p er at u re , o C
The regression analyses were also performed with the prediction equations being denoted in the figures.
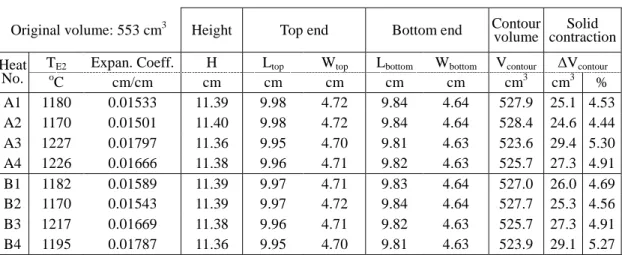
It can be noticed that all the above four coefficients of determination are relatively low, implying that the Si alone as the dependent variable may not be sufficient enough to attain good correlation with the eutectic temperatures. It should be recognized that the alloys studied herein contain not only Si but also a substantial amount of Ni, and in some cases some amounts of Co. The role of Ni should not be ignored due to its similarity in metallurgical effect as Si though with different (less) degree. Therefore, both the effects of Si and Ni are considered and combined into a single parameter, i.e., silicon equivalent (Si.E.), where Si.E. = %Si + 0.141%Ni + 0.0165(%Si x %Ni). Again, when the relationships between the eutectic temperature and Si.E were plotted, the results are shown in Fig. 9(a) and Fig. 9(b) for FG irons and SG irons, respectively. However, the coefficients of determination of the regression equations derived are still relatively low.
8(a) FG irons 8(b) SG irons
Fig. 8. The euetectic temperature with respect to Si value.
9(a) FG irons 9(b) SG irons
Fig. 9. The euetectic temperature with respect to SiE value.
ANALYSES OF SOLIDIFICATION AND SOLID SHRINKAGES
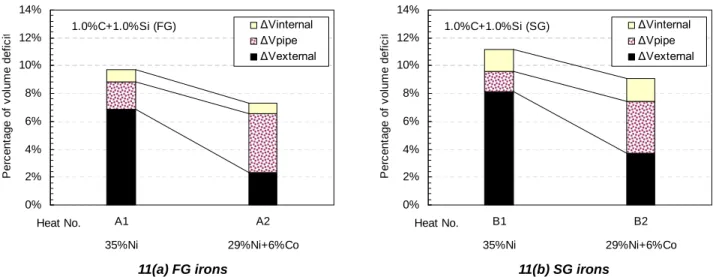
A typical example depicting the contour and the sectioned view of a casting is shown in Fig. 10, where the presence of a pipe, internal porosities and surface sinks are evident. The data for the gross shrinkage (includes both solidification shrinkage and solid contraction) and solid contraction for all the alloys studied are listed in Table 3 and Table 4, respectively. The gross shrinkage for the 1.0%C-1.0%Si alloys with different Ni and Co combinations are shown in Fig. 11(a) for FG irons and Fig. 11(b) for SG irons. The gross shrinkage is lower for FG irons (7.35% ~ 9.73%) than for SG irons (9.07% ~ 11.17%), with a difference of some 1.5%. Further, if the solid contraction was excluded and only the solidification shrinkage was considered, a similar trend was obtained, namely, (2.91% ~ 5.2%) for FG irons and (4.51% ~ 6.48%) for SG irons, and again with a
TE1= 33.4(Si) + 1164.5 (R2= 0.80) TE2= 34.8(Si)+ 1147.7 (R2= 0.84) 1100 1150 1200 1250 1300 1350 0.5 1.0 1.5 2.0 2.5 Si, %. T em p er at u re , o C TE1 TE2 線性 (TE1) 線性 (TE2) TE1= 30.7(Si) + 1163.8 (R2= 0.58) TE2 = 36.0(Si) + 1134.6 (R2= 0.55) 1100 1150 1200 1250 1300 1350 0.5 1.0 1.5 2.0 2.5 Si, % T em p er at u re , o C TE1 TE2 線性 (TE1) 線性 (TE2) TE1= 37.5(SiE) + 1010.1 (R2= 0.45) TE2= 33.5(SiE) + 1017.2 (R2= 0.35) 1100 1150 1200 1250 1300 1350 4.5 5.0 5.5 6.0 6.5 SiE, % T em p er at u re , o C TE1 TE2 線性 (TE1) 線性 (TE2) TE1= 39.6(SiE) + 996.3 (R2= 0.53) TE2= 47.3(SiE)+ 933.7 (R2= 0.52) 1100 1150 1200 1250 1300 1350 4.5 5.0 5.5 6.0 6.5 SiE, % T em p er at u re , o C TE1 TE2 線性 (TE1) 線性 (TE2)
TE1 TE2 TE1 TE2
difference of some 1.5%, Fig. 12. Further analysis indicated that the gross shrinkage decreases as the Co content increases from 0 to 6% at a constant NiE, with a 0.35% reduction in solidification shrinkage for each 1% Co substitution for an equivalent amount of Ni. Based upon the results obtained herein, the amount of the solidification shrinkage of 3 ~ 5% can be adopted for FG irons that contain 1.0%C and 1.0%Si, while an additional 1.5% should be added for ductile irons of similar compositions.
Fig. 10. A sectional view of a typical solidification shrinkage test casting.
Table 3. Results of Gross Shrinkage (Vexternal+Vpipe+Vinternal) of All Alloys Studied
Pattern measurements
Casting
measurements Calculated results
Wi Vi Di Wc Vc1 Vc2 ΔVexternal ΔVpipe ΔVinternal ΔVgross
Heat No. g cm3 g/cm3 g cm3 cm3 cm3 % cm3 % cm3 % cm3 % A1 4378 564 7.77 3953 525 514 38.7 6.9 11.0 2.0 5.1 0.9 54.8 9.7 A2 4390 564 7.78 4068 551 527 13.0 2.3 24.0 4.3 4.4 0.8 41.5 7.4 A3 4241 564 7.52 3948 543 528 21.0 3.7 15.0 2.7 3.0 0.5 39.0 6.9 A4 4303 546 7.63 3992 543 527 21.0 3.7 16.0 2.8 4.0 0.7 41.0 7.3 B1 4372 564 7.77 3878 517 508 45.2 8.1 8.4 1.5 8.8 1.6 62.9 11.2 B2 4416 564 7.83 4016 543 522 21.0 3.7 21.0 3.7 9.1 1.6 51.1 9.1 B3 4235 564 7.51 3861 542 518 23.7 4.2 16.2 2.9 3.8 0.7 40.7 7.8 B4 4224 564 7.49 3890 544 523 21.5 3.8 18.3 3.3 3.6 0.6 40.1 7.7
Table 4. Estimations of Solid Contraction
Original volume: 553 cm3 Height Top end Bottom end Contourvolume contractionSolid TE2 Expan. Coeff. H Ltop Wtop Lbottom Wbottom Vcontour ΔVcontour
Heat No. oC cm/cm cm cm cm cm cm cm3 cm3 % A1 1180 0.01533 11.39 9.98 4.72 9.84 4.64 527.9 25.1 4.53 A2 1170 0.01501 11.40 9.98 4.72 9.84 4.64 528.4 24.6 4.44 A3 1227 0.01797 11.36 9.95 4.70 9.81 4.63 523.6 29.4 5.30 A4 1226 0.01666 11.38 9.96 4.71 9.82 4.63 525.7 27.3 4.91 B1 1182 0.01589 11.39 9.97 4.71 9.83 4.64 527.0 26.0 4.69 B2 1170 0.01543 11.39 9.97 4.72 9.84 4.64 527.7 25.3 4.56 B3 1217 0.01669 11.38 9.96 4.71 9.82 4.63 525.7 27.3 4.91 B4 1195 0.01787 11.36 9.95 4.70 9.81 4.63 523.9 29.1 5.27
11(a) FG irons 11(b) SG irons
Fig. 11. A comparison of the gross shrinkage of irons (1%C+1%Si) with different combinations of Ni and Co.
12(a) FG irons 12(b) SG irons
Fig. 12. A comparison of the solidification shrinkage of irons (1%C+1% Si) with different combinations of Ni and Co.
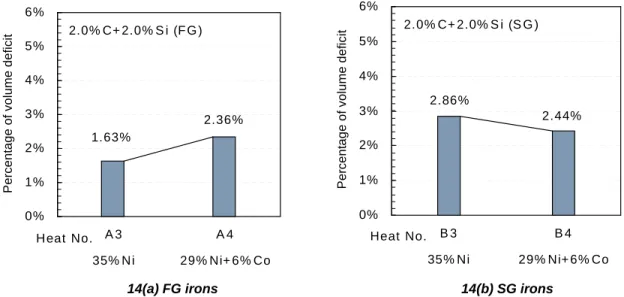
The gross shrinkage (both solidification shrinkage and solid contraction) for the 2.0%C-2.0%Si alloys with different Ni and Co combinations are shown in Fig. 13(a) for FG irons and Fig. 13(b) for SG irons. Noting that the differences in gross shrinkage between FG irons and SG irons are around 0.5% ~0.8%. However, the gross shrinkages remain more or less unchanged for both FG irons (6.9% ~ 7.3%) and SG irons (7.7% ~ 7.8%) as the Co content increases from 0 to 6% at a constant NiE. Furthermore, if the solid contraction was excluded and only the solidification shrinkage was considered, a similar trend was obtained, (1.6% ~ 2.4%) for FG irons and (2.4% ~ 2.9%) for SG irons, with again a difference of 0.5% ~ 0.8 %, Fig. 14. It is apparent that less shrinkage for 2.0%C-2.0%Si alloys was obtained when compared with 1.0%C-1.0%Si alloys. 1. 0 % C + 1 . 0 % S i (F G ) 5 . 2 0% 2 . 9 2% 0% 2% 4% 6% 8% 1 0% A 1 A 2 3 5% N i 2 9 % N i+ 6 % C o H e a t N o . P e rc e n ta g e o f v o lu m e d e fi c it 1 . 0 % C + 1 . 0 % S i (S G ) 6 . 48 % 4 . 5 1 % 0% 2% 4% 6% 8% 1 0% B 1 B 2 3 5 % N i 2 9% N i+ 6% C o H e a t N o . P e rc e n ta g e o f v o lu m e d e fi c it 1.0%C+1.0%Si (FG) 0% 2% 4% 6% 8% 10% 12% 14% A1 A2 35%Ni 29%Ni+6%Co Heat No. P e rc e n ta g e o f v o lu m e d e fi c
it ΔViΔVpintpeernal
ΔVexternal 1.0%C+1.0%Si (SG) 0% 2% 4% 6% 8% 10% 12% 14% B1 B2 35%Ni 29%Ni+6%Co Heat No. P e rc e n ta g e o f v o lu m e d e fi c
it ΔViΔVpintpeernal
13(a) FG irons 13(b) SG irons
Fig. 13. A comparison of the gross shrinkage of irons (2%C+2%Si) with different combinations of Ni and Co.
14(a) FG irons 14(b) SG irons
Fig. 14. A comparison of the solidification shrinkage of irons (2%C+2% Si) with different combinations of Ni and Co.
RISER DESIGN
The data needed for the riser design include percent solidification shrinkage of the alloys, casting volume, casting modulus and the ratio between diameter and height of the pipe section in the riser, which are listed in Table 5 for the alloys studied. Based upon the data in Table 5, the theoretical optimal riser sizes for each alloy were calculated and are presented also in Table 5. Based on the calculated optimal riser sizes, a series of various riser sizes, including both smaller and larger than the calculated optimal values, were selected for further experimental verification in order to attain the actual optimal riser sizes. The experimental designs are presented in Table 6 for alloys containing 1%C-1%Si-Ni-Co, and Table 7 for alloys containing 2%C-2%Si-Ni-Co. 2.0% C+ 2.0% S i (F G ) 1.63% 2.36% 0% 1% 2% 3% 4% 5% 6% A 3 A 4 35% N i 29% Ni+ 6% Co H eat No. P e rc e n ta g e o f v o lu m e d e fi c it 2.0% C+ 2.0% S i (S G ) 2.86% 2.44% 0% 1% 2% 3% 4% 5% 6% B 3 B 4 35% Ni 29% Ni+ 6% Co Heat No. P e rc e n ta g e o f v o lu m e d e fi c it 2.0%C+2.0%Si (FG) 0% 2% 4% 6% 8% 10% 12% A3 A4 35%Ni 29%Ni+6%Co Heat No. P e rc e n ta g e o f v o lu m e d e fi c
it ΔViΔVpintpeernal
ΔVexternal 2.0%C+2.0%Si (SG) 0% 2% 4% 6% 8% 10% 12% B3 B4 35%Ni 29%Ni+6%Co Heat No. P e rc e n ta g e o f v o lu m e d e fi c
it ΔViΔVpintpeernal
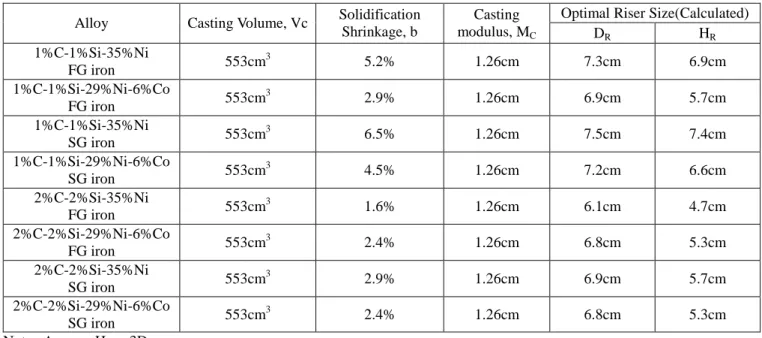
Table 5. Data for Riser Design and the Optimal Riser Dimensions for Various Alloys by Calculation
Optimal Riser Size(Calculated) Alloy Casting Volume, Vc Solidification
Shrinkage, b Casting modulus, MC DR HR 1%C-1%Si-35%Ni FG iron 553cm 3 5.2% 1.26cm 7.3cm 6.9cm 1%C-1%Si-29%Ni-6%Co FG iron 553cm 3 2.9% 1.26cm 6.9cm 5.7cm 1%C-1%Si-35%Ni SG iron 553cm 3 6.5% 1.26cm 7.5cm 7.4cm 1%C-1%Si-29%Ni-6%Co SG iron 553cm 3 4.5% 1.26cm 7.2cm 6.6cm 2%C-2%Si-35%Ni FG iron 553cm 3 1.6% 1.26cm 6.1cm 4.7cm 2%C-2%Si-29%Ni-6%Co FG iron 553cm 3 2.4% 1.26cm 6.8cm 5.3cm 2%C-2%Si-35%Ni SG iron 553cm 3 2.9% 1.26cm 6.9cm 5.7cm 2%C-2%Si-29%Ni-6%Co SG iron 553cm 3 2.4% 1.26cm 6.8cm 5.3cm Note : Assume Hp = 3Dp
Table 6. Experimental Design of Risers for Alloys Containing 1%C-1%Si-Ni-Co
Heat No. Casting Riser (mm) Riser neck (mm) MR(mm) MR/ MC
A11 D=55,H=55 D=33,H=10 11 0.87 A12 D=60,H=60 D=36,H=10 12 0.95 A13 D=65,H=65 D=39,H=10 13 1.03 A14 D=70,H=70 D=42,H=10 14 1.11 A15 D=80,H=80 D=40,H=10 16 1.27 A1 A16 D=90,H=90 D=45,H=10 18 1.43 A21 D=55,H=55 D=33,H=10 11 0.87 A22 D=60,H=60 D=36,H=10 12 0.95 A23 D=65,H=65 D=39,H=10 13 1.03 A24 D=70,H=70 D=42,H=10 14 1.11 A25 D=80,H=80 D=40,H=10 16 1.27 A2 A26 D=90,H=90 D=45,H=10 18 1.43 B11 D=55,H=55 D=33,H=10 11 0.87 B12 D=60,H=60 D=36,H=10 12 0.95 B13 D=65,H=65 D=39,H=10 13 1.03 B14 D=70,H=70 D=42,H=10 14 1.11 B15 D=80,H=80 D=40,H=10 16 1.27 B1 B16 D=90,H=90 D=45,H=10 18 1.43 B21 D=55,H=55 D=33,H=10 11 0.87 B22 D=60,H=60 D=36,H=10 12 0.95 B23 D=65,H=65 D=39,H=10 13 1.03 B24 D=70,H=70 D=42,H=10 14 1.11 B25 D=80,H=80 D=40,H=10 16 1.27 B2 B26 D=90,H=90 D=45,H=10 18 1.43
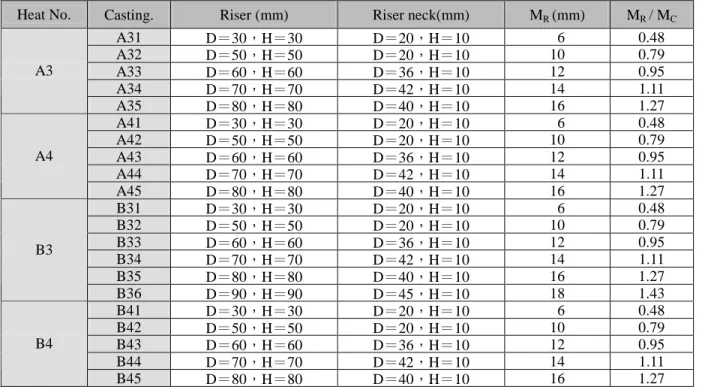
Table 7. Experimental Design of Risers for Alloys Containing 2%C-2%Si-Ni-Co
Heat No. Casting. Riser (mm) Riser neck(mm) MR(mm) MR/ MC
A31 D=30,H=30 D=20,H=10 6 0.48 A32 D=50,H=50 D=20,H=10 10 0.79 A33 D=60,H=60 D=36,H=10 12 0.95 A34 D=70,H=70 D=42,H=10 14 1.11 A3 A35 D=80,H=80 D=40,H=10 16 1.27 A41 D=30,H=30 D=20,H=10 6 0.48 A42 D=50,H=50 D=20,H=10 10 0.79 A43 D=60,H=60 D=36,H=10 12 0.95 A44 D=70,H=70 D=42,H=10 14 1.11 A4 A45 D=80,H=80 D=40,H=10 16 1.27 B31 D=30,H=30 D=20,H=10 6 0.48 B32 D=50,H=50 D=20,H=10 10 0.79 B33 D=60,H=60 D=36,H=10 12 0.95 B34 D=70,H=70 D=42,H=10 14 1.11 B35 D=80,H=80 D=40,H=10 16 1.27 B3 B36 D=90,H=90 D=45,H=10 18 1.43 B41 D=30,H=30 D=20,H=10 6 0.48 B42 D=50,H=50 D=20,H=10 10 0.79 B43 D=60,H=60 D=36,H=10 12 0.95 B44 D=70,H=70 D=42,H=10 14 1.11 B4 B45 D=80,H=80 D=40,H=10 16 1.27
1.0%C-1.0%Si-Ni-Co LTE Cast Irons
For 1.0%C-1.0%Si-35%Ni FG irons, for the range of the riser diameter (also the riser height) studied, 55mm ~ 90mm, the experimental results that are shown in Fig. 15 indicate that when a 55mm-diameter riser (A11) was employed, obvious macro-shrinkage porosity in the casting just under the riser neck and also a clear pipe inside the riser which extended to the riser neck can be observed, indicating an inadequate riser design. When the riser diameter was increased to 70mm (A14), shrinkage porosity can still be observed in the casting. However, when the riser diameter was further increased to 80mm (A15) and above, sound castings without any trace of porosity were obtained.
A11 (55mm) A14 (70mm) A15 (80mm)
Fig. 15. Sectional views of risers and castings for alloy A1 (1.0%C+1.0%Si+35%Ni FG irons).
For 1.0%C-1.0%Si-29%Ni-6%Co FG irons, a similar trend of reducing casting porosity with a gradual increase of riser diameter with that of 1.0%C-1.0%Si-35%Ni FG irons was obtained (Fig. 16). However, a sound casting can be achieved with a riser diameter of only 65mm (A23), implying that somewhat less risering is required for LTE FG irons when part of Ni is replaced with Co. The results are in total agreement with the measurements of solidification shrinkage presented in the previous section where less shrinkage was obtained for Co-containing (1%C-1%Si-29%Ni-6%Co) irons.
A21 (55mm) A22 (60mm) A23 (65mm)
Fig. 16. Sectional views of risers and castings for alloy A2 (1.0%C+1.0%Si+29%Ni+6%Co FG irons).
For 1.0%C-1.0%Si-35%Ni SG irons, the results that are shown in Fig. 17 indicate that the shrinkage porosity can be totally eliminated only when the riser diameter was raised to 90mm (B16). Fig. 18 illustrates the experimental results for
1.0%C-1.0%Si-29%Ni-6%Co SG irons, where sound castings can be obtained when a riser diameter of 80mm (B25) was employed. As in LTE FG irons, less risering is required for 1.0%C-1.0%Si-29%Ni-6%Co SG irons than for
1.0%C-1.0%Si-35%Ni SG irons when both results of Fig. 17 and Fig. 18 are compared.
B11 (55mm) B14 (70mm) B15 (80mm) B16 (90mm)
Fig. 17 Sectional views of risers and castings for alloy B1 (1.0%C+1.0%Si+35%Ni SG irons).
B21 (55mm) B24 (70mm) B25 (80mm)
Fig. 18. Sectional views of risers and castings for alloy B2 (1.0%C+1.0%Si+29%Ni+6.0%Co SG irons).
2.0%C-2.0%Si-Ni-Co LTE Cast Irons
Fig. 19 shows the sectional views of castings with various riser sizes for 2.0%C-2.0%Si-35%Ni FG irons. When a
30mm-diameter riser (A31) was used, not only the whole riser was almost consumed, but also the casting exhibited serious shrinkage porosity at the upper central region of the casting, indicating a substantial under-design of the riser. When the riser diameter was increased to 60mm (A33), a significant pipe in the riser was observed, which extended into the riser neck and also the upper central portion of the casting, indicating still an insufficient riser design. Nevertheless, a sound casting was obtained when the riser diameter was increased to 80mm (A35). For 2.0%C-2.0%Si-29%Ni-6%Co FG irons, similar results were obtained as in 2.0%C-2.0%Si-35%Ni FG irons, with the optimum riser diameter of being 80mm (Fig. 20).
A31 (30mm) A33 (60mm) A34 (70mm) A35 (80mm)
Fig. 19. Sectional views of risers and castings for alloy A3 (2.0%C+2.0%Si+35%Ni FG irons).
A41 (30mm) A43 (60mm) A44 (70mm) A45 (80mm)
Fig. 20. Sectional views of risers and castings for alloy A4 (2.0%C+2.0%Si+29%Ni+6%Co FG irons).
The results for both 2.0%C-2.0%Si-35%Ni and 2.0%C-2.0%Si-29%Ni-6%Co SG irons that are shown in Fig. 21 and Fig. 22, respectively, exhibit similar pattern, where scattered shrinkage porosity can still be detected when the riser diameter was increased to 80mm (A45). It is then reasonable to expect that a riser diameter of around 90mm should be sufficient to achieve sound castings. For 2.0%C-2.0%Si alloys, the substitution of part of Co for Ni did not exhibit any benefit in risering when compared with alloys having lower C and Si contents. Furthermore, within the ranges of C and Si studied, increasing both elements also did not show any expected benefit in risering.
B31 (30mm) B33 (60mm) B35 (80mm)
Fig.21. Sectional views of risers and castings for alloy B3 (2.0%C+2.0%Si+35%Ni SG irons).
B41 (30mm) B43 (60mm) B45 (80mm)
Table 8 summarizes the optimal ratios of the rise modulus (MR) to the casting modulus (MC) for achieving sound castings for
various alloys, together with the data of percent solidification shrinkage and the optimal riser diameter.
Table 8. Optimal Ratios of Riser Modulus to Casting Modulus for Achieving Sound Casting for Various Alloys Together With the Data of Percent Solidification Shrinkage and Optimal Riser Diameter
Alloy Solidification Shrinkage, b Optimal riser Diameter Optimal MR/MC 1%C-1%Si-35%Ni FG iron 5.2% 80mm 1.27 1%C-1%Si-29%Ni-6%Co FG iron 2.9% 65mm 1.03 1%C-1%Si-35%Ni SG iron 6.5% 90mm 1.43 1%C-1%Si-29%Ni-6%Co SG Iron 4.5% 80mm 1.27 2%C-2%Si-35%Ni FG iron 1.6% 80mm 1.27 2%C-2%Si-29%Ni-6%Co FG iron 2.4% 80mm 1.27 2%C-2%Si-35%Ni SG iron 2.9% ~ 90mm ~ 1.43 2%C-2%Si-29%Ni-6%Co SG iron 2.4% ~ 90mm ~ 1.43
Effects of Insulating Sleeve and/or Exothermic Compounds on Risering
In order to realize the effectiveness of employing insulating sleeves and/or exothermic compounds on risering, Alloys A1, A3, B1 and B3 were selected for investigation. However, it has to be noted that, due to the size standardization of the
commercially supplied insulating sleeves, only limited variation in sleeve diameter are available. The experimental design is shown in Table 9.
Table 9. Experimental Design of Risers Incorporating With Insulating Sleeve and/or Exothermic Compounds
Riser condition
Heat No.
Casting
Riser size(mm)
A1-I
D=50 , H=50
A1-II
D=60 , H=60
A1
A1-III
D=70 , H=70
A3-I
D=50 , H=50
A3-II
D=60 , H=60
A3
A3-III
D=70 , H=70
B1-I
D=50 , H=50
B1-II
D=60 , H=60
B1
B1-III
D=70 , H=70
B3-I
D=60 , H=60
B3-II
D=70 , H=70
Riser with insulating
sleeve
B3
B3-III
D=80 , H=80
A1
A1-IV
D=50 , H=30
Riser with insulating
sleeve & exothermic
For Alloy A1 (1.0%C-1.0%Si-35%Ni FG irons), when an insulating sleeve was used, a riser with a 50mm diameter (A1-I) has been found sufficient for attaining a sound casting (Fig. 23), a reduction of some 76% in riser volume was obtained when compared with the case without employing insulating sleeve, where a riser diameter of 80mm is required. Furthermore, the required riser size can be further reduced to D=50mm & H=30mm (A1-IV) when both an insulating sleeve and exothermic compounds were employed, with a reduction of riser volume of over 85%. For Alloy A3 (2.0%C-2.0%Si-35%Ni FG irons), sound castings can be achieved with a riser diameter of 60mm (A3-II) when employing an insulating sleeve alone, and with a riser of D=50mm & H=30mm (A3-IV) when employing both an insulating sleeve and exothermic compounds (Fig. 24), corresponding to 58% and over 85% reduction in riser volume, respectively, when compared with the case without
employing insulating sleeve and exothermic compounds (80mm diameter). Similar results were obtained for Alloys B1 and B3. Table 10 and Fig. 25 summarize the percent reduction in riser volume by employing insulating sleeve and/or exothermic compounds.
A15 (80mm) A1-I (50mm)
23(a) plain riser 23(b) riser with insulating sleeve
Fig.23. Sectional views of risers and castings for alloy A1 (1%C+1%Si+35%Ni FG irons).
A35 (80mm) A3-II (60mm) A3-IV (50mm)
24(a) plain riser 24(b) riser with insulating sleeve 24(c) riser with insulating sleeve and exothermic compounds
Fig. 24. Sectional views of risers and castings for alloy A3 (1%C+1%Si+35%Ni FG irons).
Table 10. Required Riser Volume and Percent Reduction in Riser Volume by Employing Insulating Sleeve and/or Exothermic Compounds
Heat
No.
Plain riser
Riser with
insulating
sleeve
Reduction of
riser volume
Riser with sleeve &
exothermic
compounds
Reduction of
riser volume
A1
402.1 cm
398.6 cm
376 %
59 cm
385%
A3
402.1 cm
3169.6 cm
358 %
59 cm
385%
0 20 40 60 80 100 120 A1 A3 Heat No. R is er v o lu m e, % Plain riser
Riser with insulating sleeve
Riser with insulating sleeve & exothermic compounds
Fig. 25. Percent reduction in riser volume by employing insulating sleeve and/or exothermic compounds.
CONCLUSIONS
(1) The liquidus temperature of the low thermal expansion cast irons is closely correlated with the CE, where CE = %C+0.33x%Si+0.047x%Ni-0.0055x (%Nix%Si). However, the eutectic temperatures are fairly correlated with the Si content or SiE value.
(2) The measurements of alloy solidification shrinkage and solid contraction indicate that the percent solidification
shrinkage for FG irons that contain 1.0%C, 1.0%Si and 36%Ni is about 5.2%, while an additional 1.5% should be added for SG irons of similar compositions. In addition, a 0.35% reduction in solidification shrinkage for each 1% Co
replacement was obtained. Increasing C and Si contents reduces the amount of solidification shrinkage somewhat, and (1.6% ~ 2.4%) for FG irons and (2.4% ~ 2.9%) for SG irons, with a difference of 0.5% ~ 0.8 %, were obtained. While, no noticeable change in solidification shrinkage was obtained with substitution of Co for Ni in 2.0%C/2.0%Si irons of both FG and SG type.
(3) The optimal riser designs for LTE cast irons with various compositions were attained. The experimental results indicate that the optimal ratios of the riser modulus (MR) to the casting modulus (MC) for achieving sound castings are around
1.27 and 1.43 for FG irons and SG irons, respectively. In addition, the riser requirement is substantially reduced when insulating sleeves and/or exothermic compounds were employed.
REFERENCES
ASM Metals Handbook, 10thed., Vol. 2., pp. 889-896 (1990). ASM Metals Handbook, 10thed., Vol. 1., pp. 85-104 (1990).
Chvorinov, N., “Theory of the Solidification of Castings,”Giesserei, Vol. 27, pp. 177-225 (1940).
Harinath, U., Narayana, K. L., Roshan, H.Md.,“Studieson VolumeDeficitofLM6 Alloy in ShellMolds,”AFS Trans.,Vol. 87, pp. 231-236 (1979).
Heine, R. W., “Piping Riser for White Iron Castings,”Malleable Founders’Society, Tech. Bull. 63-3 (1963). INCO, Engineering Properties of Ni-Resist Ductile Irons, International Nickel Co.,Inc. (1970).
Pan, E. N., Lin, M. S., Hong, W. C., “Machinability of Cast Irons with Low Thermal Expansion Coefficient,”AFS Trans., Vol. 113 (2005).
Pan, E. N., Lin, M. S., Lao, J. H., Liao, K. Y., “Development of Low Thermal Expansion Cast Iron,”AFS Trans., Vol. 111, pp. 961-977 (2003).
Patterson, W., Engler, S., Aluminum, Vol.38, p. 507 (1962).
Schelleng, R. D.,“Influence of Nickel Up to 37 Per Cent and Silicon Up to 3 per Cent Eutectic Carbon Content of Cast Iron, ”AFS Trans.,Vol.68, pp. 301-303 (1960).
Woldawer, R., Directional Solidification of Steel Castings, Oxford: Pergamon Press (1966).