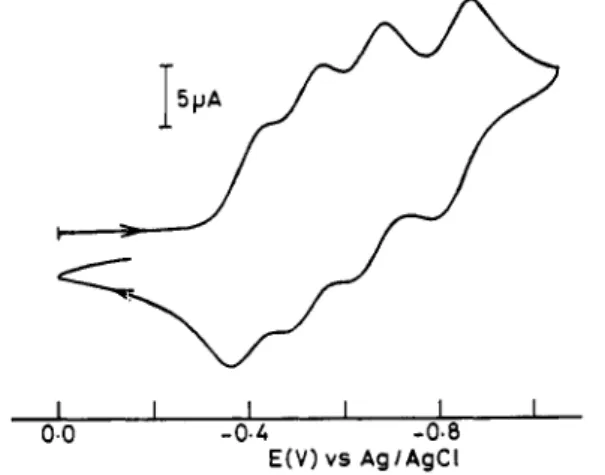
Inorg. Chem. 1992, 31, 1165-1172 1165 is 80 mV for each redox couple. These results establish that the four redox processes which occur at Eo' = -0).40, -0.52,-0).65, and -0.83 V are electrochemically quasi-reversible.
For
the corresponding Rh1I1ZnI1 complexes, [(Rh(aet),},Zn,0l4+ and [{Rh(aet)3}4Zn40]H,4.5 no redox reaction has d in the region of +0.8 to -1.2 V under the same condition. Therefore, the four redox processes can be assigned as the stepwise reactions as follows: CoIII,ZnII,+
C o ~ ~ ~ , C o ~ ~ Z n ~ ~ 4+
CoII'2CoI12ZnII,+
Co111C0113Zn114 + C O ~ ~ , Z ~ I I ,
I I I I I I
0.0 -0.4 -0.8
E(V) vs AglAgCl
F g u e 5. Cyclic voltammogram of 1.0 mmol dm-, [IC0(aet),],Zn,0]~+ (cation of 2) in 0.1 mol aqueous solution of NaNO,. The scan rate is 50 mV s-I.
region (32-48) X lo3 cm-' (Figure 3).
This
CD spectral deviation suggests that the asymmetric bridging sulfur atoms of the central cos6 chromophore in AA-[Co(Co(aet),},13+ contribute conspic- uously to the CD spectrum in the region (16-30) X lo3 cm-l. Electrochemical experiments were performed in a 0.1 mol dm-3 NaNO, aqueous solution at a glassy carbon electrode.As
shown in Figure 5, the cyclic voltammogram of [{C~(aet),),Zn,O]~+ (2) initiated at 0.0 V with a negative potential scan yields four con- secutive reduction waves (E, = -0.44, -0.56, -0.69, -0.87 V) and coupled four oxidation waves (E, = -0.36, -0.48, -0.61, and -0.79 V). No other redox couple is observed in the potential region of +0.8 to -1.2 V (vs Ag/AgCl). The peak current is approximately proportional to the square root of the scan rate. At a scan rate of 50 mV s-I, the ratio of cathodic to anodic peak current is approximately unity and the observed peak separation (E,-
E,)In order to estimate the structure of 1, its cyclic voltammetric measurement was performed under the same conditions as used for 2. The cyclic voltammogram of 1 gave broad and nonreversible four consecutive reduction waves at E, = -0.45, -0.57, -0.71, and -0.89 V. This electrochemical behavior analogies with that of 2, although the relative instability of 1 in water restricts the electrochemical characterization. In addition, the absorption spectrum of 1 is quite similar to that of 2 over the whole region, as shown in Figure 4. These facts suggest that 1 has a cage-type S-bridged structure similar to that of 2. The plasma emission spectral analysis indicates that 1 contains Co and Zn in a ratio of 4:3. Accordingly, it is likely that 1 is the cagatype S-bridged
complex with a "defective" [Zn3BrI5+ core, [ { C ~ ( a e t ) ~ } ~ Z n ~ B r ] ~ + , considering that the formation of 1 was achieved by the addition
of a large amount of NaBr to the reaction solution of fa@')- [Co(aet),] and ZnZ+.
Registry No. 1, 139100-76-8; %Br6 (A-isomer), 139100-77-9; 2.
Br6.9.5H20 (A-isomer), 139236-12-7; 26+ (A-isomer), 139236-13-8; fac-(S)-[Co(aet),], 18703-22-5; A A - [ C ~ ( C O ( ~ ~ ~ ) ~ ) ~ ] (NO,)3, 129387-95-7; Table SI, listing anisotropic thermal parameters (1 page); Table SII, listing observed and calculated structure factors (8 pages). Ordering information is given on any current masthead page.
ALLL-~uc(S)-K~ [ CO( L-cYs-N,~),
1,
97 8 60-43-0. Supplementary Material Available:Contribution from the Department of Chemistry, National Taiwan University, Taipei, Taiwan, ROC
Synthesis and Characterization of Pillared Buserite
She-Tin Wong and Soofin Cheng*
Received July 19, 1991Synthetic Na-buserite, a layered manganese oxide formulated as Na4Mn140gxH 0, was pillared with polyoxo cations of aluminum known widely as Keggin ions, [A11304(OH)U(H20)12]7+, with a diameter of 8.6
k.
The synthetic Na-buserite was first expanded with n-hexylammonium cations to produce hexylammonium ion-expanded buserite. This process expands the buserite interlayer free spacing from 1.94 to 12.94A,
thus allowing subsequent ion-exchange reaction with Keggin ions to proceed. The presence of pillars between the interlayers of the buserite structure was confirmed by X-ray diffraction, thermogravimetric analysis, and surface area measurements. N2 adsorption-desorption studies showed that the Keggin ion-pillared buserites are microporous in nature. Particular interest was focused on the studies of the thermal stability of the various materials in different gaseous environment. By complementary studies between X-ray diffraction and thermogravimetric analysis, the intermediates and the final products of these reactions can be identified.Introduction
In the search and development of new and more efficient catalysts for use in the petroleum-related industry in particular, pillared compounds have gradually emerged as an important potential alternative to the presently available industrial catalysts.lJ Among the available layered compounds, pillared clays have received the most attention and seem to have great potential in the area of acid catalysis such as cra~king.l*~ On the other hand, the pillared derivatives of layered metal oxides, such as double hydroxide,4v5 L ~ , M o O ~ , ~ and K2Ti409' etc., although receiving
(1) Figucras, F. Coral. Rev.-Sci. Eng. 1988, 30, 457.
(2) Nitta, M. Appl. Carol. 1984, 9, 151.
(3) Vaughan, D. E. W. Carol. Today 1988, 2, 187.
relatively less attention than pillared clays, have great potential to be important catalytic materials.
Most Mn oxides can be produced by a variety of pathways, and interconversions between different oxides form an important feature of
this
class of compounds! Birnessite, which is a partially dehydrated form of buserite, is widely distributed in soils and sediments. It is one of the important components of manganese(4) D!ezdzon, M. A. Inorg. Chem. 1988, 27,4628.
(5) Pinnavaia, T. J.; Kwon, T.; Tsigdinos, G. A. J . Am. Chem. Soc. 1988, 110, 3653.
(6) Nazar, L. F.; Liblong, S. W.; Yin, X. T. J . Am. Chem. Soc. 1991, 113,
5889.
(7) Cheng, S.; Wang, T. C. Inorg. Chem. 1989.28, 1283. (8) Giovanoli, R. Chimia 1976, 30, 102.
0020-1669/92/1331-1165$03.00/0 0 1992 American Chemical Society
Downloaded by NATIONAL TAIWAN UNIV on August 5, 2009
1166 Inorganic Chemistry, Vol. 31.
No.
7, 1992 Wong and ChengFippure I (a) Top. Na-busmtc structure as seen i n a s c c t m perpen- dicular to the b-ark. Reprinted with permission from ref 12. Copyright
1986 Clays and Clay Minerals ( b ) Bottom: Three-dimensional repre- sentation of the Ka-burcritc structure.
nodules. which are abundant on ocean floor.' The relatively high surface area and transition metal oxide content were some of the main attractions for the study of its possible use as catalyst and adsorbent. Manganese nodules have been found to be as effective as some commercial catalysts and adsorhenu.' Therefore, tt may provide a cheap substitute for some commercial catalysts in the near future. This provides us
an
incentive to study Na-buserite.The chemistry. structure, and other properties of natural bir- nssite and its cation-exchange derivatives are not well undmtood. I n the classification scheme of Burns and Burns,"' the structure of birncrsitc is modeled after that of chalcophanitc. In this model, birnessite has a layercd structure, probably consisting of shccts of water molecules between sheets of edge-sharing .MnO, oc- tahedra (Figure la).'? A three-dimensional representation of the structure is shown in Figure Ib. One out of six octahedral sites in the sheet of MnO, octahedra is unoccupied, hence, the exccss anionic charge must be balanad by cations. These cations include Mn" and Mn3+ ions which originated from the source of manganese in the synthesis of birnessite. They lie above and below each octahedral vacancy. These low-valence Mn cations are coordinated to o x y g m in both the octahedra MnO, s h a t and the water s h a t . Other cations such as Ua* and K' may be present also. depending on the method of synthesis. The synthetic bir-
Scheme I
w m I M P
MnCl,(aq)
+
02(g)+
NaOH(aq)-
Na,Mn,,O,.xH,O(9) Bums, R. G.; BUM, V. M. Philm. Trans. R. Soc. London 1977, A286. 283.
(IO) Bums, R. G.: Burns, V. M. In Mongnnese Dioxide Symposium; Ko- mwa. A.; Brodd, R. J., Edds.: The Elcctrahemical Society: Cleveland,
OH. 1975:
~~~.~~
~.
Vol. 1: ~ .D r306. ~~~~(11) Bums, R. GiBurns. V. M. Murine Mongonesc Deposits; Glasby, G .
(12) Golden, D. C.; Diron, P.. J . B.: Chen, C. C. Cloys Clay Miner. 1986.34,
Ed.; Elsevier: Amsterdam. 1917; Chapter 1.
511.
(13) G&anoli. R.; Buhler, H.: Sokolowska, K. J. Microsc. (Pari*) 1973.18. (14) Giovanoli, R.; StHhli. E.; Fcitknecht. W. Helu. Chim. Aero 1970.53, (IS) Golden, D. C.; Chen, C. C.; Diron. J. B. Clays Cloy Miner. 1987,35,
(16) Cornell. R. M.; Giwanoli, R. Cloys Cloy Miner. 1988. 36, 249. 211. 209. 271. Scheme 11. Preparation of KPB Na-buserne
' '
Kepgin HEB7
KPBnessite has been reported to have a unit cell formula Na4Mn14- 0,.9H,O and is nonstoichiometric."J4 In many cases however, the unit cell formula Na4Mn,40,1dH20 was u ~ e d . ' ~ ~ ~ ~ ~ ' ~ The difference may arise from both the variable oxidation state of Mn and the elemental analysis procedures. The layers of M n 0 6 octahedra are repeated along the c-axis, Le., the axis perpendicular to the plane of the layers. The basal spacing of this compound may be 7
.&
(birnessite) or 10A
(buserite). Buserite is thus the fully hydrated form of birnessite.For buserite to have potential applications in the area of ca- talysis, it must possess high surface area and thermal stability. To increase the surface area of a layered compound, e.g., clays, the most widely used technique is to introduce pillars between the interlayers. The Keggin ion with molecular formula [All,04- (OH),(HzO),,]7+ is a large polyoxo cation which has been re- ported to be thermally stable a t temperature more than 500 OC? Since clay is capable of swelling in water,I7 Keggin ion-pillared clay is normally prepared by a direct exchange method with the Keggin ion solution. Buserite and clay would have different charge densities and hence, a different pillaring technique may he needed. A possible way is to expand the interlayer spacing of buserite with organic compounds before introducing the Keggin ions. This technique has proved successful for a wide variety of layered compounds?J8J9 The aim of this study is to utilize the stepwise pillaring technique on the layered manganese oxide and to characterize the physicochemical properties of the resultant compounds so that their applications in catalysis can be explored.
Experimentnl profedures
Synthesis of Na-Bcmerite. The method of synthesb was adapted from st8hli.20 In this method (Scheme I), 200 mL of a 0.5 M MnCI, solution
was used and 0, was bubbled through it. The 0, flow was controlled at more than 2 Lfmin. A 2 5 0 " aliquot of a cold solution (1 "C) of NaOH (55 g) was then quickly added. The oxygenation was maintained for further 5 h. The black precipitate of Na-buserite formed was filtered. washed, and dried.
Cnticn-Exehange Capncily (CEC). Mg(N0J2.6H2O and KNO, were
wed for the preparation of Mg-buserite and K-buserite, rcspeftively, by ion-exchange. Na-buserite was used as the starting material. The cationic charge conantration for each salt in the exchange solution was about I50 times in excess of Na+ in Na-buserite. The exchange process was carried out for at least I day at room temperature, and the process
was repeated twice. The final product was carefully washed and dried. CEC was calculated an the basis of K (or Mg) uptake in mquiv/100 g of dry Na-buserite.
F'repnration of Keggin Ion-PilIared B d t e . N-Hexylammonium ion-expanded huserite, abbreviated as HEB, was first prepared from Na-buserite via two pathways as shown in Scheme 11. In the onestep proass, a I N solution of a mixture of n-hexylamine and HCI (mole ratio 1:I) was used. The pH of the solution was adjusted to 1, and the ex- change prwess was carried out at room temperature for at least IO days. In the two-step prccess, the Na-buserite was first exchanged with 1 N nitric acid at 70 'C for 7 h. The H-buserite obtained then underwent a second neutralization step with 5 N rrhexylamine at room temperature for I2 days. HEB was used to prepare Keggin ion-pillared buserite, abbreviated as KPB. by ion exchange with Keggin ion solution (Scheme 11). In order to avoid the competition of other cations for the ion-ex- change sites of buserite, the Keggin ion solution was prepared by using
(17) Fink. D. H., Thomas. G. W. SotlSci. Sor. Am. P m . 1964, 28, 147. (18) Clearfield. A.; Rakns. B. D. Inorg. Chcm. 1988, 27. 3211. (19) Lands. M. E., Aufdembnnk. B. A.;Chu. P.; Johnson, I. D.. Kirker.G.
W.. Rubin. M. K. J Am. Chem.Sor 1991. 111. 1189.
(20) Stahli, E. Ph.D. Thesis; University of Bcm; Bcr" Switzerland. 1968.
Downloaded by NATIONAL TAIWAN UNIV on August 5, 2009
Pillared Busserite Inorganic Chemistry, Vol. 31,
No. 7,
1992 1167I
2.42 2.51A
-
-l I--.I
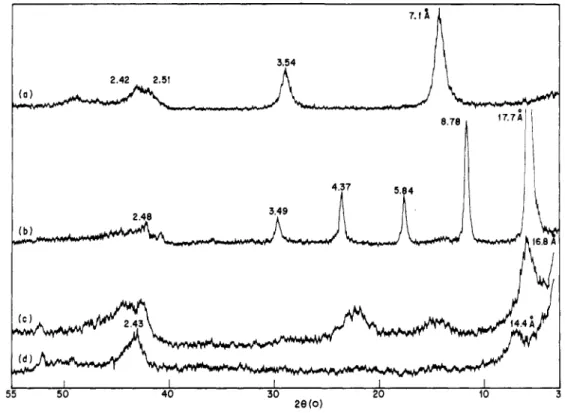
I I I I I 55 50 40 30 20 10 28 ( 0 )Figure 2. XRD patterns of (a) Na-buserite (b) HEB, and (c) KPB before calcination and (d) KPB after calcination at 300 OC.
n-hexylamine to hydrolyze the aluminum chloride solution at 50 OC. In order to keep the solution clear at all time, n-hexylamine was added dropwise to the aluminum chloride solution over a period of 3-4 days. When the solution reached a pH between 4.1 and 4.2, it was filtered and aged at 50 OC for 2 h before being used for the exchange reaction. A 1-g sample of HEB powder in 300 mL of exchange solution was used. The exchange temperature and solution concentration were normally 50 OC and 0.6 N (in terms of AI), respectively, unless otherwise stated. The product obtained was calcined in air at 300 OC for 2 h before it was used for further study.
Characterization Techniques. In the elemental analysis, 10 mg of the sample was first dissolved in 4 mL of 12 N HCI. The resulting solution was then diluted to 100 mL with deionized water (stock solution). Im- mediately, 5 mL of the stock solution was transferred to another 100-mL volumetric flask and then made up to 100 mL (sample solution). A 7-mL aliquot of the 12 N HCI was then added to the sample solution to prevent precipitation. Elemental concentration was determined with a Perkin- Elmer SO00 atomic absorption spectrophotometer.
Surface area measurements were done volumetrically. For the surface area measurement with N2 specifically, a Micromeritics Accusorb 2100E instrument was used. Benzene and water used in the surface area study were purified by frequent expansion-pumping cycles in the vacuum manifold. The surface areas were calculated based on BET theory. The adsorption and desorption isotherms were obtained on a Cahn TG-121 system with sensitivity on the order of 0.1 pg.
Powder X-ray diffraction (XRD) patterns were obtained on a Philips PW 1840 automated powder diffractometer, employing Ni-filtered Co Ka radiation. Infrared (IR) spectra were recorded on a Perkin-Elmer 983 spectrometer. The spectra were taken in a form of KBr pellets. Thermogravimetric analysis (TGA) was carried out on a Du Pont 951 TGA analyzer. The analysis was monitored and controlled by an on-line computer system. In this technique, about 15 mg of the sample was heated in a stream of carrier gas at 10 OC/min. The carrier gas flow rate used was 100 mL/min.
Results and Discussion
Synthesis and Characterization of Na-Buserite. The reaction
pathways for the synthesis of Na-buserite from MnCl, were described elsewhere.'6-21 Thus, in alkaline medium, MnCl, was oxidized by O2 through Mn(OH), to Mn304, which was an in- t e r m d i t e in the synthesis of Na-buserite.21 As NaOH was used as a base in this synthetic method, the as-synthesized buserite contained interlayer Na+ ions as the major charge balancing
(21) Lee, Y. C. M.Sc. Thesis, National Taiwan University, Taipei, Taiwan,
1990.
cations. Na-buserite obtained in this way was a black precipitate. Its identity was confirmed by its XRD pattern and IR spectrum with reference to the literature data.'2.22
The unit cell formula for the synthetic Na-buserite here is tentatively chosen as Na4Mn,4026-xH20. This formula gives a Na/Mn ratio of 4/ 14. The Na-buserite samples that we prepared showed an average ratio of 4.2/14, which is similar to the literature value. The experimentally determined O/Mn ratio of about 30/14 is higher than the expected value of 26-27/14. As the amount of oxygen atoms in the samples is determined by subtracting the weight of N a and Mn from the total dry weight used for the elemental analysis, the observed difference is assumed to be due to the strongly adsorbed water and/or impurities.
The average cation-exchange capacities, abbreviated as CEC, were determined to be 322 and 232 mequiv/100 g, on the basis of Mg and K uptake, respectively. These results show that Mg2+ is a more efficient cation exchanger than K+, which may be related to the greater charge/radius ratio. The higher ionic potential make Mg2+ more effective in layer-charge neutralization. On the basis of K uptake, the CEC value compared well with the value reported by Golden et a1.12 of 240 mequiv/100 g. The CEC value on the basis of Mg uptake, however, is closer to the theoretical value of 313 mequiv/100 g, calculated from the unit cell formula of Na-buserite. Thus, using Mgz+ as cation exchanger will provide a more accurate assessment on the layer-charge density of Na- buserite than K+.
Reparation of Pillared Buserite. The interlayer distances of
a layered compound can be determined from the first low-angle diffraction peak in the XRD diffractogram. The interlayer dis- tance of the fully dehydrated Na-buserite is about 7
A
as shown in Figure 2a. Using the known diameter of the Na+ ion (1 -94A),
the basal thickness of Na-buserite could be estimated, i.e., 5.06A.
The diameter of Keggin ion, abbreviated as Al13, has been determined both by theoretical means23 and by small angle scattering24 to be about 8.6A.
Therefore, even if the Na-buserite was fully hydrated during the exchange process, the free interlayer spacing of 4.94A
is still too small for Al13. Hence, it is under- standable that a direct exchange of All, for Na+ ions in Na- buserite will not be successful.This
was found to be experimentally(22) Potter, R. M.; Rossman, G. R. Am. Mineral 1979, 64, 1199. (23) Johansson, G. Acta Chem. Scand. 1960, 14, 769, 771. (24) Rausch, W. V.; Bale, H. D. J. Chem. Phys. 1964, 40, 3391.
Downloaded by NATIONAL TAIWAN UNIV on August 5, 2009
1168
Inorganic Chemistry,
Vol. 31, No. 7, 1992true. A stepwise process was then deviced to improve the viability of this pillaring technique, as shown in Scheme 11.
The stepwise exchange technique utilizes the n-hexylammonium ion, abbreviated as HA, to expand the interlayer spacing, Le., from
10 to about 18
A.
This value is well fitted in the empirical equationshown by Golden et al.lz During the exchange process, the mo- lecular axis of HA is probably oriented parallel to the plane of the buserite layers so that diffusion into the interlayers is possible. As more and more H A ions are accommodated inbetween the layers, the HA ions should line up with their ammonium ion heads pointing toward the basal layers. The XRD pattern of HEB is shown in Figure 26. In the preparation of HEB, both the one-step and the two-step exchange processes gave the same intensity of
the 18-A peak. The resultant free spacing of about 12.9
A
providesless steric restriction for All to diffuse into the interlayers. Since alkyl chains grow by 1.27
A
per added carbon, the free spacingof 12.9
A
suggests that the interlayer H A formed double layerswith the ammonium ion heads pointing toward the basal layers. Assuming that the ends of the alkyl chains in both layers are lying side by side, the inclination angle of the alkyl chains to the basal plane is estimated to be at about 52'. This angle is lower than the actual angle of 72O, calculated from the actual growth of the basal spacing per added carbon.12 This means that the alkyl chains in the top and bottom layers of the bilayer overlap each other to some extent.
The presence of H A in the interlayers of HEB is further sup- ported by the observed IR bands in the C-H stretching (2953 and 2922 cm-l) and bending (1490 and 1463 cm-') regions.
KPB was prepared from HEB via cation-exchange with All, solution. The XRD pattern of the sample after the exchange process (Figure 2c) showed a shift of the first peak to 16.8
A.
The base of this peak broadened, and a shoulder was observed a t an interlayer spacing of about 14A.
When the KPB sample was calcined in air a t 300 O C , the 16.8-A peak vanished and a small peak was observed at interlayer spacing of 14.4A
as shown in Figure 2d. The calcination process burned away interlayer organic species, and revealed the 14-A peak, which was attributed to the layer distance of aluminium Keggin ion illared buserite. Only nation. The interlayer spacing of 14A
corresponds closely to the sum of the basal thickness of Na-buserite and the diameter of AIl3, Le., 13.66A.
It provides the first indication to the presence of All3 in the interlayers.Different preparation conditions for KPB were examined, such as temperature, exchange period, Keggin ion concentration, etc. Unfortunately, the influence of the reaction conditions on the quality of KPB was ambiguous, due to the low intensity of the 14-A peak. The quality of both the HEB and KPB compounds was based on the intensity of the first low-angle XRD peak. However, a higher concentration of All3 in the exchange solution did not produce a better KPB, with pillars uniformly distributed in the interlayers. Moreover, it was observed that the quality of HEB played a limiting role on the quality of KPB.
Elemental analysis was carried out on the KPB samples pre- pared from different concentrations of All3 solutions. The per- centage of the cation-exchange sites in KPB occupied by All3 are all greater than 100% (by <30%), assuming that All3 is the only species present on KPB. However, in aqueous solution, All, can be hydrolyzed to other AIt3 species with lower charge e.g. from
7+ to 6+ and 5+, with liberation of H+.3*25 This can explain
the abnormally high percentage of the exchange sites occupied by A l l 3 Besides, adsorption of polynuclear species may take place concurrently with the ion-exchange process.
BET Surface Area and Porclsity of Na-Buserite and
KPB.
The surface areas of Na-buserite and KPB determined with different adsorbates are given in Table I. The surface areas of Na-buserite determined with N2 range from 42 to 72 m2/g. These values are higher than that of Cornel1 and Giovanoli16 of 8 m2/g on a re- crystallized sample. The kinetic diameter of the N, molecule is one original Na-buserite peak at 2.431
remained after calci-Wong and Cheng
(25) Bottero, J . Y.; Cases, J. M.; Fiessinger, F.; Pokier, J. E. J . Phys. Chem.
1980, 84, 2933.
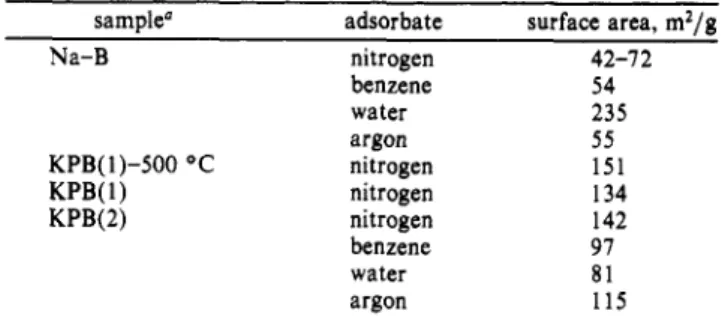
Table I. Surface Areas of Na-Buserite (Na-B) and KPB with Different Adsorbates
sample" adsorbate surface area, m2/g
Na-B nitrogen 42-1 2 benzene water argon KPB(1)-500 'C nitrogen KPB(1) nitrogen KPB(2) nitrogen benzene water argon 54 235 55 151 134 142 91 81 115 'KPB samples were all precalcined at 300 "C except as otherwise indicated. All the samples were dehydrated at 140-160 'C before the surface area measurement. The concentration of the exchange solu- tions in KPB preparation is (1) 1 .O N and (2) 0.6 N.
3.64 Therefore, the free spacing of Na-buserite of 1.94
A
in the dehydrated form cannot allow the N 2 molecules to enter the interlayers. Hence, only the external surface area was measured. Thus, the higher surface area of Na-buserite compared to literature values indicates that the layered structure may be in smaller fragments.
The surface area of Na-buserite determined with benzene is comparable to that with N,; the slightly lower value can be ex- plained in term of localized adsorbed benzene molecules with poor packing as a result of the strong interaction between their ?r-
electron clouds. The surface area determined with water is far higher than these two values. The kinetic diameter of the water molecule is 2.65
A
and is larger than the interlayer free spacing of dry FA-buserite. The electrostatic field between the framework oxide anions and the extra-framework Na+ cations must be strong, in order to force the polar water molecules into the interlayers. The driving force should be an ion-dipole interaction between the electrostatic field of Na-buserite and water molecules. This electrostatic field is quite high judging from the CEC data and is thus responsible for the ready hydration of Na-buserite.The KPB samples calcined at 300 OC showed an increase of about 100% in surface area compared to Na-buserite. A control experiment by exchanging HEB with 1 N NaCl solution showed only a slight increase in surface area, i.e. from 42 to 52 m2/g. When the same batch of HEB sample was used for the pillaring reaction, the product obtained gave a surface area of 133 m2/g. Therefore, the large increase in surface area of KPB is definitely due to the pillaring of the layers. The results also showed that a higher concentration of Keggin ion exchange solution did not yield a KPB sample of higher surface area. Both benzene and water adsorption gave much lower surface areas than N2. This effect cannot be fully explained by the blocking and steric hin- derance effects by the pillars, as the surface area determined using water is lower than those determined using N, and benzene. However, if water or benzene chemisorbs on the pillars, it will block the entrance of incoming molecules into the inner space of the interlayers. This is possible since the Keggin ion that form the pillars has a bulky structure, as had been proposed by Jo- h a n s s ~ n . ~ ~ . ~ ~ If the pillars are located near the entrance of the interlayers, the assumed phenomena may cause even greater drop in surface area. It should be noted also that the surface area determined with water for KPB is much smaller than that of Na-buserite, although the free interlayer spacing of KPB is much larger than that of Na-buserite. This result immediately suggests a lower electrostatic field in KPB. The replacement of Na+ cations by the A l l 3 pillars resulted in a smaller electronegativity difference between extra-framework cations and framework oxide anions. Thus, the interaction between the electrostatic field and the dipole of water molecules is smaller, which resulted in less hydration. The surface areas measured with Ar (kinetic diameter = 3.40
A)
are consistently lower than those measured with N2This
may be related to the difference in shapes of Ar and N, and thus their~~ ~~
(26) Breck, D. W. Zeolite Molecular Sieves; Wiley: New York, 1973; p 636.
Downloaded by NATIONAL TAIWAN UNIV on August 5, 2009
Pillared Busserite Inorganic Chemistry, Vol. 31,
No.
7, 1992 1169 0 - 150--1
VI x a 0 0 120 n u 0 0 9 0 ISI -2-
0 0 6 0'
0030 v . _ _ . + - - - - a - 0 000:
x 0lZOt
a u .. 0,000 0 , 2 0 0 0.400 0.600 0.800 1.000 P/PoFigure 3. N2 adsorption-desorption isotherms of (a) Na-buserite (b) KPB-50, and (c) KPB-70.
Table 11. IR Absorption Freuuencies of Na-Buserite and KPB sample TP," O C frequency, cm-' Na-B*
...
633 512 480 421 359 227 Na-B...
630 512 477 414 359 215 Na-B 300 509 445 238 Na-B 500 555 468 417 307 204 KPB...
Sh' 511 481 426 KPB 300 543 215 KPB 500 557 216a Tp is the pre-calcined temperature. *Data taken from ref 12. CSh = shoulder.
packing behavior on the surface. However, they gave similar surface area ratios for KPB to Na-buserite.
The KPB sample retained its structure when calcined in air at 500 OC (2 h) and gave a comparable surface area to that of the sample calcined at 300 OC. In addition, the XRD pattern of KPB calcined at 500 "C showed that the pillars remained intact.
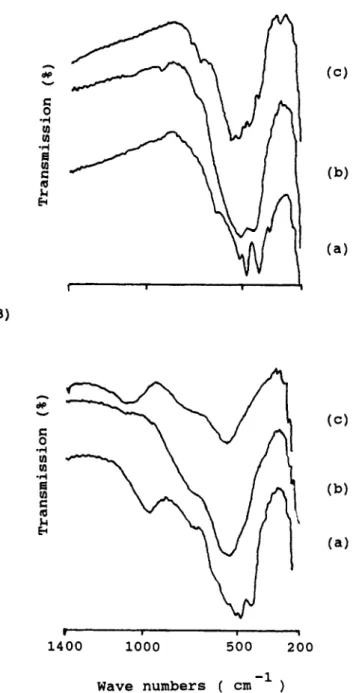
The N 2 adsorption-desorption isotherms for various samples are shown in Figure 3. The number associated with KPB samples is the exchange temperature. Other than the weight of N 2 ad- sorbed (Wah), the isotherms for KPB-70 and KPB-50 are similar. The surface area of KPB-70 is slightly higher than that of KPB-50. Thus, 70 OC is a better exchange temperature to prepare a pillared sample of higher surface area. Only small amount of hysteresis, which corresponded to a mesoporous structure, was observed on both isotherms. Hence, the pillaring process produced KPB samples with a large proportion of micropores. On the other hand, although Na-buserite also showed microporous adsorption-de- sorption behavior, the amount of N 2 adsorbed was negligible. Tkrmal Stability of Na-Buserite and KF'B. (i) Infrared Study. The IR spectra and data for Na-buserite upon calcination at different temperatures are shown in Figure 4A and Table I1 respectively. The IR bands in the lattice vibrational region (200-1400 cm-I) of Na-buserite are similar to those obtained by Potter and Rossman.22
Progressively dehydrating the Na-buserite by heating in air at higher temperatures caused a corresponding decrease in the crystallinity of the sample. The spectrum obtained after calci- nation at 300 OC is similar to that of birnessite, suggesting that only dehydration occurred. Na-birnessite, with unit cell formula Na4Mn14026.9H20 is the partially dehydrated product of Na- buserite. At
this
temperature, considerable broadening of IR bands occurred, indicating a higher degree of disorder than that observed at room temperature. The peaks shifted slightly to higher fre- quencies. The diffuse nature of the peaks has been attributed to some degree of disorder in the stacking of M n 0 6 sheets.I6 Consistently, the XRD peaks became very weak and diffuse. This behavior, however, is quite reversible as readsorption of water (19 h) partially reproduced its original intensity. Hence, Na-buserite was mainly in a disordered state when calcined at 300 OC.Upon calcination at 500 OC, new bands appeared, indicating the formation of new compounds. These observations are in line with the results of XRD (refer to part ii). Similarly, Golden et
0 Y dp c 0 -rl Io Io *rl B Io c Q Lc h h
c
.rl Io 1 1400 1000 500 200 Wave numbers (cm
-1 )Figure 4. IR spectra of (A) Na-buserite and (B) KPB on calcination at (a) 25, (b) 300, and (c) 500 O C .
al.I2 observed that transformations of the layered birnessite into other species took place via a disorder state at about 200-400 OC. The IR spectra of the KPB samples on calcination at different temperatures are shown in Figure 4B. The corresponding fre- quencies are shown in Table I1 as well. As can be seen, the spectrum of KPB before calcination is slightly different from that of Na-buserite in the lattice vibrational region. The difference is not due to the replacement of Na+ by HA, since Na-buserite and HEB have identical spectral features in the lattice vibrational region. It may not arise from the replacement of Na+ by H+, which could take place as the pH of the exchange solution of 4.1-4.2 is acidic. This is because Golden et a1.12 have shown that IR spectra of Na-buserite are not affected by the nature of the non-transition metal cations. Therefore, the difference must arise from the pillaring of the buserite interlayers. Calcinations at 300 and 500
OC
in air gave similar spectra, thus supporting the XRD results that no new compounds were formed. However, the broadening of peaks implies some extent of disorder in layered structure upon calcination. These spectra are similar in feature to one of the bimessite samples studied by Potter and Rossman,22Downloaded by NATIONAL TAIWAN UNIV on August 5, 2009
1170 Inorganic Chemistry, Vol. 31, No. 7, 1992
0.2-
0 . 1 -
0.0-
Wong and Cheng
7 0 1 1
i
0 200 400 600 800 Temperature ( O C ) (e) 0.3 Desorption of Water ( e )-
-0.i 0 200 400 600 E T e m p e r a t u r e ('C)Figure 5. (A) TGA and (B) DTG profiles of Na-buserite in (a) N2 (b) N,:H2 = 9:1, and (c) 02.
but the frequencies of the major bands shifted slightly (about 30 Scheme 111. Transformation of Na-Buserite 0
cm-I) to higher frequency.
(ii) Complementary TGA/DTGXRD Study. The TGA and DTG profiles of Na-buserite in different gaseous environment are shown in parts A and B of Figure 5, respectively. For the purpose of clarity, these profiles and that of Figure 6 were shifted along the y-axis. Thus, only the relative magnitude should be considered. The transformation of Na-buserite in various gaseous environments is also summarized in Scheme 111.
In an N2 environment, the first two DTG (percentage weight loss per
"C)
peaks are due to the desorption of physisorbed and chemisorbed water, respectively. These peaks are omitted in subsequent discussion. The small peak at 373 OC is probably due to the slight loss of lattice oxygen, since it became less distinctDownloaded by NATIONAL TAIWAN UNIV on August 5, 2009
Pillared Busserite Inorganic Chemistry, Vol. 31, No. 7, 1992 1171 ( A )
I
7 5!
0 200 400 600 E Temperature ('C) ( B ) Desorption of Water 334 'cil
I \
6 9 8 'c I I 200 400 600 0 Temperature ('C) Figure 6. (A) TGA and (B) DTG profiles of KPB in (a) N2, (b) N2:H2 = 9:1, and (c) 02. in an O2 environment. This temperature probably starts thetransformation of Na-buserite beyond the previously mentioned disorder state. From the weight loss in the TGA profile, the Mn to 0 stoichiometry of the compound(s) formed is determined to be Mn203,S. There is an uncertainty of i O . 1 associated with the oxygen atom. Thus, M n 2 0 3 is likely to be one of the species formed at this temperature. The other species formed should have an O/Mn ratio greater than Mn203 (O/Mn = 3/2).
XRD
analysis was carried out on a separate Na-buserite sample heated in N 2 at 320 OC for 2 h and showed the formation of a species belonging to the hollandite group (possibly hollandite). Hollandite, with O/Mn = 2,1s922 meets the above requirement. It consists of MnOs octahedra which share edges to form double chains, which then linked by share vertices forming [2 X 21 channels. Theabsence of conclusive evidence on the formation of Mn203 from
XRD
may mean that it is amorphous at this stage.The last peak at 529
OC
is due to the formation of M n 3 0 4 (hausmannite) as detected byXRD. XRD
analysis was done separately with a sample heated at 550OC
in N 2 for 2 h. Another species detected byXRD
belongs to the hollandite group, as mentioned before. Both species giveXRD
peaks of similar in- tensity. The presence of hollandite group species besides haus- mannite (O/Mn = 4/3) will cause the overall O/Mn ratio of the compounds formed to be greater than 4/3. In fact, the overall Mn to 0 stoichiometry of the compounds formed determined from TGA is Mn304,9, which is thus consistent with the above sug- gestion. Hence, the overall transformation of Na-buserite in N 2 occurs with a total loss of oxygen as observed in TGA.Downloaded by NATIONAL TAIWAN UNIV on August 5, 2009
1172
Inorganic Chemistry,
Vol. 31,No.
7, 1992 Wong and Cheng Scheme IV. Transformation of KPBMnO
Similar intermediates may be formed during the reduction of Na-buserite with a mixture of H2 and N2. From TGA/DTG analysis, the peaks at 282,347, and 426 OC can be related to the formation of MII~O,,~, Mn304,1, and MnOl,l, respectively. The identity of the last two species was confirmed by XRD, with samples reduced at 300 and 500 OC for 2 h, respectively. However, the peak at 282 OC was not confirmed due to its small and variable magnitude. Strohmeier and Hercules2' have also shown that the reduction of 8-MnO, proceeds through similar pathways in an H2 atmosphere:
B-MnO2
-
Mn203-
Mn304-
MnO Mn
The reduction temperatures for various species, however, are lower than the temperature observed here, which may reflect different materials and heating rates.
The TGA/DTG profiles of Na-buserite do not show distinct weight lasses in O2 environment. A gradual weight loss occurred between 300 and 500
OC.
The calculated Mn to 0 stoichiometry of the compound(s) formed at this stage is Mn14025,2; thus, only a very small amount of oxygen is last. The DTG profile indicates an increase in weight (negative peak) at 560 "C. When a Na- buserite sample was calcined in0,
a t 550 OC for 2 h, the X R D pattern showed the formation of Na2Mn5010 with major peaks at d = 5.38, 2.41, and 4.86A.
A hollandite group compound (possibly cryptomelane) was formed in smaller quantities. Hollandite and cryptomelane have the same tunnel structure but with different symmetry.?2 The formation of Na2Mn5010 and cryptomelane require an uptake of O2 by Na-buserite, and this accounts for the negative peak. Mg-buserite, which gave only hausmannite,12 did not show this negative peak, but a DTG peak corresponds to a distinct weight loss at 629OC.
K-buserite, which gave mainly cryptomelane,I2 showed this negative DTG peak at about 556 OC. These results further support the origin of the negative DTG peak at 560 OC. The amount of Mn304 formed is negligible. This explains the absence of distinct weight losses between 300 and 500OC.
Hence, the loss of oxygen from Na- buserite is negligible.When Na-buserite was calcined in air a t 550 OC for 2 h, the main products formed were similar to those for Na-buserite calcined in pure oxygen. When the sample was heated a t 800 OC, bixbyite (Mn203) and Na4Mn9018 were formed. The XRD pattern of the latter compound has major peaks at d = 4.55, 2.63, and 2.40
A.
Thus, Na-buserite behaves differently in different environments below 800 O C . Hydrogen tends to reduce Na-buserite to MnO
whereas oxygen and air tend to oxidize Na-buserite to Na2MnSOlo and crytomelane. However, a reduced compound (Mn203) can be formed at high temperature. In nitrogen, a mixture of reduced (Mn304) and oxidized (hollandite) compounds is formed.
The TGA and DTG profiles of KPB are shown in parts A and B of Figure 6, respectively. The transformation of KPB in various gaseous environment is also summarized in Scheme IV.
In an N 2 environment, a DTG peak was observed a t 468 OC, which can be. assigned to the water loss as a result of condensation
of AlI3 hydroxyl groups. At 627 OC, transformation of KPB to Mn304 occurred as detected by XRD. Thus, the pillars must have collapsed, forming possibly A1203. The thermal stability of KPB is thus quite similar to that of Al13 pillared bentonite, which is thermally stable to 500 0C.28 Heating at 600 and 700 OC caused a partial collapsed of the layered bentonite structure.
Comparison of the DTG profiles for KPB before and after calcination at 300 OC showed that the interlayer HA decomposed a t 235 OC in N2. DTG profiles of HEB also gave the same decomposition temperature. Water is lost at a lower temperature between 37 and 43 O C for the calcined sample, which may be the result of less blocking for desorption by HA.
The DTG profile for KPB in an O2 environment is similar to that in N2. The structure however, collapsed at a higher tem- perature in O2 (698 "C). When the sample was calcined in air for 2 h at 700 "C, Mn304 or Mn2O3 was formed. At 500 OC however, the structure remained intact.
In an H2 environment, there are two peaks observed in the DTG profile centered at 334 and 448 OC. The latter peak is not always well resolved. It was found from XRD for a sample reduced at 600 OC for 2 h that the product of reduction was a mixture of Mn304 and MnO, with MnO as the minor component. Quali- tatively, the amount of MnO formed is far less for KPB than for Na-buserite at a similar reduction temperature.
The results obtained from the complementary studies between TGA/DTG and XRD techniques showed that KPB is relatively more stable than Na-buserite in all of the gaseous environments studied. These results also showed that KPB is stable in air in excess of 600 OC. Thus, the pillars in the interlayers improve the thermal stability of the buserite structure.
Conclusion
The results showed that KPB can be prepared via an ion-ex- change process from Na-buserite. However, the free spacing of the Na-buserite has to be expanded with n-hexylammonium ions prior to the introduction of Keggin ions between the layers. XRD gave convincing evidence on the presence of pillars in the inter- layers. The low intensity of the first diffraction peak a t 14
A
indicates that the pillars are not uniformly distributed and/or not many pillars are introduced between the layers. It must be mentioned that the XRD patterns were obtained with unoriented samples.The success of pillaring Na-buserite was also confirmed by a surface area study, TGA, and IR spectroscopy. Unlike Na- buserite, surface area measurement on KPB showed that the interior of the interlayers are now accessible to molecules as large as benzene. N 2 adsorption-desorption studies revealed the mi- croporous nature of KPB. TGA on the other hand has indicated an improved thermal stability of KPB to Na-buserite in all gaseous environments. The pillars in KPB are stable up until 600-700 O C in either an N 2 or an O2 environment. Beyond these tem- peratures, the pillars collapsed and Mn304 (or Mn203) was formed from the buserite structure.
Unfortunately, in an H2 environment, KPB transformed to a mixture of Mn304 and MnO. The transformation began at about 300 OC. This process may occur as a result of reduction of the buserite framework. Therefore, KPB is not suitable for use as a catalyst or a catalyst support for reactions involving H2, such as C O hydrogenation. KPB exhibits better thermal stability in an environment where O2 is present.
A preliminary study on oxy-dehydrogenation of ethane showed that KPB performed better than Na-buserite. The activity is higher in KPB but the selectivity to ethene is comparable. The observed increase in activity must be due to the pillaring of the layered structure of buserite. This topic will be further investigated and reported in a separate article.
Acknowledgment. Financial support from the National Science Council of the Republic of China is gratefully acknowledged.
(27) Strohmeier, B. R.; Hercules, D. M. J . Phys. Chem. 1984, 88, 4922. (28) Occelli, M. L. Ind. Eng. Chem. Prod. Res. Dev. 1983, 22, 553.
Downloaded by NATIONAL TAIWAN UNIV on August 5, 2009