Estimation and Trend Analysis of Biomass Production in River Basin in Taiwan: 2. Case in Gaobing River Basin
7
0
0
全文
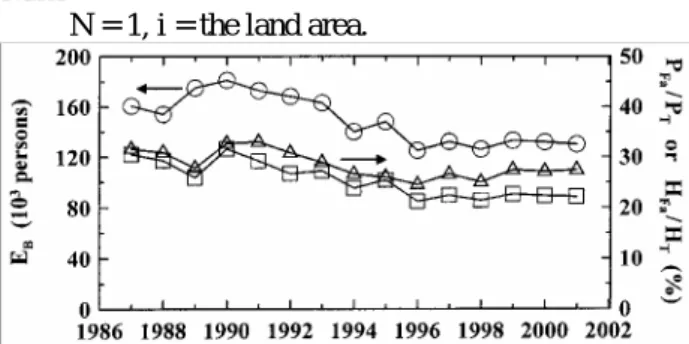
(2) 10. Journal of the Chinese Institute of Environmental Engineering, Vol. 14, No. 1 (2004). governmental statistics are collected for evaluating the material related indictors proposed by WRI et al. [12]. In addition, some environmental indicators related to the economic development reported by Ausubel [13] such as population (P) and gross domestic product (GDP) are discussed in this study. The results can be referred for dealing with policy-making affairs, economic efficiency and environmental consideration in the Gaobing River basin. Furthermore, they can also be served as the useful information for assessing the improvement of the development in Taiwan. METHODOLOGY The data about biomass (including crop, forestry, fishery and livestock) production during 1987 to 2001 in the Gaobing River basin are collected from the Statistical Abstract and Agricultural Statistical Yearbook, which are published by the county and municipal governments [14-16] and Council of Agriculture of Taiwan [17], respectively. The administration districts (or areas) in the Gaobing River basin include Kaohsiung city, 12 towns (or villages) of Kaohsiung County, Ping Tung City and 9 towns (or villages) of Ping Tung County. The individual data about these districts are collected and summed for the further investigation. The counting of the material flows is based on the well defined functional parameters, which can provide the useful and standardized approach, assuring that the calculations of different kinds of materials are based on the same principles [12,18]. However, some data of some items are not available in some districts. This study adopts the methodology of similarity and proportionality to estimate these unknown items from the known information as follows. The estimated unknown amount of material j of the specific towns of the county in the Gaobing River basin = total statistical amount of the whole county in N the Gaobing River basin × ∑ R i / N (1) i =1 Ri = the ratio of known amount of material i of the specific towns of the county in the Gaobing River basin to that of the whole county in the Gaobing River basin. N = total number of i. The applicable counties in the Gaobing River basin are Kaohsiung County and Ping Tung County. As illustrations, the estimations of some unknown items are listed as follows. Case 1. Estimation of flowers, forage and green manure crops: N = 5, i = the products of rice, common crops, specific crops, vegetable and fruits. Case 2. Estimation of hairy antlers, cow's milk, honey and royal jelly: N = 5, i = the yields of beef, pork, lamb, domestic fowls and egg. Case 3. Estimation of wood, bamboo, forest byproduct, afforestation area, tree felling, and aquatic. farm: N = 1, i = the land area.. Fig. 1. Time variations of EB ( ○ ), PFa/PT ( △ ) and HFa/HT ( □ ) in Gaobing River basin. EB: agricultural employmee PFa: farm population. PT: total population. HFa: farm households. HT: total households.. Case 4. Estimation of pelagic, inshore, and coastal fishing, sea farming, and inland breed: N = 1, i = the fishery population. Case 5. Estimation of biomass industrial GDP (GDPB): N = 1, i = agricultural employment (EB) Case 6. Estimation of total GDP (GDP): N = 1, i = population. In addition, due to the lack of the statistical data of EB during 1994-2000 in Kaohsiung County, the EB is estimated by assuming that EB is proportional to the farm family ratio (HFa/HT, ratio of farm to total households). Furthermore, the statistics in the governmental organizations’ web sites has also been referred to examine the reliability of data [19-22]. The non-weight units of the data are converted to weight based on the Chinese National Standard of Taiwan (CNS). The calculation of hidden flows is not considered in this study because of the lack such data.. RESULTS AND DISCUSSION The EB, ratio of farm to total populations (PFa/PT), and ratio of farm to total households (HFa/HT) in the Gaobing River basin are shown in Fig. 1. It shows that the EB decreases gradually with time, especially during 1992-1996 with 25% reduction. The EB approaches to the stable value of about 135,000 employees after 1996. The PFa/PT with the average value of about 28% varies only slightly with time. Moreover, the farm population (PFa), which decreases 7.5% from 245,051 persons in 1987 to 226,568 persons in 2001, is considered more stable comparing with the EB (with the reduction of 19% from 1987 to 2001). The variation trend of HFa/HT is similar to that of PFa/PT. The ratio of average values of PFa/HFa to PT/HT is about 1.1. Therefore, the persons in the farm households are about 10% greater than those in the total households..
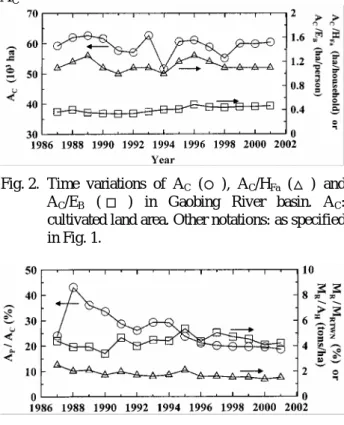
(3) Chungfang Ho Chang et al. : Estimation and Trend Analysis of Biomass Production in River Basin in Taiwan: 2. Case in Gaobing River Basin. Regarding the cultivated land area (AC), AC per farm household (AC/HFa) and AC per agricultural employee (AC/EB) are shown in Fig. 2. The value of AC. Fig. 2. Time variations of AC ( ○ ), AC/HFa ( △ ) and AC/EB ( □ ) in Gaobing River basin. AC: cultivated land area. Other notations: as specified in Fig. 1.. Fig. 3. Time variations of Ap/AC (○), MR/MRTWN (△) and MR/AH ( □ ) in Gaobing River basin. Ap: planted land area. MR: regional rice production. MRTWN: whole rice production in Taiwan. AH: harvested land area. AC: as specified in Fig. 2.. ranges about 59 (± 3) × 103 ha over the period of 1987 to 2001, while the average value of AC/HFa is 1.15 ha/household. The maximum value of AC/HFa is 1.3 in 1996 due to the significant decrease of the farm households in Kaohsiung County. The value of AC/EB is below 0.4 during 1986-1993, and increases slightly from 1994 to 1996 because of the decrease of EB. The AC/EB has a maximum value of 0.487 (in 1996) with the increase of 46% comparing the minimum value of 0.334 (in 1991). The ratios of planted to cultivated land areas (AP/AC), regional to whole Taiwan rice productions (MR/MRTWN) and the rice product per harvested land area (MR/AH) in the Gaobing River basin vary with time as shown in Fig. 3. The percentage of AP/AC with the average value of 26.3% has a maximum value of 43.1% (in 1998) and a minimum value of 18.6% (in 2001). It reveals that the proportion of rice planting area becomes lower. This may be because that some crops with high economical value are planted instead of rice planting. The regional rice production (MR) in the Gaobing River basin shows a significant decrease of 55.7% from 158, 462 tons in 1987 to 88,397 tons in 2001. Correspondingly, the MR/MRTWN value of. 11. 2.52% and 1.51% in 1987 and 2001, respectively, shows a gradual decrease with time. Nevertheless, the MR/AH value varies within 3.4-5.4 tons/ha showing a moderate variation. The average value of MR/AH of. Fig. 4. Time variations of AF/PT (○) and TF/PT (△) in Gaobing River basin. AF: reforestation land area. TF: reforestation trees. PT: as specified in Fig. 1.. Fig. 5. Time variations of HFi/HT (○), AFi/HFi (△) and AFi/EFi ( □ ) in Gaobing River basin. HFi: fishermen household. AFi: aquaculture land area. EFi: fishery employee. HT: as specified in Fig. 1.. 4.4 tons/ha is greater than that in the Tamsui River basin, showing a higher productivity of rice. A comparison of the results indicate that the cause of reduction of rice production in the Gaobing River basin is mainly due to the decrease of AP but not of the productivity of rice denoted as MR/AH. The time variations of reforestation area per person of total population (AF/PT) and reforestation tress per person of total population (TF/PT) in the Gaobing River basin are shown in Fig. 4. The value of AF/PT initially decreases with time to reach a minimum value of 0.17 ha/103persons in 1993. Afterwards, the AF/PT increases reaching a maximum value of 0.64 ha/103persons in 1999 due to the encouragement of reforestation policies of the government. The variation trend of TF/PT is similar to that of AF/PT with maximum and minimum values of 1,227 and 391 stocks/103persons, respectively. The average value of TF/AF is about 2093 stocks/ha during 1986-2001. Furthermore, the recent variations of AF/PT and TF/PT become stable due to the enhancement of environmental protection consciousness. The variation of fisherman to total households ratio (HFi/HT), aquaculture land area per fisherman household (AFi/HFi) and aquaculture land area per.
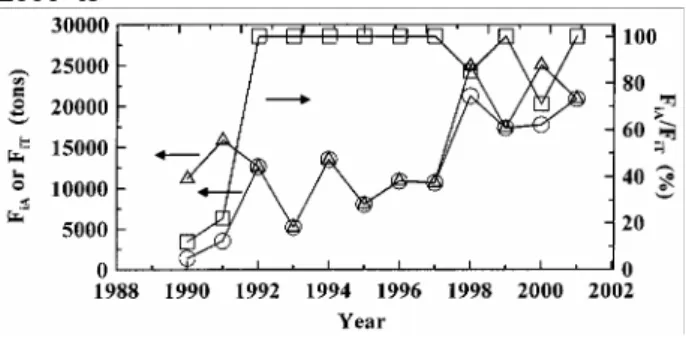
(4) 12. Journal of the Chinese Institute of Environmental Engineering, Vol. 14, No. 1 (2004). person employed in fishery (AFi/EFi) are shown in Fig. 5. The value of HFi/HT mainly ranges between 2.02.5% and decreases in the recent years. Note that the HFi value decreases from 5,444 households in 2000 to. of MPG begins to decrease due to the eruption of foot and mouth disease in 1997. Note that Taiwan EPA (TAIEPA) also promotes the policies to help pigraising households to transfer their occupations and processes the drift fence of pig farm to reduce the. Fig. 6. Time variations of FiA (○), FiT (△) and FiA / FiT ( □ ) in Gaobing River basin. FiA: aquaculture fishery production. FiT: total fishery productions.. Fig. 7. Time variations of productions of MPG (○) and ML (△ ), and MPG/ML (□ ) in Gaobing River basin. MPG: weight of pigs production. ML: weight of livestock production.. 4,111 households in 2001 showing an apparent decrease of fisherman households in the Gaobing River basin. Moreover, AFi/HFi and AFi/EFi have the higher values prior to 1990 while decrease remarkably during 1990-1992 due to the increases of HFi and EFi during that period. The values of AFi/HFi and AFi/EFi after 1992 approach to the stable ranges of 1.3-2.0 ha/household and 0.5-0.6 ha/person, respectively. In addition, the time variations of the ratio of aquaculture fishery production (FiA) to total fishery production (FiT) are shown in Fig. 6. It is obvious that the aquaculture fishery becomes a major portion in the fishery industry from 1992 due to its high economic benefit. The water used in the aquaculture fishery is drawn from the ground water. However, the environment has been seriously damaged resulted from the lack of proper design for the use of ground water. For example, the useful land has decreased in the region of Wu-Fang area in Xin-Yuan village due to the overdrawing of groundwater resulted in a sink of land. The border of coast in Ping Tung County also reduces about 2.9 m and causes the problem of the salinization of well water. We only analyzed the MPB (material production of biomass), including crop (C), forestry (F), fishery (Fi) and livestock (L) materials, in the Gaobing River basin between 1987 ~ 2001. The items of crops consist of rice, common crop, special crops, vegetable, fruits, flowers, forage and green manure crops. As for the forestry, the items include beef, pork, lamb, domestic fowls, eggs, hairy antlers, cow’s milk, honey and royal jelly. The fishery materials contain pelagic, inshore and coastal fishing, sea farming and inland breed. Finally, the items of livestock take into account for wood, bamboo and forest by-products. The productions of pigs (MPG) are about 93,067 tons in 1987 and increase evidently with time until 1996 with an increase of 118% based on the estimation of 112 kg per pig [17] as shown in Fig. 7. Afterwards, the value. Fig. 8. Time variations of MPB (○) and MPB/PT (△) in Gaobing River basin. MPB: material production of biomass. PT: as specified in Fig. 1.. number of pigs according to the law. As a result, it can be found that the weight ratio of production of pigs to livestock (MPG/ ML) is greater than 50% before 1996 while decreases below 50% from 1997 as depicted in Fig. 7. The results demonstrate the good performance of TAIEPA in executing its policies. The variations of MPB and MPB per person of total population (MPB/PT) in the Gaobing River basin are shown in Fig. 8. The MPB decreases from 1987 of 1,041,375 tons until 1992 with the reduction of 10%. It then begins to increase gradually during 1993 to 1995. However, the significant decrease of MPB in 1997 is caused by the eruption of foot and mouth disease. This phenomenon indicates that the production of MPB in the Gaobing River basin has tended to increase recently. It shows that the variation trends of MPB may be due to the variation of industrial structure in the Gaobing River basin. Further examination of the effects of variation of industrial structure on the domestic wastewater generation in the Gaobing River basin would be helpful in future study. The variation of MPB/PT is similar to that of MPB with maximum and minimum values of 1520 and 1066 kg/person in 1995 and 1992, respectively. Further, the average value of MPB/PT in the Gaobing.
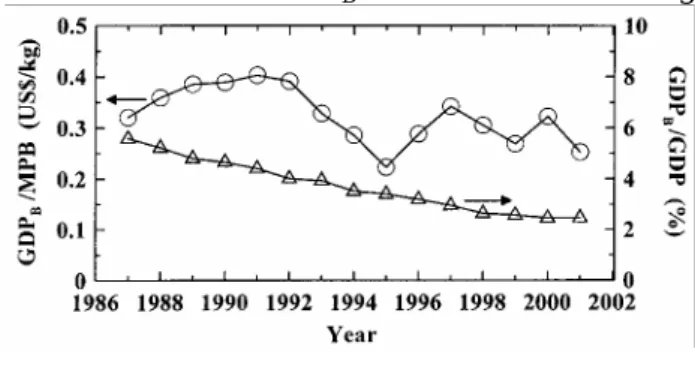
(5) Chungfang Ho Chang et al. : Estimation and Trend Analysis of Biomass Production in River Basin in Taiwan: 2. Case in Gaobing River Basin. River basin is 1,275 kg/person representing a high production requirement as compared to that (57 kg/person) in Tamsui River basin. The values of biomass industrial gross domestic product (GDPB) per MPB and the ratio of GDPB to GDP in the Gaobing. Fig. 9. Time variations of GDPB/MPB ( ○ ) and GDPB/GDP (△) in Gaobing River basin. GDP: gross domestic product. GDPB: biomass industrial GDP. MPB: as specified in Fig. 8.. River basin can be calculated based on the exchange rate of 1US$ = 27.46 NT$ in 1996 as illustrated in Fig. 9. Note that the value of MPB/GDP reflects the requirement of biomass production per dollar. Reversely, the value of GDP/MPB displays the economical efficiency of material production. The GDPB/MPB increases gradually from 0.32 US$/kg in 1987 to a maximum value of 0.40 US$/kg in 1991. The efficiency then decreases obviously to reach a minimum value of 0.22 US$/kg in 1995, and varies within 0.25-0.34 US$/kg during 1996-2001. Furthermore, the contribution of the biomass industry for the GDP in the Gaobing River basin decreases evidently with time according to the decreasing trend of GDPB/GDP. The value of GDPB/GDP is 5.6% in 1987 and decreases continuously to 2.5% in 2001. Note that the GDPB/GDP value becomes stable of about 2.5% in recent years.. CONCLUSIONS The time variations of biomass production of crop, forestry, fishery and livestock in the Gaobing River basin provide useful information to assess the situation of the biomass industry. From the analysis of this study, the agricultural employees, the ratio of planted to cultivated land areas and the ratio of biomass to total gross domestic products are found to decrease remarkably with time. The results reveal that the importance of biomass industry in the Gaobing River basin gradually decreases due to the changes of the industrial and economic structures. On the other hand, the time variation of the cultivated land area is stable. Also, the aquaculture fishery apparently becomes a major contribution in the recent fishery industry. Moreover, the production of pigs and the. 13. ratio of productions of pigs to livestock significantly decrease due to the eruption of mouth and foot disease and the implement of the policies promoted by the government. Therefore, in order to improve development, the government should consider how to utilize the agriculture area and set the adequate directions of agriculture development utilizing the existing biomass resources. Otherwise, the environment would be degraded gradually due to the improper use of the biomass resources such as overdrawing the underground water. Consequently, the transformation of agriculture development in the Gaobing River basin is important and necessary because of less agricultural employees and low biomass industrial gross domestic product, while of the serious environmental problems.. ACKNOWLEDGEMENT This study was supported by the National Science Council of Taiwan under Grant No. NSC 912621-Z-002-028.. NOMENCULTURE Notation Referred to Gaobing River Basin. A AC AF AFi AH AP B. Agriculture cultivated land area reforestation land area aquaculture land area harvested land area planted land area biomass including crop, forestry, fishery and livestock C crop EB agricultural employees EFi fishery employmee F forestry Fi fishery FiA aquaculture fishery production total fishery production FiT GDP gross domestic product GDPB biomass industrial GDP HFa farm household HFi fisherman household HT total households L livestock ML weight of livestock production MPB material production of biomass MPG weight of pigs production MR regional rice production farm population PFa PT total population PG pig population TF reforestation trees.
(6) 14. Journal of the Chinese Institute of Environmental Engineering, Vol. 14, No. 1 (2004). Notation Referred to Other Regions. MRTWN whole rice production in Taiwan ratio of known amount of material i of the Ri specific towns of the county in Gaobing River basin to that of the whole county in Gaobing River basin Other Notations. CNS Chinese National Standard (Taiwan) TAIEPA Taiwan Environmental Protection Administration. REFERENCE 1. Erkman, S., “Industrial Ecology: an Historical View,” J. Cleaner Production, 5(1-2), 1-10 (1997). 2. Lin, S. S., “Preliminary Study on Material Flow System and Its Establishment in Taiwan,” Master Thesis, Department of International Trade, Chung Yuan Christian University, Chung-Li, Tao-Yuan, Taiwan (2001). 3. Chang, Chung-Fang H. and S. S. Lin, “Material Requirements of Metals in Taiwan,” J. Chinese Inst. Environ. Eng. (Taiwan), 12(2), 93-102 (2002). 4. Ibid., “Material Requirements of Agricultural, Forest and Animal Biomass Industries in Taiwan,” Ibid., 12(4), 315-324 (2002). 5. Ibid., “Material Flow Analysis of Industrial NonMetal Minerals in Taiwan,” Ibid., 13(3), 183-190 (2003). 6. Hsiao, T. Y., Y. H. Yu and I. K. Wernick, “A Note on Material Flows of Construction Aggregates in Taiwan,” Resources Policy, 27, 135-137 (2001). 7. Ibid., “Analyzing Material Flows for Construction Aggregates in Taiwan,” J. Chinese Inst. Environ. Eng. (Taiwan), 12(2), 103-112 (2002). 8. Hsiao, T. Y., “A Study on Industrial Ecology – Analyzing and Modeling Materials Flows for Construction Aggregates in Taiwan,” PhD Dissertation, Graduate Institute of Environmental Engineering, National Taiwan University, Taipei, Taiwan (2003). 9. Richards, D. J. and R. A. Frosc, “Overview and Perspectives,” in The Industrial Green Game, ed. D.J. Richards, Washington, D.C., National Academy Press (1997).. 10. Graedel, T. E. and B. R. Allenby, Industrial Ecology, Prentice Hall Publisher, Englewood, NJ (1995). 11. Hsiao, T. Y., Y. T. Huang, Y. H. Yu, and I. K. Wernick, “Modeling Material Flow of Waste Concrete from Construction and Demolition Waste in Taiwan,” Resources Policy, 28, 39-47 (2002). 12. WRI (World Resource Institute) (Washington, DC, U.S.A.), WI (Wuppertal Institute) (Wuppertal, Federal Republic of Germany), NMOH (Netherlands Ministry of Housing, Spatial Planning and Environment) (The Hague, Netherlands), and NIES (National Institute for Environmental Studies) (Tsukuba, Japan), Resource Flows: the Material Basis of Industrial Economies, WRI, Washington, DC, April (1997). 13. Ausubel, J. H., “Resource and Environment in the 21st Century: Seeing Past the Phantoms,” World Energy Council Journal, 8-16, July (1998). 14. Statistics Agency of Kaohsiung City, Statistical Abstract (1987 ~ 2001). 15. Statistics Agency of Kaohsiung County, Statistical Abstract (1987 ~ 2001). 16. Statistics Agency of Pingtung County, Statistical Abstract (1987 ~ 2001). 17. COAT (Council of Agriculture, Taiwan) Agriculture Statistics Yearbook (1987 ~ 2001). 18. Wernick, I. and J. H. Ausubel, “National Material Flows and the Environment,” Annual Review Energy Environment, 20, 463-492 (1995). 19. COAT, Statistical Data of Agriculture, http://www. coa.gov.tw/statistic/index.html (2003). 20. Kaohsiung City Government, http://www.kcg. gov.tw/ (2003). 21. Kaohsiung County Government, http://www.kscg. gov.tw/ (2003). 22. Pingtung County Government, http://www.pthg. gov.tw (2003).. Discussions of this paper may appear in the discussion section of a future issue. All discussions should be submitted to the Editor-in-chief within six months. Manuscript Received: Octorber 2, 2003.
(7) Chungfang Ho Chang et al. : Estimation and Trend Analysis of Biomass Production in River Basin in Taiwan: 2. Case in Gaobing River Basin. 台灣河流流域生產之生物資源物質計算與趨勢分析 ─案例 2: 高屏溪流域 何瓊芳 1,*. 盧曉鈴 2 1. 2. 張慶源 2. 馬鴻文 2. 陳奕宏 2. 中原大學國際貿易學系. 國立台灣大學環境工程學研究所. 關鍵詞:物質流、南台灣、高屏溪流域、生物資源、農業產量. 摘. 要. 本研究探討南台灣高屏溪流域生物資源(包含農林漁牧物質)產量的變化,以整理及建立該流域有用的物 質資料及指標,並可以作為未來評估發展改進的參考。根據本研究所分析 1987 到 2001 年的相關數據,可得 到生物物質產量(MPB)的變化。從長期趨勢來看,高屏溪流域之稻作面積近年來日漸減少,顯示該流域漸漸 不進行稻作生產。故高屏溪流的稻米產量(MR),對整個台灣地區的稻作產量(MRTWN)的貢獻度也逐漸減小。 MR/MRTWN 的比值從 1987 年的 2.52%減少到 2001 年的 1.51%及其平均值為 1.78%。此外,高屏溪流域的 MPB 值在 1996 年以前通常都是增加的,但是在後續的兩年(1997 和 1998)因為口蹄疫的爆發而明顯減少。整 體而言,MPB 值從 1989 年的 854,973 公噸上升到 2001 年的 1,243,260 公噸,其平均值為 1,053,115 公噸。同 時相關的農業人口與總人口數之比值(PFa/PT)及耕地面積(AC)的變化也在本研究中加以探討。PFa/PT 與 AC 的 數值分別介於 24.5-33.0%和 10,880-26,724 ha,以及其平均值分別為 28%和 15,580 ha。另外對於單位生物物 質所產生的生物物質相關的生產毛額(GDPB/MPB),及 GPDB 相對於高屏溪流域的總生產毛額(GDP)之比例亦 進行分析和研究 (GDP 計算值之基期年為 1996 年)。GDPB/MPB 之平均值為 0.32 US$/kg,其最大值為 0.40 US$/kg 及最小值為 0.22 US$/kg。此低 GDPB/MPB 值反映高屏溪流域其生物物質之低經濟效率。此外, GDPB/ GDP 亦逐漸從 1987 年的 5.6%降低至 2001 的 2.5%。顯示高屏溪流域之生物物質產業對總產業之貢獻 逐年下降。. 15.
(8)
數據
相關文件
Total land area of Macao measures 30.8 km², comprising the Macao Penin- sula and the islands of Taipa and Coloane. Macao Peninsula is linked to Taipa Island by three
A17 China-born land-based population by gender, age group and total duration of living in Macao A18 Median and average monthly employment earnings of households by statistical
Completed units and gross fl oor area Purchase and sales of building units Value of units purchased and sold Average price per m². End-balance of
A high speed, large area, silicon photovoltaic detector housed in a 26.2mm diameter case. Its large active area, 1cm 2 , and peak spectral response at 900nm make the device suitable
Mean saving of 13% of total Lighting Cost for Corridors or Cost Saving of $42,500/ Month Average Vertical Daylight Factor for Living Room - Block 4. Daylight Energy Saving
Reclamation Rock Cavern Development Reuse of Ex-quarry Sites Redevelopment.. Rezoning Land
Development plan: Promote production cooperation, support cross-border cooperation between Guangdong and Macao financial institutions, support Macao banking institutions to
Through the classification and analysis of Zhu’s short treatise, this study seeks to understand the direction of his Pure Land teaching and theory, especially Pure Land,
