Arsenic exposure, hyperuricemia, and gout in US adults
Chin-Chi Kuo, M.D., Ph.D.1-4; Virginia Weaver, M.D., M.P.H.2,3,5; Jeffrey J. Fadrowski, M.D., M.H.S. 3,5,6; Yu-Sheng Lin, Sc.D. 7, §; Eliseo Guallar, M.D., Dr.P.H.1,3,5; Ana Navas-Acien M.D., Ph.D.1-3
1Department of Epidemiology, Johns Hopkins Bloomberg School of Public Health, Baltimore, Maryland, USA
2Department of Environmental Health Sciences, Johns Hopkins Bloomberg School of Public Health, Baltimore, Maryland, USA
3Welch Center for Prevention, Epidemiology and Clinical Research, Johns Hopkins Medical Institutions, Baltimore, Maryland, USA
4Kidney Institute and Division of Nephrology, Department of Internal Medicine, China Medical University Hospital and College of Medicine, China Medical University, Taichung, Taiwan
5Department of Medicine, Johns Hopkins University School of Medicine, Baltimore, Maryland, USA 6Division of Pediatric Nephrology, Department of Pediatrics, Johns Hopkins University School of Medicine, Baltimore, MD, USA
7Department of Environmental and Occupational Health, University of North Texas Health Science Center, Fort Worth, TX, USA
§Current address: National Center for Environmental Assessment, Office of Research and Development, U.S. Environmental Protection Agency, Washington, D.C
Short Title: Arsenic exposure and hyperuricemia
Index Words: Uric acid, hyperuricemia, arsenic, lead, gout
Potential conflicts of interest: All authors report no conflicts of interest.
Financial disclosure for all authors: No specific funding was received for this study.
Abstract
BackgroundThere is very limited information on the association between arsenic and serum uric acid levels or gout. The aim of this study was to investigate the association of arsenic with hyperuricemia and gout in US adults.
Methods
Cross-sectional study in 5632 adults aged 20 years or older from the National Health and Nutrition Examination Survey (NHANES) 2003-2010 with determinations of serum uric acid and urine total arsenic and dimethylarsinate (DMA). Hyperuricemia was defined as serum uric acid higher than 7.0 mg/dL for men and 6.0 mg/dL for women. Gout was defined based on self-reported physician diagnosis and medication use.
Results
After adjustment for sociodemographic factors, comorbidities and arsenobetaine levels, the increase in the geometric means of serum uric acid associated with one interquartile range increase in total arsenic and DMA levels were 3% (95% CI 2-5) and 3% (2-5),
respectively, in men and 1% (0-3) and 2% (0-4), respectively, in women. In men, the adjusted odds ratio for hyperuricemia comparing the highest to lowest quartiles of total arsenic was 1.84 (95% CI, 1.26-2.68) and for DMA it was 1.41 (95% CI, 1.01-1.96). The corresponding odds ratios in women were 1.26 (0.77, 2.07) and 1.49 (0.96, 2.31), respectively. The odds
ratio for gout comparing the highest to lowest tertiles was 5.46 (95% CI, 1.70-17.6) for total arsenic and 1.98 (0.64-6.15) for DMA among women older than 40 years old. Urine arsenic was not associated with gout in men.
Conclusion
Low level arsenic exposures may be associated with the risk of hyperuricemia in men and with the prevalence of gout in women. Prospective research focusing on establishing the direction of the relationship among arsenic, hyperuricemia, and gout is needed.
Introduction
Hyperuricemia and gout have been linked to cardiovascular disease, diabetes, and chronic kidney disease and its progression.1-3 While hyperuricemia is often related to excess
adiposity and the metabolic syndrome, environmental factors can also induce
hyperuricemia.4 Among metals, elevated lead exposure is a well-defined risk factor for
hyperuricemia and gout.5 Arsenic, a worldwide environmental pollutant, is an established
risk factor for the development of cancer and cardiovascular disease, and possibly for the development of diabetes and chronic kidney disease.6-8 Arsenic exposure could result in
hyperuricemia secondary to kidney injury9, but animal studies have shown mixed results,
including no association10, and associations with low and high uric acid levels.9, 11 Indeed,
arsenic may inhibit xanthine oxidase and thus lead to a reduction in uric acid level.12
Evidence in humans is very limited. Two small human studies in areas with high arsenic concentrations in drinking water (mean > 50 µg/L) in Mexico and India reported that high exposure to inorganic arsenic was associated with hypouricemia.12, 13 No studies, however,
have examined the role of low-moderate arsenic exposure on serum uric acid levels and the risk of gout. Humans are exposed to different forms of arsenic, including inorganic (arsenite, arsenate) and organic (arsenobetaine, arsenosugars and arsenolipids) compounds.14 Organic
arsenic compounds are present mainly in seafood and are considered non-toxic. In general populations, the major sources of inorganic arsenic exposure are drinking water and food (especially rice and other grains).15 In the US, several million people are exposed to arsenic
levels in drinking water above 10 µg/L, the US Environmental Protection Agency (EPA) standard for arsenic in drinking water systems.16 In this study, we analyzed a representative
sample of US adults who participated in the 2003-2010 National Health and Nutritional Examination Survey (NHANES) to advance our understanding of the association of inorganic arsenic exposure with serum uric acid levels and gout.
Methods
Study populationNHANES 2003-2010, conducted by the US National Center for Health Statistics, used a stratified multistage sampling design to obtain a nationally representative sample of the civilian non-institutionalized population of the United States. A total of 27,152 adults of 20 years of age and older completed the NHANES 2003-2010 in-home interview and the
medical evaluation at the mobile examination center. The mean participation rate was 76.5% and 76.4% for NHANES cycle 2003-2010 and 2007-2010, respectively. For urine arsenic analyses, NHANES 2003-2010 selected a one-third random sample of study participants aged 6 years and older. Among 6932 participants who had total urine arsenic measured, we excluded 54 participants who were missing urine arsenobetaine or dimethylarsinate (DMA), 265 participants missing blood lead, 523 participants missing alcohol status and 452
mg/dL, as very low uric acid is often related to genetic or acquired disorders17. The final
sample size for analyses based on serum uric acid levels was 5632 participants. For analyses of the association between arsenic levels and the prevalence of gout, we restricted the sample to 3171 participants with information available on self-reported gout history in NHANES 2007-2010. Gout was rare before 40 years of age (only 2 women and 13 men). For this reason, and consistent with previous epidemiologic studies of gout, we further
restricted the sample to participants aged 40 and older (n=2133).5 These NHANES cycles
were approved by the institutional review board of the National Center for Health Statistics. Oral and written informed consent was obtained from all participants.
Measurement of urine arsenic
Spot urine samples for metal analysis were obtained at the time of the physical examination in metal-free containers, shipped on dry ice, stored frozen at -70°C or lower, and analyzed within 3 weeks of sampling.18, 19 Total arsenic and arsenic species were
measured at the Environmental Health Sciences Laboratory of the National Center for Environmental Health following a standardized protocol.19 Total urine arsenic was analyzed
using inductively coupled-plasma dynamic reaction cell-mass spectrometry (ICP-DRC-MS) on a ELAN® 6100 DRC Plus or ELAN® DRC II (PerkinElmer Instruments, Headquarters Office, 710
Bridgeport Ave., Shelton, CT 06484-4794).18 The LOD for total arsenic was 0.6 g/L in
arsenic levels below the LOD and values were imputed as the LOD divided by the square root of 2. For external calibration verification, NHANES used the National Institute of Standards and Technology standard reference material 2670 (NIST SRM 2670).19 For total urine arsenic,
interassay coefficients of variation of quality control–pooled samples analyzed throughout 2003-2010 ranged between 2.9% and 10.5%.
Urine arsenic species (arsenite, arsenate, methylarsonate, dimethylarsinate (DMA), and arsenobetaine) were measured using high performance liquid chromatography (HPLC) to separate the species coupled to ICP-DRC-MS. The LOD for arsenite (1.2 g/L), arsenate (1.0 g/L), and monomethylarsonate (0.9 g/L) resulted in 96.9 %, 96.4%, and 65.0% of the arsenite, arsenate, and monomethylarsonate levels, respectively < the LOD. Therefore, these three metabolites were not used in this analysis. The LODs for urine DMA and arsenobetaine were 1.7 and 0.4 g/L, respectively. The percent of study participants with levels below the LOD was 15.5% for DMA and 29.7% for arsenobetaine. Undetected DMA and arsenobetaine values were imputed as the LOD divided by the square root of 2. The interassay coefficients of variation for quality control-pooled samples ranged between 2.4% and 6.6% for DMA; and between 3.9% and 17.8% for arsenobetaine.
Urine creatinine, used to account for urine dilution in spot urine samples, was measured by the modified kinetic Jaffé method in 2003–2006 and by an enzymatic (creatinase) method in 2007–2010.20 To improve the comparison of urine creatinine data
between different instrumentations, we performed a piecewise square root transformed adjustment for urine creatinine concentrations before 2007 following the analytic
recommendations of NHANES.20
Serum uric acid and gout
From 2003 to 2010, frozen serum samples were sent to the Collaborative Laboratory Services at Ottumwa, Iowa, for uric acid analyses.21 In 2003-2007, serum uric acid was
measured using a Beckman Synchron LX20 while in 2008-2010, a Beckman Coulter UniCel DxC800 Synchron was used. Both systems used a timed endpoint colorimetric method.22 No
difference was noted between the two instruments in the mean value or the reference ranges. For participants aged ≥18 years, the reference range was 3.6-8.4 mg/dL for men and 2.9-7.5 mg/dL for women.21 The inter-assay coefficients of variation for serum uric acid
ranged between 0.6% and 2.7% for NHANES 2003-2010.
We defined gout as self-reported physician diagnosis or medication use.23, 24
Self-reported medical history of gout was obtained using the question “has a doctor or other health professional ever told you that you had gout?” Medication use for gout was obtained by self-reported use of allopurinol, colchicine, probenecid, or sulfinpyrazone during the medical history.
Other variables
race/ethnicity, sex, education, cigarette smoking, and alcohol consumption. Smoking was categorized as current, former, or never. Alcohol consumption was categorized as never (< 12 drinks in any 1 year in life), former (≥ 12 drinks in any 1 year in life and not drinking now), and current (≥12 drinks in any 1 year in life and drinking now).
Body mass index was calculated as weight in kilograms divided by height in meters squared. Diabetes mellitus was defined as a self-reported physician diagnosis, medication use or glucose levels higher or equal than 126 mg/dL (fasting 8 hours or more) or 200 mg/dL (fasting less than 8 hours). Hypertension was defined as a self-reported physician diagnosis, use of antihypertensive medication or systolic blood pressure > 140 mmHg or diastolic blood pressure > 90 mmHg. Serum C-reactive protein was analyzed by latex-enhanced
nephelometry. Serum total cholesterol was measured enzymatically using reagents and analyzers by Roche Diagnostics. Serum cotinine was measured by an isotope-dilution high-performance liquid chromatography/atmospheric pressure chemical ionization tandem mass spectrometric method. Urine albumin was determined using fluorescein immunoassay by Sequoia-Turner digital fluorometer (model 450). Serum creatinine was measured at Collaborative Laboratory Services at Ottumwa, Iowa, using a Beckman Synchron LX20 in 2003-2007 and a Beckman Coulter UniCel DxC800 Synchron in 2008-2010. Both instruments use the Jaffe rate method (kinetic alkaline picrate) to determine creatinine concentrations. Kidney function was assessed by estimated glomerular filtration rate (eGFR)
using the CKD-EPI equation.
Whole blood lead was measured using a multi-element analytical technique based on quadrupole ICP-DRC-MS technology (ELAN series DRC, PerkinElmer Instruments, Shelton, CT)25. The LOD for blood lead was 0.25 g/dL. A total of 8 participants were below the LOD
and those values were imputed as the LOD divided by the squared root of two.26, 27
Daily total protein, sugar, and vitamin C intake, and recent shellfish and fish exposure were assessed based on a food frequency questionnaire during the first 24-hour dietary recall interview.
Statistical analysis
Analyses were performed separately for men and women due to major differences in serum uric acid concentrations by sex. Statistical analyses were performed using the sample survey commands in STATA version 12.0 statistical software (StataCorp LP, College Station, Texas) to account for the complex sampling design and to incorporate appropriate weights, primary sampling units, and strata in NHANES 2003-2010 and obtain unbiased point
estimates and robust linearized standard errors. We calculated new 8-year sample weights for NHANES 2003–2010 by dividing each of the 2-year appropriate subsample weights by 4 as recommended by the National Center for Health Statistics. For gout analyses, we
calculated another 4-year sample weights for NHANES 2007-2010 by dividing each 2-year appropriate subsample weights by 2. The 2-sided statistical significance level was set
atα=0.05.
To assess inorganic arsenic exposure we used total urine arsenic and urine DMA concentrations and removed the contribution of seafood arsenicals adjusting for arsenobetaine, a biomarker of seafood intake and considered non-toxic14. As seafood
exposure may associate with the development of hyperuricemia and gout, adjusting for arsenobetaine, an objective proxy of seafood exposure, was important to control this
potential confounder. We used linear regression models to examine the association between urine arsenic (total arsenic and DMA) and serum uric acid concentrations. Serum uric acid concentrations were right skewed and were log-transformed to improve normality. We also used logistic regression to estimate the odds ratio of hyperuricemia and gout. Hyperuricemia was defined as serum uric acid level higher than 7.0 mg/dL for men and higher than 6.0 mg/dL for women, similar to criteria used in previous studies.28, 29 Both in linear regression
and logistic regression models, we entered urine total arsenic and DMA as quartiles (tertiles for gout analysis due to low number of events) and as continuous log-transformed variables, in separate models. We conducted several sensitivity analyses. First, we reported
associations for study outcomes comparing urine total arsenic levels above and below 10 µg/g creatinine as the current US-EPA standard for arsenic in drinking water system is 10 g/L. This approach can also help inform risk assessment of arsenic at a policy level. Second, we repeated the analyses further adjusting for daily total protein, sugar, and vitamin C intake
and recent shellfish and fish exposure, with consistent findings (Supplementary table 5). Third, we repeated the analyses without adjusting for dietary factors in NHANES cycle 2003-2012, showing similar results (Supplementary table 6). Fourth, we additionally adjusted for NHANES cycles to control for time trends in hyperuricemia, prevalence of gout, and arsenic metabolites at the population level, yielding consistent results (data not shown).
Linear and logistic regression models were initially adjusted for sociodemographic and lifestyle variables including age (restricted cubic splines to improve data fitting), education (less than high school/high school/higher than high school), race/ethnicity (Non-Hispanic white/Non-Hispanic black /Mexican-American/Others ), smoking status defined by serum cotinine level, alcohol consumption (never/former/current) and BMI (restricted cubic splines to improve data fitting) followed by adjustments for comorbidities including diabetes
mellitus, hypertension, C-reactive protein, estimated glomerular filtration rate, blood lead and cadmium levels, and medications including diuretics, beta-blockers and anti-gout agents . All models were adjusted for urine creatinine to account for urine dilution.30
Because total arsenic and DMA concentrations were strongly correlated with arsenobetaine (Spearman correlation coefficients 0.82 and 0.48, respectively, after dividing by creatinine to remove correlation due to urine dilution), we ran additional analyses for total arsenic and DMA without adjustment for arsenobetaine concentrations but restricted to participants with very low arsenobetaine (<1 µg/L), to ensure that total arsenic and DMA reflected
exposure to inorganic arsenic and not exposure to organic arsenicals in seafood. This approach avoided multicollinearity and restricted the study population to those in whom total urine arsenic most likely represents inorganic arsenic exposure.
Exploratory subgroup analyses, separately for men and women, were conducted by including the product of log-transformed arsenic levels with the following covariates: age, race/ethnicity, smoking status (never/former/current), hypertension, diabetes mellitus, BMI, estimated glomerular filtration rate, blood lead levels and blood cadmium levels. Fully-adjusted regression models were checked for multicolinearity using variance inflation factor (VIF) as markers of arsenic exposure (total arsenic and DMA) and arsenobetaine were highly correlated. The maximum VIF of any of our explanatory variables when markers of arsenic exposure (total arsenic and DMA) were simultaneously in the model was 1.67, indicating that multicolinearity was not a serious problem in our models.31
Results
Median serum uric acid was 6.0 mg/dL in men and 4.7 mg/dL in women. Median total urine arsenic and urine DMA concentrations were 7.5 and 3.3 μ g/g creatinine,
respectively, in men and 8.7 and 4.1 μ g/g, respectively, in women. Both in men and women, total arsenic and DMA were higher in participants from other races/ethnicities, in former smokers, and in former alcohol drinkers and lowest in participants with high school
education (Table 1).Among participants with no recent seafood intake (arsenobetaine 1 µg/L), the percentage of participants having urine arsenic levels higher than 10 µg/g creatinine among men and women with hyperuricemia were 12.2% and 9.6%, respectively. The Spearman correlation coefficient between creatinine-corrected total arsenic and DMA was 0.73 (95% CI, 0.72-0.74). The Spearman correlation coefficient between total urine arsenic and blood lead levels was 0.09 (0.06-0.12) and between DMA and blood lead levels it was 0.09 (0.07-0.12).
Urine arsenic, serum uric acid and hyperuricemia
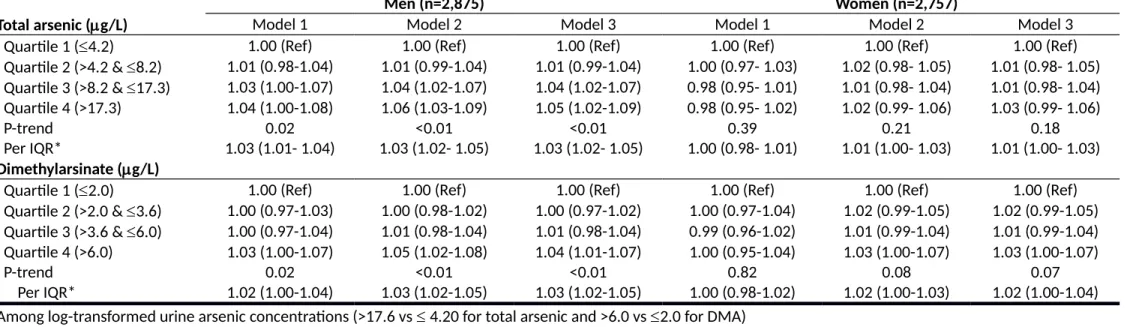
The increase in serum uric acid concentrations associated with an increase in one interquartile range of total arsenic and DMA concentrations were 3% (95% confidence interval [CI] 2, 5) and 3% (2, 5), respectively, in men and 1% (0, 3) and 2% (0, 4), respectively, in women (Table 2, model 3). P-values of interaction for serum uric acid concentrations by sex were 0.16 for total arsenic and 0.06 for DMA. In both sexes combined, the fully adjusted geometric mean ratios per interquartile range for total arsenic and DMA were 1.02 (1.01, 1.03) and 1.03 (1.01, 1.04), respectively (Supplementary table 1). In analyses restricted to participants with very low arsenobetaine concentrations ( 1 µg/L) (N=2569), the adjusted geometric mean ratios per interquartile range for total arsenic and DMA were 1.02 (1.00, 1.04) and 1.03 (1.01, 1.05), respectively, for men and 1.01 (0.98, 1.03) and 0.99 (0.96, 1.02), respectively, for women.
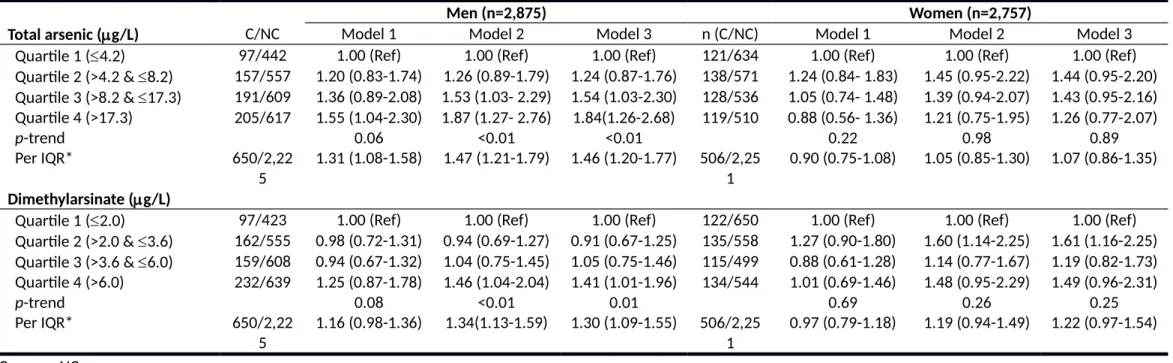
The results for hyperuricemia were very similar to those for uric acid levels in both men and women (Table 3; model 3 and Supplementary table 2). The adjusted odds ratios for hyperuricemia in men with very low arsenobetaine concentrations were 1.54 (1.05, 2.26) for an interquartile range in total arsenic and 1.66 (1.04, 2.67) for an interquartile range in DMA . In women with very low arsenobetaine concentrations, the corresponding odds ratios were 0.98 (0.63, 1.51) for total arsenic and 1.11 (0.70, 1.76) for DMA. Blood lead levels were significantly associated with serum uric acid after multivariable adjustment (the adjusted ratio of geometric means of serum uric acid was 3% (95% CI 1.02-1.04) higher per
interquartile range (IQR) of blood lead level. Adjustment for blood lead, however, did not change the association between arsenic and uric acid levels or hyperuricemia. Finally, the adjusted odds ratio for hyperuricemia comparing urine total arsenic above vs. below 10 µg/g creatinine was 1.60 (95% CI 1.16-2.19) among men, 1.06 (95% CI 0.79-1.42) among women, and 1.33 (95% CI 1.06-1.69) for men and women combined.
Urine arsenic concentrations and gout
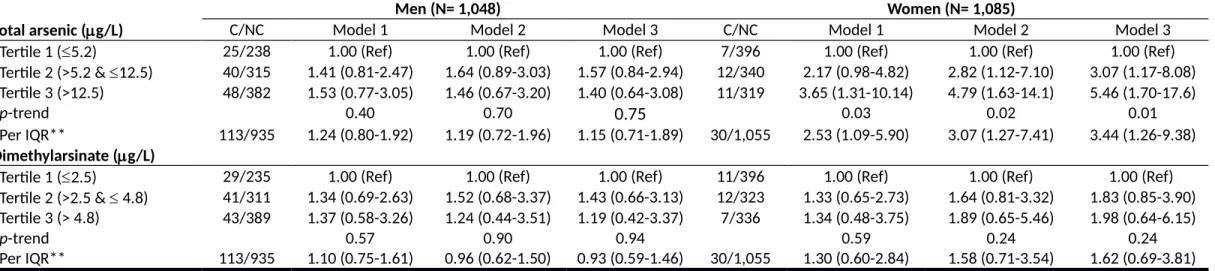
The weighted prevalence of gout in the population 40 years and older was 8.3% in men and 2.2% in women (with a weighted prevalence of anti-gout medication 2.4% in men and 0.4% in women). The adjusted odds ratio (95% CI) of gout comparing the interquartile range in total urine arsenic concentrations was 1.15 (0.71, 1.89) in men and 3.44 (1.26, 9.38) in women (Table 4, model 3). The corresponding odds ratios for DMA were 0.93 (0.59, 1.46) in
men and 1.62 (0.69, 3.81) in women. Further adjustment for estrogen use showed similar results (Supplementary table 3). P-values of interaction for gout by sex were 0.53 for total arsenic and 0.82 for DMA. In sex-pooled analysis, the adjusted odds ratios comparing the highest tertile to lowest tertile was 1.86 (0.99, 3.49) for total arsenic and 1.27 (0.61, 2.66) for DMA (Supplementary table 4). The adjusted odds ratio for gout comparing urine total arsenic above vs. below 10 µg/g creatinine was 1.50 (95% CI 0.94-2.40) among men and women combined.
Exploratory subgroup analyses
Among men, the association between arsenic and hyperuricemia was consistent for most subgroups evaluated except for stronger associations between DMA and
hyperuricemia among participants without diabetes and between total arsenic and
hyperuricemia among participants with BMI over 25 kg/m² (Figure 1). In women, the lack of association between urine arsenic and hyperuricemia was also consistent across subgroups, except among former smokers and hypertension (Figure 2).
Discussion
In this large cross-sectional study in NHANES 2003-2010, arsenic exposure, as measured in urine, was associated with higher serum uric acid levels and increased prevalence of hyperuricemia in men but not with self-reported gout. In women, urine arsenic was
associated with self-reported gout, but not with serum uric acid level and hyperuricemia. While our study indicates that arsenic may play a role in the development of hyperuricemia and gout, the study needs to be interpreted with caution due to possible sex-differences in hyperuricemia and gout, the cross-sectional design, and the small number of cases of self-reported gout in women.32, 33
Little is known about the association of arsenic exposure with uric acid and gout. In a small study conducted in Northern Mexico enrolling mostly women (85 women vs. 12 men), high arsenic exposure in drinking water (mean 130 g/L) was associated with hypouricemia and hypouricosuria.12 Another study from India also found that high arsenic levels in drinking
water (>100 g/L) were associated with hypouricemia in both men and women, and speculated that this could be related to the consumption of serum uric acid as an anti-oxidant against arsenic induced oxidative stress.13, 34, 35 Animal studies have found both hyper
and hypouricemia induced by arsenic, although arsenic exposure levels were relatively high.9, 11 The generalizability of these human and animal studies to populations exposed to
low-moderate inorganic arsenic levels in drinking water, such as the US, is unclear. In our study, indeed, the associations were in the opposite direction.
The sex differences in the association between arsenic on uric acid and gout are less conclusive. In our study, the association in men was clear with hyperuricemia but not with gout, although the p-value for interaction by sex was not significant. In women, we found
the opposite, a possible association with gout but not with hyperuricemia. However, among female participants with hyperuricemia (serum uric acid 6 mg/dL), the odds ratio of gout for an interquartile range increase in urine total arsenic was strengthened to 7.59 (95% CI 1.17-49.4). As the positive relationship between hyperuricemia and gout has long been established in men36, 37, large prospective evidence supporting the role of hyperuricemia in
gout among women has been available only recently.38 Female gout has different clinical
features relative to men including more inflammation in the upper limb joints, multiple joints involved, and less recurrence. The risk profile is also different. Female gout is related to diuretics use and comorbidities such as hypertension and impaired renal function38-40 and
less to genetic variants.41 The influence of sex on arsenic metabolism, as measured in urine,
has been recognized for many years.42 Men have lower relative proportions of DMA in urine
compared to women. Unfortunately we could not evaluate the association between arsenic metabolism and uric acid as inorganic arsenic and MMA, species that are essential to understand arsenic metabolism, had high LODs in NHANES. Future research is warranted to elucidate underlying mechanisms of sex differences in the epidemiological profile between arsenic, hyperuricemia and gout.
We also found that diabetes status modified the association between arsenic and hyperuricemia in men. In men, the association between arsenic and uric acid was observed mostly in those without diabetes. While some reports support the inverse relationship
between serum uric acid level and diabetes43, 44, this issue remains controversial as other
reports have opposite findings.2, 45 Overweight and obesity (BMI 25 kg/m²) and
hypertension also modified the association between arsenic and hyperuricemia in men and women, respectively. In the absence of a strong biologic hypothesis for the association between arsenic and uric acid, the subgroup analyses need to be interpreted with caution.
The cross-sectional design is a major limitation of this study. Exposure and outcome were measured at the same time and we cannot evaluate temporality of the association. The diagnosis of gout was based on self-report. However, the case definition used has been validated in previous epidemiological studies.46 The small number of cases of gout in women
was an additional limitation. In this study we were able to adjust for many factors that affect serum uric acid level. Our study, moreover, was conducted in a population with mostly normal kidney function and the findings persisted after adjustment for eGFR. Although dietary factors such as fructose, meat, coffee, vegetables and fiber intake37, 47, 48 have been
related to hyperuricemia/gout, the relevance of these factors remains under debate.49, 50
Regarding confounding by seafood, for total arsenic and DMA, we adjusted for arsenobetaine as an objective biomarker of seafood intake in order to evaluate the association for arsenic that is not derived from seafood. Finally, our sensitivity analyses among participants with very low arsenobetaine levels, adjusting for seafood and daily total protein, sugar, and vitamin C intake, and joint analyses with the latest NHANES cycle
2011-2012 all showed consistent results. Our findings may motivate experimental and mechanistic research to investigate the biological mechanisms linking environmentally relevant arsenic exposure levels to hyperuricemia.
Conclusion
Low-level arsenic exposure was associated with increasing serum uric acid level and the prevalence of hyperuricemia among a representative sample of US men and with serum uric acid and increased prevalence of gout in women. Experimental and mechanistic studies at relevant exposure levels and prospective studies in humans are needed to confirm the associations among environmental arsenic exposures, serum uric acid, and gout.
References:
1. Feig DI, Kang DH, Johnson RJ. Uric acid and cardiovascular risk. N Engl J Med. 2008;359:1811-1821
2. Dehghan A, van Hoek M, Sijbrands EJ, Hofman A, Witteman JC. High serum uric acid as a novel risk factor for type 2 diabetes. Diabetes Care. 2008;31:361-362
3. Nakagawa T, Kang DH, Feig D, Sanchez-Lozada LG, Srinivas TR, Sautin Y, Ejaz AA, Segal M, Johnson RJ. Unearthing uric acid: An ancient factor with recently found
significance in renal and cardiovascular disease. Kidney Int. 2006;69:1722-1725 4. Ryu S, Chang Y, Zhang Y, Kim SG, Cho J, Son HJ, Shin H, Guallar E. A cohort study of
hyperuricemia in middle-aged south korean men. Am J Epidemiol. 2012;175:133-143 5. Krishnan E, Lingala B, Bhalla V. Low-level lead exposure and the prevalence of gout:
An observational study. Ann Intern Med. 2012;157:233-241
6. Zheng LY, Umans JG, Tellez-Plaza M, Yeh F, Francesconi KA, Goessler W, Silbergeld EK, Guallar E, Howard BV, Weaver VM, Navas-Acien A. Urine arsenic and prevalent albuminuria: Evidence from a population-based study. Am J Kidney Dis. 2012;61:385-394
Pollak J, Silbergeld EK, Howard BV, Navas-Acien A. Association between exposure to low to moderate arsenic levels and incident cardiovascular disease: A prospective cohort study. Ann Intern Med. 2013
8. Navas-Acien A, Silbergeld EK, Pastor-Barriuso R, Guallar E. Arsenic exposure and prevalence of type 2 diabetes in us adults. JAMA. 2008;300:814-822
9. Saxena PN, Anand S, Saxena N, Bajaj P. Effect of arsenic trioxide on renal functions and its modulation by curcuma aromatica leaf extract in albino rat. J Environ Biol. 2009;30:527-531
10. Mahaffey KR, Fowler BA. Effects of concurrent administration of lead, cadmium, and arsenic in the rat. Environ Health Perspect. 1977;19:165-171
11. Jauge P, Del-Razo LM. Uric acid levels in plasma and urine in rats chronically exposed to inorganic as (iii) and as(v). Toxicol Let. 1985;26:31-35
12. Del-Razo LM, Garcia-Montalvo EA, Valenzuela OL. Arsenic exposure alters purine metabolism in rats, mice, and humans. In: Chappell WR, Abernathy CO, Calderon RL, Thomas DJ, eds. Arsenic exposure and health effects v. Amsterdan: Elsevier; 2003. 13. Maiti S, Chattopadhyay S, Deb B, Samanta T, Maji G, Pan B, Ghosh A, Ghosh D.
Antioxidant and metabolic impairment result in DNA damage in arsenic-exposed individuals with severe dermatological manifestations in eastern india. Environ
Toxicol. 2010
14. Navas-Acien A, Francesconi KA, Silbergeld EK, Guallar E. Seafood intake and urine concentrations of total arsenic, dimethylarsinate and arsenobetaine in the us population. Environ Res. 2011;111:110-118
15. Navas-Acien A, Nachman KE. Public health responses to arsenic in rice and other foods. JAMA internal medicine. 2013;173:1395-1396
16. Ayotte JD, Gronberg JM, Apodaca LE. Trace elements and radon in groundwater across the united states, 1992-2003. Scientific investigations report 2011-5059. . 2011
17. Maesaka JK, Fishbane S. Regulation of renal urate excretion: A critical review. Am J
Kidney Dis. 1998;32:917-933
18. Caldwell KL, Jones RL, Verdon CP, Jarrett JM, Caudill SP, Osterloh JD. Levels of urinary total and speciated arsenic in the us population: National health and nutrition examination survey 2003-2004. J Expo Sci Environ Epidemiol. 2009;19:59-68 19. Centers for Disease Control and Prevention (CDC). National center for health
statistics. Centers for Disease Control and Prevention Web site. Documentation,
Codebook, & Frequencies: Laboratory Component:Total and Speciated Arsenic NHANES 2003-2004, 2005-2006, 2007-2008, 2009-2010.
(alb_cr_e). 2009
21. Centers for Disease Control and Prevention (CDC). National health and nutrition examination survey (nhanes). Laboratory procedure manual. 2003-4, 2005-6, 2007-8, 2009-10.
22. Town M.H, Gehm S, Hammer B, J. Z. A sensitive colorimetric method for the enzymatic determination of uric acid. J Clin Chem Clin Biochem. 1985;1985:591 23. McAdams MA, Maynard JW, Baer AN, Kottgen A, Clipp S, Coresh J, Gelber AC.
Reliability and sensitivity of the self-report of physician-diagnosed gout in the campaign against cancer and heart disease and the atherosclerosis risk in the community cohorts. J Rheumatol. 2011;38:135-141
24. Choi HK, Atkinson K, Karlson EW, Willett W, Curhan G. Purine-rich foods, dairy and protein intake, and the risk of gout in men. N Engl J Med. 2004;350:1093-1103 25. NCHS. (national center for health statistics). National Health and Nutrition
Examination Surveys. 2012;2012
26. Hornung RW, Reed LD. Estimation of average concentrationin the presence of nondetectable values. Appl Occup Environ Hyg. 1990;5:46-51
27. Centers for Disease Control and Prevention (CDC). Us department of health and human services.Third national report on human exposure to environmental chemicals. Atlanta, ga: Centers for disease control and prevention. . 2005
28. Krishnan E, Baker JF, Furst DE, Schumacher HR. Gout and the risk of acute myocardial infarction. Arthritis Rheum. 2006;54:2688-2696
29. Iseki K, Ikemiya Y, Inoue T, Iseki C, Kinjo K, Takishita S. Significance of hyperuricemia as a risk factor for developing esrd in a screened cohort. Am J Kidney Dis.
2004;44:642-650
30. Barr DB, Wilder LC, Caudill SP, Gonzalez AJ, Needham LL, Pirkle JL. Urinary creatinine concentrations in the u.S. Population: Implications for urinary biologic monitoring measurements. Environ Health Perspect. 2005;113:192-200
31. Mukherjee C., White H., Wuyts M. Econometrics and data analysis for developing
countries. London: Routledge; 1998.
32. Weaver AL. Epidemiology of gout. Cleve Clin J Med. 2008;75 Suppl 5:S9-12 33. Doherty M. New insights into the epidemiology of gout. Rheumatology (Oxford).
2009;48 Suppl 2:ii2-ii8
34. Ames BN, Cathcart R, Schwiers E, Hochstein P. Uric acid provides an antioxidant defense in humans against oxidant- and radical-caused aging and cancer: A hypothesis. Proc Natl Acad Sci U S A. 1981;78:6858-6862
35. Lu JM, Lin PH, Yao Q, Chen C. Chemical and molecular mechanisms of antioxidants: Experimental approaches and model systems. J Cell Mol Med. 2010;14:840-860 36. Campion EW, Glynn RJ, DeLabry LO. Asymptomatic hyperuricemia. Risks and
consequences in the normative aging study. Am J Med. 1987;82:421-426 37. Choi HK, Mount DB, Reginato AM. Pathogenesis of gout. Ann Intern Med.
2005;143:499-516
38. Bhole V, de Vera M, Rahman MM, Krishnan E, Choi H. Epidemiology of gout in women: Fifty-two-year followup of a prospective cohort. Arthritis Rheum. 2010;62:1069-1076
39. De Souza A, Fernandes V, Ferrari AJ. Female gout: Clinical and laboratory features. J
Rheumatol. 2005;32:2186-2188
40. Harrold LR, Yood RA, Mikuls TR, Andrade SE, Davis J, Fuller J, Chan KA, Roblin D, Raebel MA, Von Worley A, Platt R, Saag KG. Sex differences in gout epidemiology: Evaluation and treatment. Ann Rheum Dis. 2006;65:1368-1372
41. Zhang L, Spencer KL, Voruganti VS, Jorgensen NW, Fornage M, Best LG, Brown-Gentry KD, Cole SA, Crawford DC, Deelman E, Franceschini N, Gaffo AL, Glenn KR, Heiss G, Jenny NS, Kottgen A, Li Q, Liu K, Matise TC, North KE, Umans JG, Kao WH. Association of functional polymorphism rs2231142 (q141k) in the abcg2 gene with serum uric acid and gout in 4 us populations: The page study. Am J Epidemiol. 2013
42. Kristiansen J, Christensen JM, Iversen BS, Sabbioni E. Toxic trace element reference levels in blood and urine: Influence of gender and lifestyle factors. Sci Total Environ. 1997;204:147-160
43. Bandaru P, Shankar A. Association between serum uric acid levels and diabetes mellitus. Int J Endocrinol. 2011;2011:604715
44. Nan H, Dong Y, Gao W, Tuomilehto J, Qiao Q. Diabetes associated with a low serum uric acid level in a general chinese population. Diabetes Res Clin Pract. 2007;76:68-74 45. Kramer CK, von Muhlen D, Jassal SK, Barrett-Connor E. Serum uric acid levels improve
prediction of incident type 2 diabetes in individuals with impaired fasting glucose: The rancho bernardo study. Diabetes Care. 2009;32:1272-1273
46. Gelber AC, Klag MJ, Mead LA, Thomas J, Thomas DJ, Pearson TA, Hochberg MC. Gout and risk for subsequent coronary heart disease. The meharry-hopkins study. Arch
Intern Med. 1997;157:1436-1440
47. Choi HK, Willett W, Curhan G. Coffee consumption and risk of incident gout in men: A prospective study. Arthritis Rheum. 2007;56:2049-2055
48. Choi HK, Willett W, Curhan G. Fructose-rich beverages and risk of gout in women.
JAMA. 2010;304:2270-2278
49. Sun SZ, Flickinger BD, Williamson-Hughes PS, Empie MW. Lack of association between dietary fructose and hyperuricemia risk in adults. Nutr Metab (Lond). 2010;7:16
CW, Jenkins DJ. The effects of fructose intake on serum uric acid vary among controlled dietary trials. J Nutr. 2012
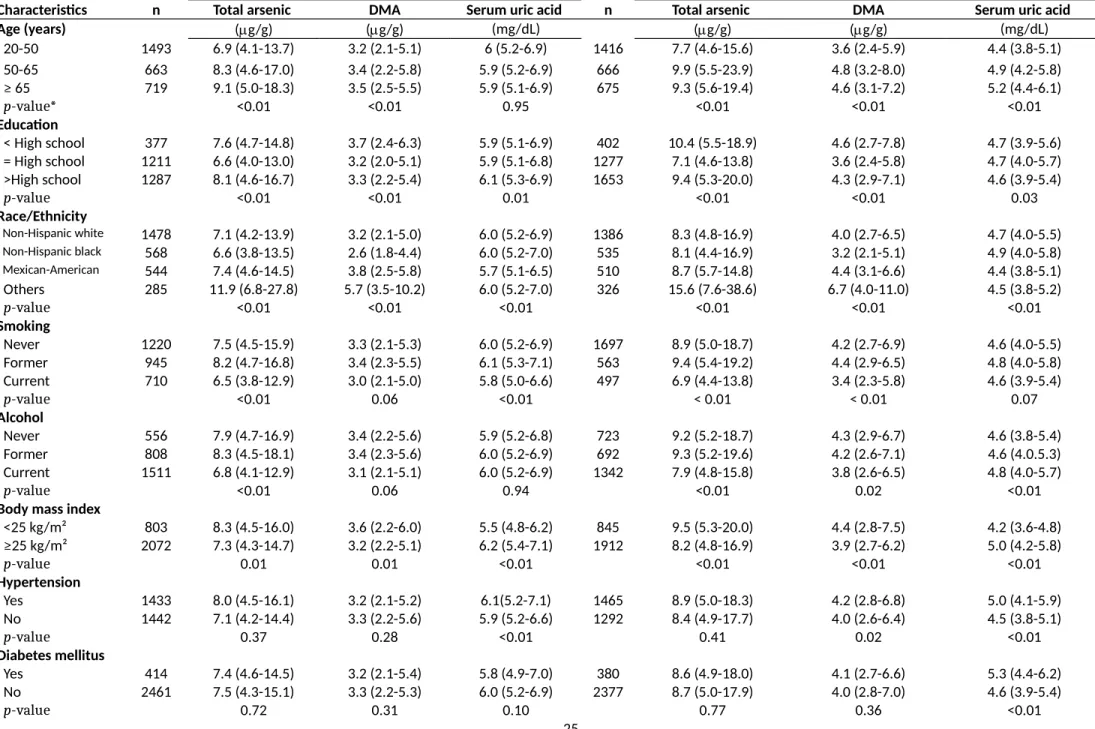
Table 1. Median (IQR) of creatinine-adjusted urine arsenic and serum uric acid concentration by participants’ characteristics.
Men (n=2,875) Women (n=2,757)
Characteristics n Total arsenic DMA Serum uric acid n Total arsenic DMA Serum uric acid
Age (years) (g/g) (g/g) (mg/dL) (g/g) (g/g) (mg/dL) 20-50 1493 6.9 (4.1-13.7) 3.2 (2.1-5.1) 6 (5.2-6.9) 1416 7.7 (4.6-15.6) 3.6 (2.4-5.9) 4.4 (3.8-5.1) 50-65 663 8.3 (4.6-17.0) 3.4 (2.2-5.8) 5.9 (5.2-6.9) 666 9.9 (5.5-23.9) 4.8 (3.2-8.0) 4.9 (4.2-5.8) ≥ 65 719 9.1 (5.0-18.3) 3.5 (2.5-5.5) 5.9 (5.1-6.9) 675 9.3 (5.6-19.4) 4.6 (3.1-7.2) 5.2 (4.4-6.1) p-value* <0.01 <0.01 0.95 <0.01 <0.01 <0.01 Education < High school 377 7.6 (4.7-14.8) 3.7 (2.4-6.3) 5.9 (5.1-6.9) 402 10.4 (5.5-18.9) 4.6 (2.7-7.8) 4.7 (3.9-5.6) = High school 1211 6.6 (4.0-13.0) 3.2 (2.0-5.1) 5.9 (5.1-6.8) 1277 7.1 (4.6-13.8) 3.6 (2.4-5.8) 4.7 (4.0-5.7) >High school 1287 8.1 (4.6-16.7) 3.3 (2.2-5.4) 6.1 (5.3-6.9) 1653 9.4 (5.3-20.0) 4.3 (2.9-7.1) 4.6 (3.9-5.4) p-value <0.01 <0.01 0.01 <0.01 <0.01 0.03 Race/Ethnicity Non-Hispanic white 1478 7.1 (4.2-13.9) 3.2 (2.1-5.0) 6.0 (5.2-6.9) 1386 8.3 (4.8-16.9) 4.0 (2.7-6.5) 4.7 (4.0-5.5) Non-Hispanic black 568 6.6 (3.8-13.5) 2.6 (1.8-4.4) 6.0 (5.2-7.0) 535 8.1 (4.4-16.9) 3.2 (2.1-5.1) 4.9 (4.0-5.8) Mexican-American 544 7.4 (4.6-14.5) 3.8 (2.5-5.8) 5.7 (5.1-6.5) 510 8.7 (5.7-14.8) 4.4 (3.1-6.6) 4.4 (3.8-5.1) Others 285 11.9 (6.8-27.8) 5.7 (3.5-10.2) 6.0 (5.2-7.0) 326 15.6 (7.6-38.6) 6.7 (4.0-11.0) 4.5 (3.8-5.2) p-value <0.01 <0.01 <0.01 <0.01 <0.01 <0.01 Smoking Never 1220 7.5 (4.5-15.9) 3.3 (2.1-5.3) 6.0 (5.2-6.9) 1697 8.9 (5.0-18.7) 4.2 (2.7-6.9) 4.6 (4.0-5.5) Former 945 8.2 (4.7-16.8) 3.4 (2.3-5.5) 6.1 (5.3-7.1) 563 9.4 (5.4-19.2) 4.4 (2.9-6.5) 4.8 (4.0-5.8) Current 710 6.5 (3.8-12.9) 3.0 (2.1-5.0) 5.8 (5.0-6.6) 497 6.9 (4.4-13.8) 3.4 (2.3-5.8) 4.6 (3.9-5.4) p-value <0.01 0.06 <0.01 < 0.01 < 0.01 0.07 Alcohol Never 556 7.9 (4.7-16.9) 3.4 (2.2-5.6) 5.9 (5.2-6.8) 723 9.2 (5.2-18.7) 4.3 (2.9-6.7) 4.6 (3.8-5.4) Former 808 8.3 (4.5-18.1) 3.4 (2.3-5.6) 6.0 (5.2-6.9) 692 9.3 (5.2-19.6) 4.2 (2.6-7.1) 4.6 (4.0.5.3) Current 1511 6.8 (4.1-12.9) 3.1 (2.1-5.1) 6.0 (5.2-6.9) 1342 7.9 (4.8-15.8) 3.8 (2.6-6.5) 4.8 (4.0-5.7) p-value <0.01 0.06 0.94 <0.01 0.02 <0.01
Body mass index
<25 kg/m² 803 8.3 (4.5-16.0) 3.6 (2.2-6.0) 5.5 (4.8-6.2) 845 9.5 (5.3-20.0) 4.4 (2.8-7.5) 4.2 (3.6-4.8) ≥25 kg/m² 2072 7.3 (4.3-14.7) 3.2 (2.2-5.1) 6.2 (5.4-7.1) 1912 8.2 (4.8-16.9) 3.9 (2.7-6.2) 5.0 (4.2-5.8) p-value 0.01 0.01 <0.01 <0.01 <0.01 <0.01 Hypertension Yes 1433 8.0 (4.5-16.1) 3.2 (2.1-5.2) 6.1(5.2-7.1) 1465 8.9 (5.0-18.3) 4.2 (2.8-6.8) 5.0 (4.1-5.9) No 1442 7.1 (4.2-14.4) 3.3 (2.2-5.6) 5.9 (5.2-6.6) 1292 8.4 (4.9-17.7) 4.0 (2.6-6.4) 4.5 (3.8-5.1) p-value 0.37 0.28 <0.01 0.41 0.02 <0.01 Diabetes mellitus Yes 414 7.4 (4.6-14.5) 3.2 (2.1-5.4) 5.8 (4.9-7.0) 380 8.6 (4.9-18.0) 4.1 (2.7-6.6) 5.3 (4.4-6.2) No 2461 7.5 (4.3-15.1) 3.3 (2.2-5.3) 6.0 (5.2-6.9) 2377 8.7 (5.0-17.9) 4.0 (2.8-7.0) 4.6 (3.9-5.4)
Estimated glomerular filtration rate (mL/min/1.73 m2) ≥ 60 2614 7.4 (4.3-15.0) 3.2 (2.1-5.3) 5.9 (5.2-6.8) 2457 8.7 (5.0-17.9) 4.1 (2.7-6.7) 4.6 (3.9-5.4) <60 261 8.8 (5.4-16.8) 3.7 (2.6-5.6) 6.7 (5.7-8.0) 300 7.8 (4.7-17.8) 3.7 (2.6-6.1) 5.8 (5.0-6.9) p-value 0.16 0.14 <0.01 0.30 0.02 <0.01 Albuminuria < 30 mg/g 2527 7.4 (4.3-15.0) 3.2 (2.1-5.3) 5.9 (5.2-6.8) 2451 8.7 (5.0-17.7) 4.0 (2.7-6.6) 4.7 (4.0-5.5) 30-300 mg/g 288 8.1 (4.7-17.0) 3.7 (2.4-5.7) 6.3 (5.4-7.2) 269 9.1 (5.0-19.4) 3.9 (2.8-8.4) 4.8 (4.0-6.0) >300 mg/g 60 9.4 (4.8-16.8) 4.3 (2.9-6.2) 6.6 (5.6-8.5) 37 9.4 (6.6-18.2) 5.8 (3.4-7.4) 5.5 (4.1-6.8) p-value 0.53 0.22 <0.01 0.42 0.10 0.05
Total cholesterol level
<=200 mg/dL 1655 7.6 (4.4-15.0) 3.2 (2.1-5.2) 5.8 (5.1-6.7) 1436 8.2 (4.7-16.5) 3.8 (2.6-6.3) 4.5 (3.8-5.3) >200 mg/dL 1220 7.4 (4.3-15.3) 3.3 (2.2-5.5) 6.2 (5.3-7.1) 1321 9.1 (5.3-18.9) 4.3 (2.9-6.8) 4.9 (4.1-5.7)
p-value 0.52 0.16 <0.01 0.03 <0.01 <0.01
Serum uric acid (mg/dL)§
Hypouricemia 44 5.7 (4.6-10.8) 2.7 (2.2-3.8) 3.3 (3.1-3.4) 67 6.9 (5.0-18.0) 3.7 (2.8-4.8) 2.6 (2.3-2.8) Normouricemia 2694 7.5 (4.3-15.0) 3.3 (2.2-5.3) 5.9 (5.2-6.8) 2589 8.7 (5.0-17.9) 4.1 (2.7-6.7) 4.7 (4-5.4) Hyperuricemia 137 8.3 (4.7-17.0) 3.8 (2.2-5.6) 8.9 (8.6-9.4) 101 7.8 (4.2-16.5) 3.4 (2.7-5.3) 8.1 (7.9-8.7)
p-value 0.25 0.35 <0.01 0.60 0.14 <0.01
*: p-value denoted the probability of observing the difference among each categorical variable containing two or more groups. The statistical significance was defined at P-value <0.05 .
Table 2. Ratio (95% confidence intervals) of geometric means of serum uric acid by urine arsenic concentrations
Men (n=2,875) Women (n=2,757)
Total arsenic (g/L) Model 1 Model 2 Model 3 Model 1 Model 2 Model 3
Quartile 1 (4.2) 1.00 (Ref) 1.00 (Ref) 1.00 (Ref) 1.00 (Ref) 1.00 (Ref) 1.00 (Ref)
Quartile 2 (>4.2 & 8.2) 1.01 (0.98-1.04) 1.01 (0.99-1.04) 1.01 (0.99-1.04) 1.00 (0.97- 1.03) 1.02 (0.98- 1.05) 1.01 (0.98- 1.05) Quartile 3 (>8.2 & 17.3) 1.03 (1.00-1.07) 1.04 (1.02-1.07) 1.04 (1.02-1.07) 0.98 (0.95- 1.01) 1.01 (0.98- 1.04) 1.01 (0.98- 1.04) Quartile 4 (>17.3) 1.04 (1.00-1.08) 1.06 (1.03-1.09) 1.05 (1.02-1.09) 0.98 (0.95- 1.02) 1.02 (0.99- 1.06) 1.03 (0.99- 1.06) P-trend 0.02 <0.01 <0.01 0.39 0.21 0.18 Per IQR* 1.03 (1.01- 1.04) 1.03 (1.02- 1.05) 1.03 (1.02- 1.05) 1.00 (0.98- 1.01) 1.01 (1.00- 1.03) 1.01 (1.00- 1.03) Dimethylarsinate (g/L)
Quartile 1 (2.0) 1.00 (Ref) 1.00 (Ref) 1.00 (Ref) 1.00 (Ref) 1.00 (Ref) 1.00 (Ref)
Quartile 2 (>2.0 & 3.6) 1.00 (0.97-1.03) 1.00 (0.98-1.02) 1.00 (0.97-1.02) 1.00 (0.97-1.04) 1.02 (0.99-1.05) 1.02 (0.99-1.05) Quartile 3 (>3.6 & 6.0) 1.00 (0.97-1.04) 1.01 (0.98-1.04) 1.01 (0.98-1.04) 0.99 (0.96-1.02) 1.01 (0.99-1.04) 1.01 (0.99-1.04) Quartile 4 (>6.0) 1.03 (1.00-1.07) 1.05 (1.02-1.08) 1.04 (1.01-1.07) 1.00 (0.95-1.04) 1.03 (1.00-1.07) 1.03 (1.00-1.07)
P-trend 0.02 <0.01 <0.01 0.82 0.08 0.07
Per IQR* 1.02 (1.00-1.04) 1.03 (1.02-1.05) 1.03 (1.02-1.05) 1.00 (0.98-1.02) 1.02 (1.00-1.03) 1.02 (1.00-1.04) *Among log-transformed urine arsenic concentrations (>17.6 vs 4.20 for total arsenic and >6.0 vs 2.0 for DMA)
Model 1: Adjusted for age, race, education, urine creatinine, and urine arsenobetaine.
Model 2: Further adjusted for smoking, alcohol, body mass index, hypertension, diabetes, estimated glomerular filtration rate, albuminuria, C-reactive protein, blood cadmium and blood lead
Table 3. Odds ratios (95% confidence interval) of hyperuricemia (defined as serum uric acid level >=7 for men and >=6 for women) by urine arsenic concentrations
Men (n=2,875) Women (n=2,757)
Total arsenic (g/L) C/NC Model 1 Model 2 Model 3 n (C/NC) Model 1 Model 2 Model 3
Quartile 1 (4.2) 97/442 1.00 (Ref) 1.00 (Ref) 1.00 (Ref) 121/634 1.00 (Ref) 1.00 (Ref) 1.00 (Ref)
Quartile 2 (>4.2 & 8.2) 157/557 1.20 (0.83-1.74) 1.26 (0.89-1.79) 1.24 (0.87-1.76) 138/571 1.24 (0.84- 1.83) 1.45 (0.95-2.22) 1.44 (0.95-2.20) Quartile 3 (>8.2 & 17.3) 191/609 1.36 (0.89-2.08) 1.53 (1.03- 2.29) 1.54 (1.03-2.30) 128/536 1.05 (0.74- 1.48) 1.39 (0.94-2.07) 1.43 (0.95-2.16) Quartile 4 (>17.3) 205/617 1.55 (1.04-2.30) 1.87 (1.27- 2.76) 1.84(1.26-2.68) 119/510 0.88 (0.56- 1.36) 1.21 (0.75-1.95) 1.26 (0.77-2.07) p-trend 0.06 <0.01 <0.01 0.22 0.98 0.89 Per IQR* 650/2,22 5 1.31 (1.08-1.58) 1.47 (1.21-1.79) 1.46 (1.20-1.77) 506/2,25 1 0.90 (0.75-1.08) 1.05 (0.85-1.30) 1.07 (0.86-1.35) Dimethylarsinate (g/L)
Quartile 1 (2.0) 97/423 1.00 (Ref) 1.00 (Ref) 1.00 (Ref) 122/650 1.00 (Ref) 1.00 (Ref) 1.00 (Ref)
Quartile 2 (>2.0 & 3.6) 162/555 0.98 (0.72-1.31) 0.94 (0.69-1.27) 0.91 (0.67-1.25) 135/558 1.27 (0.90-1.80) 1.60 (1.14-2.25) 1.61 (1.16-2.25) Quartile 3 (>3.6 & 6.0) 159/608 0.94 (0.67-1.32) 1.04 (0.75-1.45) 1.05 (0.75-1.46) 115/499 0.88 (0.61-1.28) 1.14 (0.77-1.67) 1.19 (0.82-1.73) Quartile 4 (>6.0) 232/639 1.25 (0.87-1.78) 1.46 (1.04-2.04) 1.41 (1.01-1.96) 134/544 1.01 (0.69-1.46) 1.48 (0.95-2.29) 1.49 (0.96-2.31) p-trend 0.08 <0.01 0.01 0.69 0.26 0.25 Per IQR* 650/2,22 5 1.16 (0.98-1.36) 1.34(1.13-1.59) 1.30 (1.09-1.55) 506/2,25 1 0.97 (0.79-1.18) 1.19 (0.94-1.49) 1.22 (0.97-1.54) C: cases; NC: non-cases.
*Among log-transformed urine arsenic concentrations (>17.3 vs. 4.20 for total arsenic and >6.0 vs. 2.0 for dimehtylarsinate) Model 1: Adjusted for age, race, education, urine creatinine, and urine arsenobetaine
Model 2: Further adjusted for smoking, alcohol, body mass index, hypertension, diabetes, estimated glomerular filtration rate, albuminuria, C-reactive protein, blood cadmium, and blood lead
Table 4. Odds ratios (95% confidence intervals) of gout by urine arsenic concentrations*
Men (N= 1,048) Women (N= 1,085)
Total arsenic (g/L) C/NC Model 1 Model 2 Model 3 C/NC Model 1 Model 2 Model 3
Tertile 1 (5.2) 25/238 1.00 (Ref) 1.00 (Ref) 1.00 (Ref) 7/396 1.00 (Ref) 1.00 (Ref) 1.00 (Ref)
Tertile 2 (>5.2 & 12.5) 40/315 1.41 (0.81-2.47) 1.64 (0.89-3.03) 1.57 (0.84-2.94) 12/340 2.17 (0.98-4.82) 2.82 (1.12-7.10) 3.07 (1.17-8.08) Tertile 3 (>12.5) 48/382 1.53 (0.77-3.05) 1.46 (0.67-3.20) 1.40 (0.64-3.08) 11/319 3.65 (1.31-10.14) 4.79 (1.63-14.1) 5.46 (1.70-17.6)
p-trend 0.40 0.70 0.75 0.03 0.02 0.01
Per IQR** 113/935 1.24 (0.80-1.92) 1.19 (0.72-1.96) 1.15 (0.71-1.89) 30/1,055 2.53 (1.09-5.90) 3.07 (1.27-7.41) 3.44 (1.26-9.38)
Dimethylarsinate (g/L)
Tertile 1 (2.5) 29/235 1.00 (Ref) 1.00 (Ref) 1.00 (Ref) 11/396 1.00 (Ref) 1.00 (Ref) 1.00 (Ref)
Tertile 2 (>2.5 & 4.8) 41/311 1.34 (0.69-2.63) 1.52 (0.68-3.37) 1.43 (0.66-3.13) 12/323 1.33 (0.65-2.73) 1.64 (0.81-3.32) 1.83 (0.85-3.90) Tertile 3 (> 4.8) 43/389 1.37 (0.58-3.26) 1.24 (0.44-3.51) 1.19 (0.42-3.37) 7/336 1.34 (0.48-3.75) 1.89 (0.65-5.46) 1.98 (0.64-6.15)
p-trend 0.57 0.90 0.94 0.59 0.24 0.24
Per IQR** 113/935 1.10 (0.75-1.61) 0.96 (0.62-1.50) 0.93 (0.59-1.46) 30/1,055 1.30 (0.60-2.84) 1.58 (0.71-3.54) 1.62 (0.69-3.81) C: cases; NC: non-cases.
*The analysis was restricted to men and women ≥40 years in NHANES 2007-2010 (N=2,133)
**log-transformed urine arsenic concentrations (percentiles 25th and 75th were 4.1 and 17.3 for total arsenic and 2.0 and 5.9 for DMA) Model 1: Adjusted for age, race, education, urine creatinine, and urine arsenobetaine
Model 2: Further adjusted for smoking, alcohol, body mass index, hypertension, diabetes, estimated glomerular filtration rate, albuminuria, C-reactive protein, blood cadmium, and blood lead
Figures & legends,
Figure 1. Odds ratio (ORs) for hyperuricemia comparing the 75th with 25th percentile of the total arsenic and dimethylarsinate (DMA) in men (N=2875), by participant
characteristics, National Health and Nutrition Examination Survey, 2003-2010. The 75th and 25th percentiles of were 17.3 and 4.2 g/L for total arsenic and 6.0 and 2.0
g/L for dimethylarsinate. Odds ratios were adjusted by age, education (<high school, =high school, >high school), race/ethnicity, smoking (never, former, current), alcohol(never, former, current), body mass index (kg/m²), hypertension(yes, no), diabetes(yes, no), estimated glomerular filtration rate(mg/min/1.73 m2),
albuminuria(mg/g), c reactive protein(mg/dL), blood cadmium (g/L), and blood lead(g/L). For all arsenic measures, urine creatinine was adjusted to account for urine dilution and urine arsenobetaine was adjusted for total arsenic and DMA. Estimated 2-sided p values for the interaction between all urine species with participants’ characteristics were computed by using the Wald test adjusting for complex design.
Figure 2. Odds ratio (ORs) for hyperuricemia comparing the 75th with 25th percentile of the total arsenic and dimethylarsinate (DMA) in women (N=2757), by participant
characteristics, National Health and Nutrition Examination Survey, 2003-2010. The 75th and 25th percentiles of were 17.3 and 4.2 g/L for total arsenic and 6.0 and 2.0
g/L for dimethylarsinate. Odds ratios were adjusted by age, education (<high school, =high school, >high school), race/ethnicity, smoking (never, former, current), alcohol(never, former, current), body mass index (kg/m²), hypertension(yes, no), diabetes(yes, no), estimated glomerular filtration rate(mg/min/1.73 m2),
albuminuria(mg/g), c reactive protein(mg/dL), blood cadmium (g/L), and blood lead(g/L). For all arsenic measures, urine creatinine was adjusted to account for urine dilution and urine arsenobetaine was adjusted for total arsenic and DMA. Estimated 2-sided p values for the interaction between all urine species with participants’ characteristics were computed by using the Wald test adjusting for complex design.