探討三種分類方法來提升混合方式用在兩階段決策模式的準確率:以旅遊決策為例 - 政大學術集成
174
0
0
全文
(2) Acknowledgements I am writing this acknowledgement to thank all the people who had aided me during the two-year Master Degree in National Cheng-Chi University (NCCU). Without all the help, I would not be able to fulfil the completion of this dissertation and complete my degree in time. This dissertation is dedicated to them. Firstly, I would like to give huge thanks to my supervisor, Prof. Fong-Lin Fu, for all her patience and advices that she has given to me. Her enthusiasm and knowledge has helped me to maintain this dissertation at high standard. With all my heart, I truly do appreciate and have enjoyed working on this topic with her in NCCU. And also thanks to the two defence committees, Prof. Rua-Huan Tsaih and Prof. Yi-Ning Tu, of my dissertation presentation for their suggestions and advises.. 政 治 大 I would like to express my deepest gratitude to my beloved family members who 立 have always being by my side to support me and give me warmth when I am in need.. ‧ 國. 學. Much thanks to my lovely parents and siblings who have always took care of me and have experienced all the ups and downs with me. I would also like to express my. ‧. special thanks to Gordon Lung who has proof-read all my work without uttering a single word of complaint. The key momentum that pushed me to continue working on this dissertation when I am down and under-pressure was the encouragements they gave me during the process of writing.. er. io. sit. y. Nat. al. v. n. Lastly, I would also like to thank my friends and staffs of NCCU who had helped. Ch. i n U. and supported me when I was nervous upon the arrival to a new environment. My two years as a MD student life would not be complete the otherwise.. engchi.
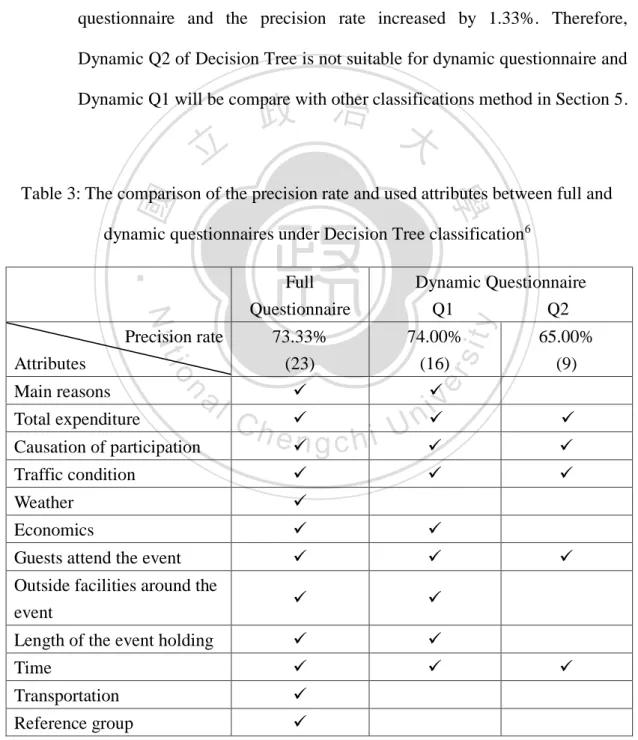
(3) Abstract The two-stage data mining technique for classifications in tourism recommendation system is necessary to connect user perception, decision criteria and decision purpose. In existed literature, hybrid data mining method combining Decision Tree and K-nearest neighbour approaches (DTKNN) were proposed. It has a high precision rate of approximately 80% in K-nearest Neighbour (KNN) but a much lower rate in the first stage using Decision Tree (Fu & Tu, 2011). It included two potential improvements on two-stage technique. To improve the first stage of DTKNN in precision rate and the efficiency, the amount of questions is decreased when users search for the desired recommendation on the system. In this paper, the researcher investigates the way to improve the first stage of DTKNN for full questionnaires and also determines the suitability of dynamic questionnaire based on its precision rate in future tourism recommendation system. Firstly, this study compared and chose the highest precision rate among Decision Tree, Multi-staged Binary Tree and Back Propagation of Error Neural Network (BPNN). The chosen method is then combined with KNN to propose a new methodology. Secondly, the study compared and determined the suitability of dynamic questionnaires for all three classification methods by. 立. 政 治 大. ‧ 國. 學. ‧. decreasing the number of attributes. The suitable dynamic questionnaire is based on the least amount of attributes used with an appropriate precision rate. Tourism recommendation system is selected as the target to apply and analyse the usefulness of the algorithm as tourism selection is a two-stage example. Tourism selection is to determine expected goal and experience before going on a tour at the first stage and to choose the tour that best matches stage one. The result indicates that Multi-staged Bi-. n. er. io. sit. y. Nat. al. Ch. i n U. v. nary Tree has the highest precision rate of 74.167% comparing to Decision Tree with 73.33% then BPNN with 65.47% for full questionnaire. This new approach will improve the effectiveness of the system by improving the precision rate of first stage under the current DTKNN method. For dynamic questionnaire, the result has shown that Decision Tree is the most suitable method given that it resulted in the least difference of 1.33% in precision rate comparing to full questionnaire, as opposed to. engchi. 1.48% for BPNN and 4% for Multi-staged Binary Tree. Thus, dynamic questionnaire will also improve the efficiency by decreasing the amount of questions which users are required to fill in when searching for the desired recommendation on the system. It provides users with the option to not answer some questions. It also increases the practicality of non-dynamic questionnaire and, therefore, affects the ultimate precision rate..
(4) Keywords: Classification, Data-mining, Two-stage Decision Model, Multi-staged Binary Tree, K-nearest Neighbour, Back Propagation of Error Neural Network.. 立. 政 治 大. ‧. ‧ 國. 學. n. er. io. sit. y. Nat. al. Ch. engchi. i n U. v.
(5) Contents. II.. Introduction ............................................................................................................ 1 1.1.. Background ................................................................................................ 1. 1.2.. Problem Statement ..................................................................................... 1. 1.3.. Goals and Objectives ................................................................................. 4. 1.4.. Significance of this Research ..................................................................... 5. 1.5.. A Brief Overview of Research Methodology ............................................ 5. Literature Review .................................................................................................. 6 2.1. 2.2.. Research Definition and Framework of Back Propagation of Error Neural. 學. 2.3.. 政 治 大 Research Definition 立 and Framework of Multi-staged Binary Tree ......... 10 Research Definition and Framework of Decision Tree.............................. 6. ‧ 國. I.. Network.................................................................................................... 13. ‧. Research Definition and Framework of K Nearest Neighbour ................ 16. 2.5.. Target Application: Tourists’ Decision on Destination Selection ............ 17. sit. y. Nat. 2.4.. n. al. er. io. III. Research Methodology ........................................................................................ 21. i n U. v. 3.1.. Research Conceptual Framework ............................................................ 21. 3.2.. Target Application .................................................................................... 25. 3.3.. Research Operational Definition.............................................................. 26. 3.4.. Research Hypotheses ............................................................................... 31. 3.5.. Data Collection ........................................................................................ 33. 3.6.. Planned Evaluation Method ..................................................................... 34. 3.7.. Questionnaire Development and Evaluation ........................................... 36. Ch. engchi. IV. Result Analysis and Evaluations .......................................................................... 41 4.1. Decision Tree Analysis ............................................................................ 41. 4.1.1. Analysis of “excited, usable and warm” for Decision Tree ................. 42.
(6) 4.2. Multi-staged Binary Tree Analysis .......................................................... 61. 4.2.1. Analysis of “excited and unexcited” for Multi-staged Binary Tree .... 62 4.2.2. Analysis of “usable and non-usable” ................................................... 81 4.2.3. Analysis of “warm and non-warm” ................................................... 102 4.3 V.. Back Propagation of Error Neural Network Analysis............................ 115. Conclusions and Suggestions............................................................................. 139 5.1.. Conclusion of the Research ................................................................... 140. 5.2.. Implication and Suggestion of the Research .......................................... 142. 政 治 大 Appendices ................................................................................................................. 145 立 5.3.. Limitation of the Research ..................................................................... 143. Appendix A. Decision Tree for Full Questionnaire ......................................... 145. ‧ 國. 學. Appendix B. Multi-staged Binary Tree for Dynamic Questionnaire .............. 146. ‧. Appendix C. Multi-staged Binary Tree for Full Questionnaire....................... 148. sit. y. Nat. Appendix D. First Set for Back Propagation of Error Neural Network in the. io. er. hidden nodes from 10-45. .......................................................... 150. Appendix E. The Precision Rate Plot for Full Questionnaire in Back Propagation. al. n. v i n C hNetwork ............................................................ of Error Neural 153 engchi U. Appendix F.. The Precision Rate Plot for Dynamic Questionnaire One in Back. Propagation of Error Neural Network........................................ 154 Appendix G. The Precision Rate Plot for Dynamic Questionnaire Two in Back Propagation of Error Neural Network........................................ 155 Appendix H. The Precision Rate Plot for Dynamic Questionnaire Three in Back Propagation of Error Neural Network........................................ 156 Appendix I.. The Precision Rate Plot for Dynamic Questionnaire Four in Back Propagation of Error Neural Network........................................ 157.
(7) Appendix J.. The calculation of the unused attributes values for Dynamic questionnaire three ..................................................................... 158. Appendix K. The calculation of the unused attributes values for Dynamic questionnaire four ...................................................................... 159 References .................................................................................................................. 160. 立. 政 治 大. ‧. ‧ 國. 學. n. er. io. sit. y. Nat. al. Ch. engchi. i n U. v.
(8) Figure Figure 1: The Representation of full-grown Decision Tree diagram ............................. 7 Figure 2: Example of the Decision Tree Model ............................................................. 8 Figure 3: The Representation of Multi-staged Binary Tree ......................................... 11 Figure 4: Example of the Multi-staged Binary Tree Model......................................... 11 Figure 5: Neural Network represents nodes, weights on arrows ................................. 14 Figure 6: The two-stage model of recommendation system structure ......................... 23 Figure 7: Three classification methods in the first stage ............................................. 24. 政 治 大. Figure 8: The diagram of differences in recall rate and precision rate ........................ 36. 立. ‧. ‧ 國. 學. n. er. io. sit. y. Nat. al. Ch. engchi. i n U. v.
(9) Table Table 1: The questionnaire for the research ............................................................... 38 Table 2: The trees results of questionnaires selection for “excited, usable and warm” for Decision Tree.......................................................................................... 42 Table 3: The comparison of the precision rate and used attributes between full and dynamic questionnaires under Decision Tree classification ........................ 49 Table 4: Decision rules of “excited, usable, warm” for full questionnaire ................ 53 Table 5: Most used attributes of “excited, usable, warm” for full questionnaire ...... 60. 政 治 大 Multi-staged Binary 立Tree ............................................................................. 63. Table 6: The trees results of dynamic questionnaires for “excited and unexcited” of. ‧ 國. 學. Table 7: The comparison of the precision rate and used attributes between full and dynamic questionnaires in “excited and unexcited” .................................... 71. ‧. Table 8: Decision rules of “excited and unexcited” for full questionnaire ................ 74. sit. y. Nat. Table 9: Attributes used of “excited & unexcited” for full questionnaire ................. 80. al. er. io. Table 10: The trees results of full and dynamic questionnaires for “usable and. v. n. non-usable” of Multi-staged Binary Tree .................................................... 82. Ch. engchi. i n U. Table 11: The comparison of the precision rate and attributes used between full and dynamic questionnaires in “usable and non-usable” ................................... 90 Table 12: Decision rules of “usable and non-usable” for dynamic questionnaire ....... 94 Table 13: Used attributes of “usable and non-usable” for full questionnaire ............ 101 Table 14: The trees results of full and dynamic questionnaires for “usable and non-usable” of Multi-staged Binary Tree .................................................. 103 Table 15: The comparison of the precision rate and attributes used between full and dynamic questionnaire in “warm and non-warm” ..................................... 110 Table 16: Summary of precision rate and number of attribute used .......................... 112.
(10) Table 17: The percentage and attributes decreased from full questionnaire to dynamic questionnaires ............................................................................................ 112 Table 18: The precision rates of Neural Network for full questionnaire ................... 120 Table 19: The precision rates of Back Propagation of Error Neural Network for dynamic questionnaire one ........................................................................ 124 Table 20: The precision rates of Back Propagation of Error Neural Network for dynamic questionnaire two ........................................................................ 128 Table 21: The precision rates of Back Propagation of Error Neural Network for. 政 治 大 Table 22: The precision rates of Back Propagation of Error Neural Network for 立. dynamic questionnaire three (with the average value) .............................. 133. dynamic questionnaire four (with the average value) ................................ 137. ‧ 國. 學. Table 23: Summary of the highest precision rate and attribute used for full and four. ‧. questionnaire conditions ............................................................................ 139. sit. y. Nat. Table 24: Comparisons of Decision Tree, Multi-staged Binary Tree and Back. io. er. Propagation of Error Neural Network for full questionnaire ..................... 140 Table 25: Comparisons of Decision Tree, Multi-Staged Binary Tree and Back. al. n. v i n C h Network for dynamic Propagation of Error Neural questionnaire............. 141 engchi U.
(11) |1. I. Introduction 1.1. Background Tourism is the most popular activity that people love to do during their holidays such as a long weekend after their busy working days or when their children have summer or winter vacation. According to the statistics by the United Nation World Tourism Organisation (UNWTO) 2013, 25 million tourists travelled overseas in the year 1950 but that number had increased dramatically by 1010 million to 1035 million. 政 治 大 increased to 6 billion. UNWTO also forecasted that there will be 1.8 billion tourists 立. tourists by 2012, which averaged about 66.7% per year. Domestic tourists also. (United Nation World Tourism Organisation, 2013).. 學. ‧ 國. travelling overseas by 2030 with an average annual rate of 3.3% from 2010 to 2030. ‧. y. Nat. Tourists often plan their trips in accordance with search results found on various. er. io. sit. travel agents’ websites after providing inputs such as the desired travel location and time. The tourism recommendation system we plan to develop is the tourists use to. al. n. v i n Cwebsites. plan their trips on travel agents’ U system that utilizes users’ h e n gIt cisha ifiltering past behaviours and series of discretionary characteristics in recommending another or additional items to the users. Thus, different tourists with the same tourism experience or personal preference would receive different outcomes as they value different aspects of tourism differently.. 1.2. Problem Statement From the recommendation system, the search results, depending on past individual behaviour such as previously searched key words, list information on all potential tourism locations. This causes people to feel that the tourism information.
(12) |2. displayed on the results page is difficult to read and quickly identify their desirable places and time. Therefore, this study will collect and utilize tourists’ perception, their decision criteria, and the decision purpose of going on a trip on the tourism recommendation system in order to have more detailed and user oriented search results for the users.. In a rational decision making process, human brains use different frames to act with different decision types (Martino, Kumaran, Seymour & Dolan, 2006). The. 政 治 大 Will (Doyle, 2011; Dennett, 1981). The model describes that people are able to 立. two-stage decision in this study adopts similar ideas as the Two-Stage Model of Free. generate alternative possibilities “freely”, that could be caused or uncaused by prior. ‧ 國. 學. events, and possibilities “will” be adequately evaluated to choose or select what is. ‧. desired (Doyle, 2011). In addition, Dennett (1981) denotes the two-stage model as a. sit. y. Nat. reasonable idea for making a decision. He mentioned in the case when considering an. io. er. important decision which an individual cannot decide immediately, one can reject irrelevant courses first and then the remaining options will always have more. al. n. v i n negligible bearings that will be C considered at the second h e n g c h i U stage. The second stage is to. analyse those considerations/options in detail and select the most reasonable and desirable idea in order to make a final decision that the decision maker likes without any regret.. The idea of the Two-Stage Model of Free Will is applied to the two-stage decision model for testing the combination of classifiers in this study. Using the two-stage decision model to simulate a decision with a goal of arousing specific affection by a decision behaviour will yield a better outcome. For example, the usable purpose of participating in a tour or a vocational activity is to get specific joyful.
(13) |3. (relaxing, educating, aesthetic) experiences. A recommendation system which combines the expected affection aroused, decision influencing variables and choices of engaged behaviour will conclude the usable purpose of the decision maker. While this kind of decision type appears to be the selection of a tour (behaviour) but the reality is that it is attempting to engage in certain behaviours which achieve the real purpose of getting specific joyful experiences.. To reach the purposes of recommending the decision target and the arousing of. 政 治 大 combining the Decision Tree and 立. the expected enjoyment (experiences), according to the specific conditions, the hybrid data mining method. K-nearest neighbour. approaches (DTKNN) has been proposed in existing literature (Fu & Tu, 2011). The. ‧ 國. 學. researchers suggested, first, building a database which classifies the data to different. ‧. subsets that are based on affection aroused using Decision Tree. The algorithm will. sit. y. Nat. choose one subset based on the expected affection aroused and then filter the most. io. er. suitable choices from one of the data subset by K-nearest neighbour (KNN). Decision trees can classify large amounts of data into specific classes based on the attributes of. al. n. v i n possesses theCadvantage of less processing time. And the KNN hengchi U. the data. It also. methodology allows for greater flexibility in the classification work needed to find all the training examples that are relatively similar to the attributes of the test example. In. the algorithm of DTKNN, Decision Trees can classify large amounts but yields less accuracy than the KNN methodology (precision rate 80%) in gift-giving application (Fu & Tu, 2011). This research aims to improve the algorithm in the applied in tourism recommendation system..
(14) |4. 1.3. Goals and Objectives There are three aspects that need to be improved from the DTKNN methodology. The first aspect is to improve the effectiveness of the system by increasing the precision rate at the first stage of the classification. It is important as the precision rate of decision tree classification before combining with KNN to DTKNN is currently inaccurate as it produces unexpectedly low rates. In order to do so, this study will apply these two methodologies: Multi-staged Binary Tree and Back Propagation of Error Neural Network (BPNN) to examine whether the precision rate can be improved. 政 治 大 positive effect on the effectiveness. The reason to select Multi-staged Binary Tree and 立 to exceed Decision Tree methodology. A higher precision rate will have a direct. BPNN to compare with the Decision Tree algorithm is because both classifications. ‧ 國. 學. methods are more accurate and have been applied on several applications than. ‧. Decision Tree classification method (Shmueli, Patel & Bruce, 2010).. sit. y. Nat. io. er. Secondly, to improve the efficiency by decreasing the amount of questions which the users are required to fill. As the previously proposed approach of DTKNN. al. n. v i n C hDecision Tree methodology mentioned above, the system with does not have path engchi U. ways to generate results with adequate precision rate. Users have to enter all relevant information when searching for the ideal tourism place. To do so, this study will analyse how Multi-staged Binary Tree and BPNN will decrease the search time and produce valuable information to the users in a timelier manner. Lastly, this study will extend the new method to more and general applications.. This study will further compare two other methods, Multi-staged Binary Tree and BPNN for integrating with KNN in an affective oriented recommendation system. The researcher will also investigate another application namely, tour and vocational.
(15) |5. activity selection, as an example to extend the usage of the new model to common service selection.. 1.4. Significance of this Research Tourism Recommendation System that aims to assist users in their decision making is very widely used on the Internet throughout the world. People who are to make travel plans are always in need of a recommendation system with a highly accurate precision rate so that the most ideal decision can be reached. Researcher of. 政 治 大 the existing tourism recommendation system. Therefore, the researcher believes that a 立 this study is still highly motivated to and interested in improving the accuracy rate of. research in algorithms to generate a new approach that improves the accuracy rate is. ‧ 國. 學. of considerable value to the existing literature and in practice. Ideally the new. ‧. approach under the idea of the two-stage decision model can be utilized in not just the. er. io. sit. y. Nat. recommendation system for tourism but also for other applications.. 1.5. A Brief Overview of Research Methodology. al. n. v i n C hwill conduct a survey In this study, the researcher to collect data and use the engchi U. collected sample to validate the algorithms. For each of the three algorithms technique, Decision Tree, Multi-staged Binary Tree and BPNN, the researcher of this study will examine their accuracy or precision rate when integrated with KNN for the generation of a new approach for the recommendation system. The comparison of these algorithms will be discussed in Chapter 2. The methodology of choosing the target application will be discussed in Chapter 3. The tourism industry is the chosen target as its decision making process requires the analysis of a large amount of inputs from the users. These inputs can vary significantly due to the diverse demographic background and differences in personal values of the users. Moreover, evident from the statistics.
(16) |6. from the UNWTO (2013), tourism is an industry with a vast base of participants. As a result, an improvement to the accuracy of such an extremely complicated decision making process will most likely, if not certainly, creates significant value to the global economy.. The results and suggestions regarding whether Multi-staged Binary Tree or BPNN should be integrated with KNN in becoming the new and better approach for tourism recommendation system domain will be discussed in Chapter 4. The overall. 政 治 大. conclusion of this study will be made in Chapter 5.. 立. ‧ 國. 學. II. Literature Review. ‧. The two-stage hybrid approach, DTKNN, uses Decision Tree to classify data to. sit. y. Nat. different affective datasets and uses KNN to filter recommendation items in a specific. io. er. dataset. In this study, both Multi-staged Binary Tree and BPNN are investigated for their accuracy and efficiency in classification compared to Decision Tree. These four. al. n. v i n algorithms and their conceptualC frameworks will be discussed h e n g c h i U as follows. 2.1. Research Definition and Framework of Decision Tree 2.1.1. Concept. Decision Tree algorithm is one of the most widely used method in predicting the final outcome variables, and also a famous and effective data mining or text mining technique in pattern recognition. It is an easily understandable classification method and is able to quickly classify large amount of data. It contains a testing set and a set of training data samples where each sample has unique classes so that no duplicated classes exist (Fayyad & Irani, 1990). The data.
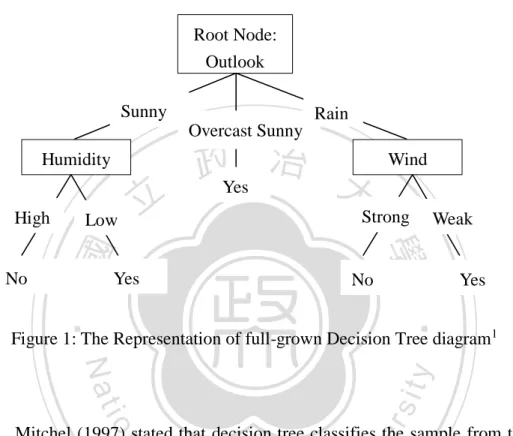
(17) |7. training set is used to grow the decision tree, and it is similar to a voting system that the new observation is assigned from the class with the highest vote (Shmueli, Patel & Bruce, 2010).. 2.1.2. Methodology Root Node: Outlook Sunny. Rain Overcast Sunny. Humidity. 立. Yes. Wind. Strong. No. Weak. 學. No. Low. Yes. ‧. ‧ 國. High. 政Yes 治 大. Figure 1: The Representation of full-grown Decision Tree diagram1. er. io. sit. y. Nat. Mitchel (1997) stated that decision tree classifies the sample from the root. al. n. v i n C hcorresponded leafUnode below for predicting the node of the tree to the final engchi. outcome value. Figure 1 shows an example of a full-grown decision tree. The root node of Outlook splits into two parts. Each node has its own attribute: Sunny and Rain respectively. The attribute is to test the probability for choosing the higher possible node of the tree to create a new sub-tree root node: Humidity and Wind respectively. However, decision tree does not use all of the attributes as it will influence the classes of the samples or it is rarely significant enough to decide the class of the record. Each branch moves down from the root node towards the. 1. The Representation of full-grown Decision Tree diagram is referenced from Machine Learning by Mitchel Tom M. (1997).
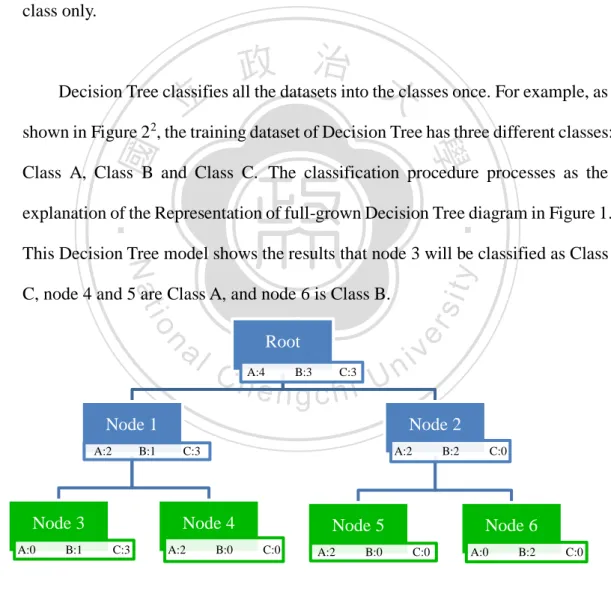
(18) |8. sub-tree root node that contains a higher possibility value for the attribute of the node. The new sub-tree root of the tree is created and the same procedure is repeated until the final outcome value is produced. The final outcome is based on the final node, the leaf node, of the tree without the branch. The class of the leaf node of the decision tree (Yes or No) is decided by using a majority class of a node. Only one leaf node is belonged to a single class. Due to that condition, all the data would lose accuracy as it is an inconsistent instance classifying into one single class only.. 政 治 大 Decision Tree classifies all the datasets into the classes once. For example, as 立. shown in Figure 22, the training dataset of Decision Tree has three different classes:. ‧ 國. 學. Class A, Class B and Class C. The classification procedure processes as the. ‧. explanation of the Representation of full-grown Decision Tree diagram in Figure 1.. sit. y. Nat. This Decision Tree model shows the results that node 3 will be classified as Class. io. Root. n. al. er. C, node 4 and 5 are Class A, and node 6 is Class B.. Ch. A:4. B:3. C:3. engchi. i n U. Node 1 A:2. B:1. Node 3 A:0. B:1. Node 2 C:3. A:2. Node 4 C:3. v. A:2. B:0. B:2. Node 5 C:0. A:2. B:0. C:0. Node 6 C:0. A:0. B:2. C:0. Figure 2: Example of the Decision Tree Model (Resource from Fu & Tu, 2011) 2. Example of the Decision Tree Model is referenced from Intelligence on Gift Giving Website Based on Hybrid Approach of Decision Tree and Similarity by Fu & Tu (2011)..
(19) |9. 2.1.3. Avoid over-fitting Shmueli, Patel & Bruce (2010) argued that the performance and the accuracy of the Decision Tree are all based on assessing the data test set. The accuracy of the decision tree is influenced by the over-fitting of the training datasets or when the testing set varies in time (Chattamvelli, 2009) as some misclassification errors occur, hence the poor performance on new data and reduction in the accuracy rate of the decision tree. The way to avoid over-fitting and reduce the errors of misclassification is to prune the full-tree and to stop tree growing.. 2.1.4. Strength and Weakness. 立. 政 治 大. Decision Tree is an uncomplicated data mining technique on predicting. ‧ 國. 學. values of responses and probabilities for any experts or non-experts as compared. ‧. to other data mining methods. It is easy to interpret and understand the outcomes. sit. y. Nat. of the method and users are not required to have thorough understanding of the. io. er. technique in advance (Chattamvelli, 2009). However, it is hard to interpret the rules if the rules deduce in the classification settings have a large number of. al. n. v i n attributes and classes that isCset to be classified. ItU h e n g c h i will also become more complex. than before.. Conceptually, Decision Tree is a better classification technique on nonlinear data mining models than linear models. This automatically selects features and does not need any transformation of variables when generating the outcome values. It can also be used for large datasets. Furthermore, it progresses faster than other classification models during the process. However, as a result of Decision Tree progressing faster with huge datasets, there is likely to be many errors in the classifications. Consequently, the classification error rate is also higher than other.
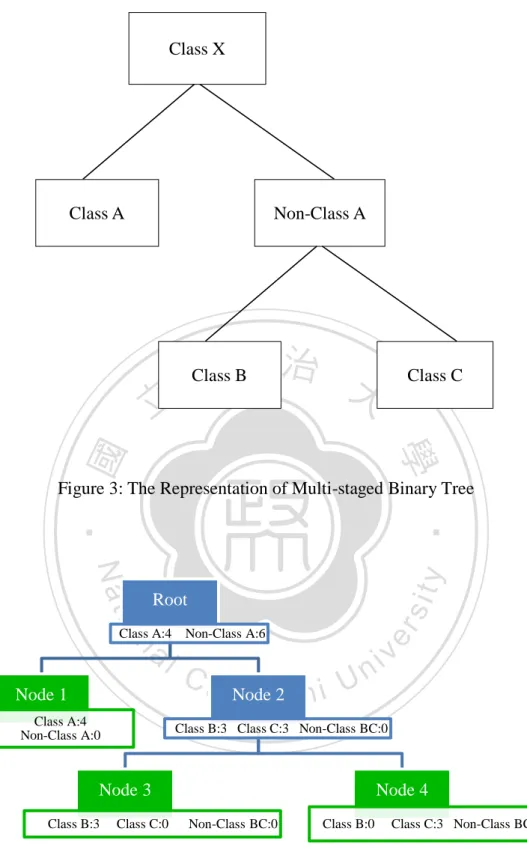
(20) | 10. classification method when the training dataset is small.. Another disadvantage of Decision Tree is that the validity period of Decision Tree is not explicitly specified as time dependent data may have some invalid rules. It has to separate the rules into dependent and independent times attribute (Chattamvelli, 2009).. 2.2. Research Definition and Framework of Multi-staged Binary Tree. 政 治 大 Multi-staged Binary Tree is an extension method of the Decision Tree. Their 立. 2.2.1. Concept. concepts are similar but a difference between them is the procedure of. ‧ 國. 學. classification. The number of the Multi-staged Binary Tree is based on the number. sit. al. er. io. 2.2.2. Methodology. y. Nat. Multi-staged Binary Tree would be n-1.. ‧. of classes. If the number of the target classes was n, then the number of the. n. v i n CTree, In Multi-staged Binary node splits into at most two child nodes h e each ngchi U. (Chattamvelli, 2009). It classifies one dataset first and then classifies another. dataset afterwards, which is the two-step classification while Decision Tree classifies all the datasets into the classes once. Each step of the process classifies for two classes: terminal node and non-terminal node. For an example of Figure 3, it classifies Class X into Class A and Non-Class A at the first step, and then classifies the non-terminal node of Non-Class A into Class B and Class C at the second step..
(21) | 11. Class X. Class A. Non-Class A. 政 治 大. Class B. 立. Class C. ‧ 國. 學. Figure 3: The Representation of Multi-staged Binary Tree. ‧. Class A:4. Non-Class A:6. n. al. er. io. sit. y. Nat. Root. Node 1 Class A:4 Non-Class A:0. Ch. eNode n g2c h i. i n U. Class B:3 Class C:3 Non-Class BC:0. Node 3 Class B:3. v. Node 4. Class C:0. Non-Class BC:0. Class B:0. Class C:3 Non-Class BC:0. Figure 4: Example of the Multi-staged Binary Tree Model3 (Resource from Fu & Tu, 2011) 3 Example of the Multi-staged Binary Tree Model is referenced from Intelligence on Gift Giving Website Based on Hybrid Approach of Decision Tree and Similarity by Fu & Tu (2011).
(22) | 12. For the instance of Multi-staged Binary Tree classification in Figure 4, if there are 3 classes: A, B and C to be classified, it will be classified into Class A and Non-Class A at the first step and then classifies Non-Class A into Class B and Class C at the second step as Non-Class A includes Class B and Class C. In the results from an example of the model shows that the Class A is node 1, node 3 as Class B, and the node 4 is classified as Class C.. As this research is based on dynamic survey, using Multi-staged Binary Tree. 政 治 大 or plan on tourism recommendation system. When using Multi-staged Binary Tree 立 has greater advantage than Decision Tree when user searches for the desired place. model, users do not have to complete the whole questionnaire in order to be able to. ‧ 國. 學. search, but they do under Decision Tree. It will be more efficient if users only need. ‧. to fill in parts of questionnaire of the often extensive tourism survey.. sit. y. Nat. io. er. In this study, the researcher used three approaches to generate the target trees by Multi-staged Binary Tree method, and the classification procedure refers to the. al. n. v i n procedure in Figure 4: (1) C for “excited with unexcited” h e n g c h i U target category approach,. the first step is to classify excited and unexcited dataset into the nodes of excited and unexcited, which unexcited is a non-terminal node. The second step is to continue classifying the non-terminal node of unexcited into the nodes of usable and warm. (2) For “usable and non-usable” target approach, the first step is to classify the dataset of usable and non-usable into the nodes of usable and non-usable, which non-usable is a non-terminal node. The second step is to continue classifying the non-terminal node of non-usable into the nodes of excited and warm.(3) for “warm and non-warm” target approach, the first step is to classify warm and non-warm dataset into the nodes of warm and non-warm, which.
(23) | 13. non-warm is a non-terminal node. The second step is to classify the non-terminal node of non-warm into excited and usable perceptions.. 2.2.3. Strength and Weakness Multi-staged Binary Tree and original Decision Tree are highly similar; hence Multi-staged Binary Tree has the same advantages and weaknesses as Decision Tree. However, as Multi-staged Binary Tree is an improved version that was extended from Decision Tree, it is more accurate. People use Multi-staged. 政 治 大 is more accurate and it can break up complex decisions into simpler decisions for 立. Binary Tree more when applying to areas of complex schemes as the accuracy rate. flexible the method, the greater the efficiency.. 學. ‧ 國. the obtaining of more desirable solutions. Therefore, it shows that the more. ‧. sit. y. Nat. However, some may argue that Multi-staged Binary Tree is less favourable. io. er. than Decision Tree due to the complexity of the method itself. Due to the number of large classes generated, it may have repeated nodes produced in the tree which. al. n. v i n C hnodes to be larger than causes the number of terminal the number of actual classes. engchi U. Thus, it would increase the search time and the memory space in the system (Safavian & Landgrebe, 1991). Overall, the performance of both Multi-staged Binary Tree and Decision Tree are dependent on the designing of the tree.. 2.3. Research Definition and Framework of Back Propagation of Error Neural Network 2.3.1. Concept There is another pattern recognition methodology for data mining called Neural Network, which is a highly predictive classifier that bases on a biological.
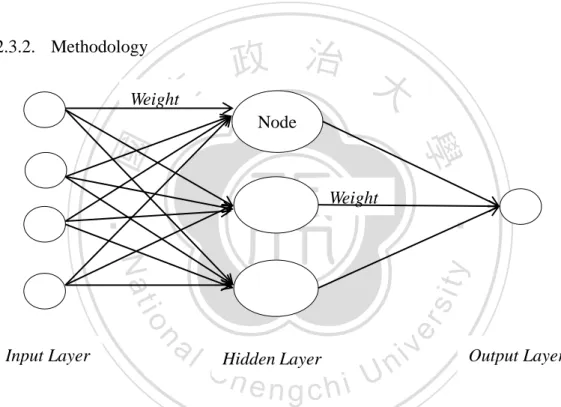
(24) | 14. model in the brain, also known as Artificial Neural Network. It acts like the nerve system, where the interconnected neurons in the brain are learning experiences and solving significant problems. Therefore, Neural Network has been successfully used and applied in several applications such as in business, financial and engineering etc. as it supports capturing complex relationships between predictors (input) and responses (output) (Yeh, et al, 2012; Shmueli, Patel & Bruce, 2010).. 2.3.2. Methodology. 立. Weight. 政 治 大 Node. ‧ 國. 學 ‧. Weight. n. al. er. io. sit. y. Nat Input Layer. Ch. Hidden Layer. engchi. i n U. v. Output Layer. Figure 5: Neural Network represents nodes, weights on arrows. The structure of Neural Network has three layers: input layer, hidden layer (or processing layer), and output layer. These are shown in Figure 5 4. The neurons in each layer are connected to the neurons in other layers. The connected arrows between each layer are called weights. Neural Network calculates the weights of. 4. Neural Network Diagram is referenced from Data Mining for Business Intelligence: Concepts, Techniques, and Applications in Microsoft Office Excel with XLMiner by Shmueli, Patel & Bruce. (2010). Second Edition..
(25) | 15. connected nodes between the layers to determine the probabilities of prediction.. The two types of Neural Networks that have been most popularly used are described in the following with the simplest definitions (Gaur, 2012; Yeh et al., 2012): 1.. Multilayer feed-forward networks: It is a fully one-way connected flow.. 2.. Back Propagation of Error: It is a continuous flow like a cycle that computes the errors from the output layer back to the hidden layer.. 政 治 大 As in this study, we collected the data from the questionnaire. The data has 立. been trained by using the Back Propagation of Error algorithm or BPNN as the. ‧ 國. 學. weights are measured by the error. The BPNN tool in Matlab is used for testing the. ‧. accuracy when looking for tourist place in the future prediction. The input is the. y. Nat. dataset of attributes that would affect the target, and the target for defining the. er. io. sit. desired target output is the dataset of 3 classes: “excited, usable and warm”. These inputs and outputs are used to apply the prediction network for the future accuracy. n. al. Ch. of the recommender system.. engchi. i n U. v. In the results of the BPNN, there are three different precision rates of training, validation, and testing set. The definitions are list below (Stackoverflow, 2014): . The precision rate of training set adjusts the weights of dataset in the procedure of Neural Network.. . The validation rate indicates and minimises the over-fitting of Neural Network. If on the same hidden nodes, the precision rate of validation is decreased or stayed the same, but the training rate is increased, then.
(26) | 16. there is an over-fitting of Neural Network. . The testing set tests the final solution for checking the predictive power in the actual cases.. 2.3.3. Strength and Weakness Neural Network is good for generating predictable values as its accuracy is usually higher than other data mining techniques. However, it is not interpretable for non-experts. People who want to use Neural Network are required to learn the. 政 治 大. technique in advance. The cost of implementation is also higher than other methods.. 立. ‧ 國. 學. It is a self-organisation method (Chattamvelli, 2009) as it can adjust itself to. ‧. delete the redundant data transmissions links when the model is built.. io. al. v i n C hFramework of UK Nearest Neighbour Research Definition and engchi n. 2.4.. er. computation (Alippi, Piuri & Sami, 1995).. sit. y. Nat. Nevertheless it is sensitivity to error propagation as the error can affect a neuron’s. 2.4.1. Concept. KNN algorithm is a simple and straightforward statistic classifier for text classification on machine learning and data mining of pattern recognition technique, which contains training set and test set (Wu & Coggeshall, 2012). It is simple and well performing, and non-parametric machine learning that the number of parameters will increase significantly overtime.. 2.4.2. Methodology However, the parameter machine learning is truly constant and the number of.
(27) | 17. parameters is independent of training set size. The most commonly way to determine the nearest K value of the data points is using the Euclidean Distance formulae as following (Chuvakin, Schmidt & Phillips, 2012).. distance = √∑𝑛𝑖=1(𝑝𝑖 − 𝑞𝑖 )2. (1). K controls the complexion of the KNN algorithm. From the formulae in Equation (1) above, as the K value increases, the more data points are being. 政 治 大 the larger the K value, the smoother the output. Moreover, Gong and Liu (2011) 立. consulted and all those data points are in and to make the results smoother. Thus,. stated that the larger the sample size, the lower the efficiency of KNN, because of. ‧ 國. 學. there tends to be more texts figures which lead to the performance of the. ‧. classification being impaired. In addition, in the selection of K value, it is the. sit. y. Nat. smaller the K and neighbour confusion, the lower the accuracy and vice versa.. io. er. Therefore, the selection of K value is extremely important as the accuracy result is dependent on the K value.. n. al. Ch. engchi. i n U. v. 2.5. Target Application: Tourists’ Decision on Destination Selection 2.5.1. Tourism destination selection of experience and expectation view Tourists’ destination decision has been selected as the target application because it is very complicated and requires a significant amount of inputs. To tourists, tourism or participated leisure activity are opportunities where they create varied experiences in the process (Seng & Chen, 2012). Various emotions can be generated from tourism participation, such as pleasure, joy, or fun, and at times, frustration as well (Wang, 1999). People’s expectations before the process and their perceived experience during and after the process are the two important.
(28) | 18. determinants of satisfaction. Satisfaction and dissatisfaction are determined by the differences between the participant’s feelings of expectations and experience. If the experience turns out to be better than the expectation, the tourist will feel satisfied or even surprised, and vice versa dissatisfied or even frustrated (Rust and Oliver, 1994). The expectation will be adjusted dynamically after the new experiences (Seng & Chen, 2012).. There are many possible touristic experiences including relaxation, recreation, entertainment, refreshment, 政 治 大 sensation-seeking, sensual pleasures, excited, play, and so on (Wang, 1999). 立. rehabilitation,. diversion,. According to Joseph and Gilmore (1998) the two dimensional classifications of. ‧ 國. 學. experience are active and passive experiences. Active experience is defined such. ‧. as educational or escapist purpose which a tourist active participate a tour. Passive. sit. y. Nat. experiences include esthetical or entertainment experiences which were perceived. io. er. by tourists during the processes of tourism. Both active and passive experience may co-exist within tourism.. n. al. Ch. engchi. i n U. v. 2.5.2. Tourism destination images for destination decision selection Tourists choose to participate in a tour based on their expectation and experience of a destination. Destination image was defined as the expression of all knowledge, impressions, prejudices and emotional thoughts that an individual or a group has regarding a particular object or place. It includes perceptual, cognition and affection evaluations (Baloglu & McCleary, 1999). Tourist’s experiences and satisfaction will be influenced by different destination images. For example, Chi & Qu (2008) proposed seven factors for determining destination image of a hot spring in Arkansas, USA, the measurements they used were “travel environment”,.
(29) | 19. “natural. attraction”,. “entertainment. and. events”,. “historic. attraction”,. “infrastructure”, “accessibility”, “relaxation”, “outdoor activities”, and “price and value”. Another group of items was proposed to measure the experience of visiting a museum, which included: “easiness and fun”, “cultural entertainment”, “personal identification”, “historical reminiscences”, and “escapism” (Seng & Chen, 2008). “Price” was not considered as a measurement in Seng & Chen’s (2008) paper. Although the measurements of experience vary, the same conclusion was reached from previous studies that significantly impacted destination image. 政 治 大. on tourist satisfaction (e. g. Yuksel, Yuksel & Bilim, 2010; Rojas & Camarero, 2008; Chi & Qu, 2008).. 立. ‧ 國. 學. 2.5.3. Different tourism characteristics impact on destination of decision selection. ‧. Individual characteristics were considered as factors influencing experience. sit. y. Nat. of tourism or vocational activity. To different tourists, same tourism would. io. er. produce different experiences because experiences of tourism were not only influenced by the physical environment but also influenced by personal and social. n. al. factors.. i.. Ch. engchi. i n U. v. Destination of decision selection influenced by personal factor Tourists’ past experience impacted vacation activity behaviour in a. negative way. That is, as the experience of visiting the same place increased, people tend to visit fewer places during their current trip, to participate in fewer activities, and to choose narrower sets of activities (Lehto, O’Leary & Morrison, 2004). Demographic variables such as age, education, income, gender, occupation, and marital status have all been suggested as influencing variables to experience of tour perceptions and images..
(30) | 20. Among them, age and education appear to be major determinants of image. But they were not always proved as good predictors to destination selection (Lehto, et al., 2004; Wang, 1999). Instead, they may be affected by other factors intermediary to destination selection. For example, age was associated with risk involvement. With an increased age, the trip decision time became longer and earlier ticket reservations were made (Lehto, et al., 2004). Educational background has proven to be an important variable in explaining information search behaviour; more highly educated people tend. 政 治 大. to be more involved in information searching (Lehto, et al., 2004).. 立. In addition, Ekonde (2010) states that gender is related to a person’s. ‧ 國. 學. personality, intentions and the way to behave. It is also a major characteristic. ‧. affecting decision making for destination selection. There are two factors of. sit. y. Nat. determining the destination choices: push and pull factors (Meng & Uysal,. io. er. 2008). That is, different genders usually have different thoughts of ideas and views about experiences. As a result, gender is the main factor driving. al. n. v i n Cmakings differences in decision selection. For instance, the h e n gofcdestination hi U main reasons that males decide to travel is due to business work or family. friends gathering. Females, on the other hand, are due to their recreational desire. Males will consider sports and new experiences or adventures when planning and selecting the tourism place, but females will consider with a stronger relaxation motive (Jönsson & Devonish, 2008) on family gathering, culture, and personal reasons when selecting the tourism place for travelling.. ii.. Destination of decision selection influenced by social factor Social factor is another important factor for the experience of tourism or.
(31) | 21. vocational activity. For many families, holidays, to a significant extent, are taken for the joy of their children. In recreational tourism one not only gains pleasant experiences from seeing sights, events, or performances, but also simultaneously experiences harmony in family relationship (Wang, 1999). Sheng and Chen’s research (2012) also pointed out that visitors of museum on weekdays were mainly student groups and for educational purpose. Their experience might be described as “cultural entertainment” or “historical reminiscences”. During holiday periods, visitors were more family or. 政 治 大 and “personal identification” experiences exist in these kinds of visitors. 立. individuals, and have relaxation as the main objective. “Fun”, “escapism”. Therefore family life cycle may be an influencing factor for preferring to visit. ‧ 國. 學. museum.. ‧ y. sit. io. 3.1. Research Conceptual Framework. al. er. Nat. III. Research Methodology. n. v i n Every user who wants to goCfor tourism always has h e n g c h i U own perceptions and decision. criteria that need to be considered. Tourism selection is an idea under the two-stage model. When a tourist decides to go on a tour, the first stage is to consider the type of. experience sought after and the expected goal of the tour based on the expected perception. At second stage, the tourist needs to choose the most desirable which matches the criteria under stage one. This is the reason that tourism fits a two-stage model and is the research target of this particular research. Tourists need to think about the expected perception because a tourism destination can have many different perceptions in the minds of different tourists. Depending on various factors, tourists can have different perceptions regarding the tour such as the person to go with and the.
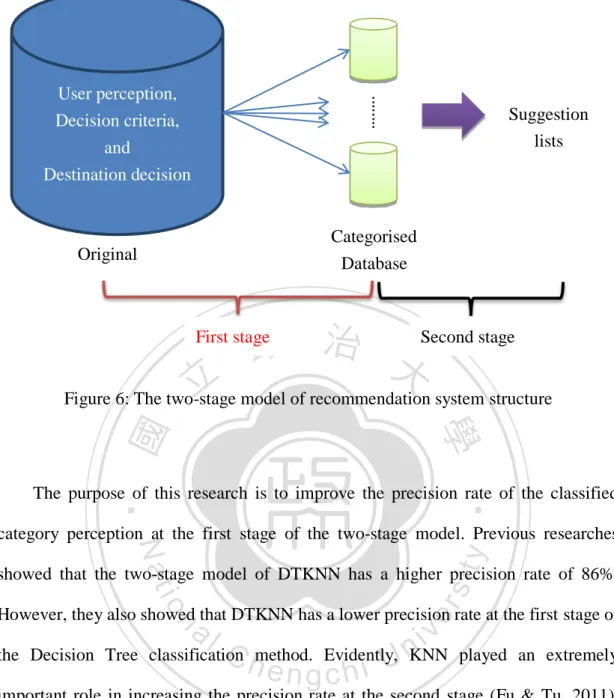
(32) | 22. environment or facilities around the tour etc. For example, spending time with family in a tour of Tokyo will give warmth and happiness related perceptions to every family member. However, for a couple going on the same tour, they will experience lovely and romantic perceptions at every moment during the tourism. Thus, these expected perceptions are dependent on what the tourists want to experience in the tour. They are also a benchmark for the determination of tourism recommendation systems’ ability to accurately find out the perceptions sought after by tourists in this research.. 政 治 大 perceptions that they wish to experience in the tour; the decision criteria that users need 立 The perceptions of users include experience from past tourisms and the expected. to consider before making a decision includes the content details of the place, the. ‧ 國. 學. outside environment and facilities around the place, how many people can accompany. ‧. with, and other personal characteristics etc. These significant factors may influence the. sit. y. Nat. destination decision on selecting the tourism place and other criteria for experiencing. io. er. new or expected perceptions in the tour. Therefore, in Figure 6 of the two-stage model of tourism recommendation system, it shows that the tourism selections of decision. n. al. Ch. suggestions are dependent on user perceptions,. engchi. iv n decision U criteria. and destination. decision in this research. The first stage of the two-stage model of the recommendation system of this research is to classify the user perceptions of tourism into different single categories database of user perceptions such as fresh database, romantics database, excited database, usable database, warm database, gaining knowledge database or old times database etc., and then further classify the specific category of user perceptions that have been chosen by the user in order to produce the recommended tourism decision suggestions to users at the second stage of two-stage model..
(33) | 23. .….…. User perception, Decision criteria,. Suggestion lists. and Destination decision. Categorised Database. Original. 政 治 大Second stage. First stage. 立. Figure 6: The two-stage model of recommendation system structure. ‧ 國. 學 ‧. The purpose of this research is to improve the precision rate of the classified. sit. y. Nat. category perception at the first stage of the two-stage model. Previous researches. io. er. showed that the two-stage model of DTKNN has a higher precision rate of 86%. However, they also showed that DTKNN has a lower precision rate at the first stage of. al. n. v i n C hmethod. Evidently,U KNN classification engchi. the Decision Tree. played an extremely. important role in increasing the precision rate at the second stage (Fu & Tu, 2011). Therefore, in this research, the focus on the improvement of the precision rate is set at the first stage of the two-stage model. This study will compare different classification methods in order to select the better classification method with the higher precision rate of classified user perception to be combined with KNN for the generation a new methodology for recommendation system. One that will be a more accurate and effective system than DTKNN method.. The reason to use the classification method to classify the perceptions in the.
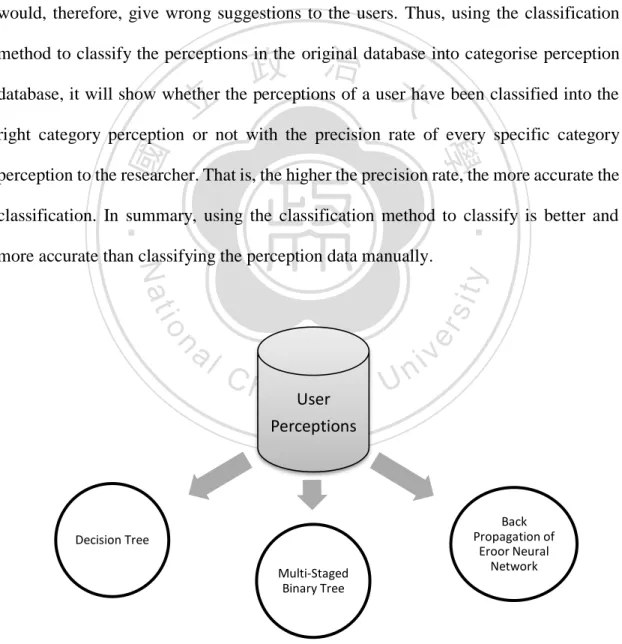
(34) | 24. original database into the categorise perception database at the first stage is because a tour can produce and give a tourist more than one perception. If the original database in Figure 6 classifies each category of perceptions into every specific category by hand, it would cause the error occurred during the classification process as a tour could contain more than one perception. The precision rate would not also be showed accurately. It would not clearly show to the classifier what are the main perceptions sought. Consequently the category perception would have contained incorrect perceptions and would, therefore, give wrong suggestions to the users. Thus, using the classification. 政 治 大 database, it will show whether the perceptions of a user have been classified into the 立. method to classify the perceptions in the original database into categorise perception. right category perception or not with the precision rate of every specific category. ‧ 國. 學. perception to the researcher. That is, the higher the precision rate, the more accurate the. ‧. classification. In summary, using the classification method to classify is better and. n. al. er. io. sit. y. Nat. more accurate than classifying the perception data manually.. Ch. e nUser gchi. i n U. v. User. Perceptions Perception. Decision Tree Multi-Staged Binary Tree. Back Propagation of Eroor Neural Network. Figure 7: Three classification methods in the first stage.
(35) | 25. The original database will be classified into different single user category perception database by a classification method at the first stage of the two-stage model. The researcher will examine three different classification methods namely, Decision Tree, Multi-Staged Binary Tree and BPNN, which is shown in Figure 7 of the research structure of the first stage classification method of the two-stage model, and compare these three classifications’ precision rate for classifying the perceptions into specific category. The researcher of this study will then choose the classification with the highest precision rate to be a classification method at the first stage of the two-stage. 政 治 大 the first stage method by Fu & Tu (2011) and the overall precision rate of the 立 model in this research. This will improve the previous research on the precision rate of. recommended decision suggestions to the users from the two-stage model.. ‧. ‧ 國. 學. 3.2. Target Application. sit. y. Nat. In this research, tourism is chosen as the target application due to its. io. er. overwhelming popularity as a leisure event that most people like to do when they are free or on holidays. The statistics of tourists travelling overseas recorded that tourists. al. n. v i n have increased to 1035 million C tourists in 2012, which h e n g c h i Uincreased by about 66.7% per. annum from 1950 (United Nation World Tourism Organisation, 2013). However, a tourism destination is a very complicated and hard decision especially when trying to match the expected perceptions to be experienced with the tourist’s personal factors and characteristics. The most probable influencing factors to the perceived perceptions and decision making are found in personal and social factors where the decision is affected by, for example, gender and age. Different gender will normally experience different perceptions in a tour. For instance, males would like to experience sports and knowledge gained from the tourism while females would like to experience family gathering, money spending, romantics and warm from the tour (Jönsson & Devonish,.
(36) | 26. 2008). In addition, different age groups will also influence the decision making and experience different expected perceptions. The researcher’s observations showed that older people prefer to relax and experience family gathering in a tour while teenagers would like to party hard and spend times with friends in a tour. Thus, tourists in different age groups have different people in mind when going on a tour and experience the expected perceptions together. This shows that different perceptions will be experienced in tourism by different people such as those with different gender and age.. 政 治 大 critically examined with the several perceptions on how to clearly distinguish them into 立 Therefore, tourism is set as the target application in this research, which will be. the specific categorise of perceptions, and help decision makers to select the most. ‧ 國. 學. suitable and effective decisions of tourism place with the most accurate perceived. ‧. perceptions that the tourist will be able to experience in the tour.. er. io. sit. y. Nat. 3.3. Research Operational Definition. An operational definition is to define the words’ operational meanings for. al. n. v i n producing and measuring the C concept in the research h e n g c h i U (Cooper& Schindler, 2011).. Tourists always formulate their expectation of trips by considering their previous experience, decision criteria and destination. These factors will influence the final decision when selecting the destination and the expected perceptions that they want in the tour. The operational definition of user perception, decision criteria and destination decision are discussed in this part.. (1). User Perception User perception in tourism is the most important feature of tourism decisions.. Different users will form different perceptions in their journey. To decide their.
(37) | 27. next holiday location, users take into account their previous experiences and the expected perceptions of the tour, and also the decision criteria based on their individual preferences. For example, before the tourists go to Europe for a holiday with family, they expect to feel warmth and happiness before the trip as it is a family gathering event. The feeling of warmth and happiness will remain throughout the entire trip if everything went as planned. As a result, Europe, as their chosen destination for this trip would leave a good impression in their minds for future events. However, that may not be the reality if they were robbed on the. 政 治 大 acceptable standard of public security. Therefore, user perception is an important 立 last day of their travel and found out that their chosen destination has a less than. significantly affect future tourism decisions.. sit. y. ‧. Decision Criteria. Nat. (2). 學. ‧ 國. consideration when selecting a tourism destination as past experience can. io. er. Before users depart, they would carefully look up the details of the trip, the outside environment and the facilities surrounding the event. They would also. al. n. v i n know the number of peopleC that are travelling along. h e n g c h i U Depending on all the relevant. decision criteria, the tourists then make the final decision. The factors (in bold font) that affect the final decision of tourism decision are as follows:. The selective event includes the attributes of: . The type of tour describes the tour type that the subject participated in. For example, the type of tour sets a theme based on factors such as its local culture or seasonal festival event as its main attractions.. . The subjects participated in the event always have a main reason to participate in the event such as being attracted by the advertisement or.
(38) | 28. news about the event, or previous attendance of that event. It will influence the expectation of perceptions. For example, (1) being attracted by advertisements, news or others is more serious and may result in a strong expectation of perception. (2) Where birthday or festive purposes are the main reason, it is less likely to be a thoroughly organised event. (3) The reason of attended before have more evidence to the perception of the event. The main reason will also have an impact on whether to attend or not. . 政 治 大 subject’s expected expenditure will also effect on their decision making. 立. The total expenditure attribute is an event limitation. That is, the. For example, people attending an exhibition will take into account the. ‧ 國. 學. fees of the entry ticket, the transportation cost, and any souvenirs sold. Nat. sit. y. ‧. there as people might be interested to consume.. io. Causations of participation can have a significant influence over the. al. v i n C making subject’s decision before actually attending the event. Most U heng i h c n. . er. Outside environment/facilities around the event includes the attributes of:. causations are variables beyond the control of the decision makers. There are many other potential external factors which may affect the decision maker. For example, traffic condition, weather, economics, guests attending the event, other facilities around the event, length of the event held, time, transportation, reference group, and attractiveness of the content and the planning of the event. These factors creates varying levels of influence on specific perception. For example, if the traffic condition or weather is bad, it has a greater negative impact on romantic perception than the perception of usable.
(39) | 29. or gain knowledge.. People to go with includes the relationships among the participants, the number of people to go with and relationships between the people who go with. These attributes will impact on the expectation of perception depending on the strengths of the relationships between the participants. For example, number of people to participate an event together is related to the individual relationships with each other. If the relationships among the. 政 治 大 are more than expectation, then it is more likely that this event will be more 立. participants are friends or colleagues, and the number participated guests. desirable than attending the event alone or with the unfamiliar friends.. ‧ 國. 學 ‧. Personal information factors include the attributes of sex, age, impressions,. sit. y. Nat. personalities, the way to make a decision, lifestyle and interest. These. io. er. attributes show that everyone has different personal preferences and personalities which would affect the decision of whether to attend an event.. al. n. v i n C h and other factorsUcan influence each other. Also, personal information engchi . The personalities include extraversion and introversion types. Different types of personalities may come to different decisions in the same situation. To compare with the introverts, extraverts are more outgoing and sociable. They usually make decisions after giving regards to the thoughts of their peers (Quenk, 2009; Myer, 1985). In contrast, introversion people is more independent. They are not easily affected by external factors and usually have their own ideas when making decisions on destination perception.. . The way to make a decision describes how decision makers decide..
(40) | 30. According to Quenk (2009) and Myer (1985), an intuitive decision maker is often introverted and normally makes decision based on their first thought. In contrast, a decision maker who is more sensitive is normally attracted and affected by the environment around and things experienced or to be experienced before decision made (Quenk, 2009; Myer, 1985). As such, introverts are usually able to quickly come to a final decision on their own. However, extroverts will not easily make a decision without consulting on the opinions of other people first. . 政 治 大 advocates are less likely to fully plan their entire trip upfront and 立. Lifestyle describes the way the people plan their lives. Freedom. generally prefers a more “road trip” style event (Quenk, 2009; Myer,. ‧ 國. 學. 1985). These people are less likely to have a strong and decisive mind.. ‧. They can be easily affected when friends or family have different. research. and. organise. io. sit. to. everything. prior. to. the. er. attempt. y. Nat. opinions. In contrast, people who prefers to always have a plan will. commencement of the trip (Quenk, 2009; Myer, 1985). They have their. al. n. v i n C h and would like own expected perceptions to plan ahead in accordance engchi U with their expected perceptions. . People have different interests may have different expected perception that they want to experience during the trip. People who are interested in beauty and fashion may want to experience usable or warm perceptions, as compared with people who are interested in food, sport, or leisure may want to experience more excited or usable perceptions. On the other hand, people who are interested in art or animation and games may want to experience excited perceptions. This shows that people who have different interests/hobbies will produce different thoughts and.
(41) | 31. perceptions that they want to experience.. (3). Destination Decision Destination decision aims to consider all relevant reasons and conditions that. affect the target’s willingness to participate in an event. This is what the subject is aiming to gain from the event. For example, in events such as a floral festival or a Tokyo trip where the subjects went with their family and friends, the destination decision would be holiday relaxation, and family and friends gathering.. 3.4. Research Hypotheses. 立. 政 治 大. H1: BPNN has the highest precision rate than Multi-staged Binary Tree and. ‧ 國. 學. Decision Tree.. ‧. sit. y. Nat. In the inference of H1, BPNN has the highest precision rate than Multi-staged. io. er. Binary Tree and Decision Tree because BPNN is a good method for generating predictable values as its precision rate is usually higher than other data mining. al. n. v i n methods such as Decision C Tree and Multi-stage U h e n g c h i Binary Tree. That classification has been successfully used and applied on several applications in many areas such. as in business, financial and engineering etc. (Yeh, et al, 2012; Shmueli, Patel & Bruce, 2010). BPNN produces better predict solution when it is non-linear relationship. It can adjust itself to delete redundant data more easily when the model is built (Chattamvelli, 2009) than Decision Tree and Multi-stage Binary Decision Tree classifications. Even Decision Tree is an easily interpretable and understandable method as it is automatic on feature selection and does not need transformation variables during the process of classification. However, it has high classification error rate while the training set of the process is small. Multi-staged.
(42) | 32. Binary Tree is more usable and stable with the higher precision rate than Decision Tree method as proposed by the research of Find Fun seminar report (Peng, Kao, Huang, Yeh and Hsiao, 2011).. Multi-staged Binary Tree is complex, so is BPNN. Nevertheless in this research, BPNN will be used to classify the databases for comparing with Multi-staged Binary Tree and Decision Tree methods. Even though BPNN is complex and not easily to interpret for non-experts, it has an advantage on the. 政 治 大 process again which shows that the method is more sensitive on error detections 立. technique of the BPNN. If error is detected during the process, it will go back and. than other methods (Shmueli, Patel & Bruce, 2010). Thus the researcher deduces. ‧ 國. 學. that H1 is established for this research on tourism recommendation system.. ‧. sit. y. Nat. H2: Dynamic Questionnaire will be suitable applied with reasonable precision. io. er. rate in the future of the tourism recommendation system when the decision suggestions need to be recommended to the users.. n. al. Ch. engchi. i n U. v. Dynamic questionnaire is a unique and personalised internet survey that directs respondents in answering the questions throughout the survey. It acts like a face-to-face interview (Snap Surveys, 2014; QuestionPro, 2007). It increases the response rate of the respondents and saves time on answering the questions (Snap Surveys, 2014; QuestionPro, 2007). Dynamic questionnaire has been proposed in Find Fun’s recommendation system (2011) where the researchers concluded that dynamic questionnaire is an easy and time saving way for users when searching the desirable events by using the recommendation system. Users do not need to fill all the questions on the questionnaire to obtain the recommended decision.
(43) | 33. suggestions. For example, when doing a survey, people might give up on using the recommendation system if there are too many questions in the questionnaire system. Thus, dynamic questionnaire decreases the possibility for people to withdraw from to filling the questionnaires when they use the recommendation system. Moreover, the precision rate in using dynamic questionnaire can be similar to a full questionnaire. In conclusion, these would boost the effectiveness of people doing dynamic survey to an extent greater than non-dynamic survey (Peng, Kao, Huang, Yeh & Hsiao, 2011). Therefore, the researcher deduces that. 政 治 大 suitable in this study and in the future for the tourism recommendation system. 立. H2 is established for this research, whereby dynamic questionnaire will be. ‧ 國. 學. 3.5. Data Collection. ‧. The researcher looked through the research, Find Fun, a seminar report of Peng,. sit. y. Nat. Kao, Huang, Yeh and Hsiao (2011), and found that the attributes they tested for the. io. er. precision rate on recommendation system is familiar and suitable for this tourism recommendation research. Thus, the researcher has asked Peng, Kao, Huang and Fu for. al. n. v i n C h Therefore, this their permission to use their database. research will use secondary engchi U database from the ordinary online-survey data collection collected by Peng, Kao,. Huang, Yeh and Hsiao in 2011 to generate the models for analysis.. The ordinary sample data collection was collected from March 25 th 2011 to April 6th 2011 which consists 686 data samples from students of National Cheng-Chi University (Peng, Kao, Huang, Yeh & Hsiao, 2011). The convenience sampling technique was applied in their research whereby students in the university were the subjects that undertook the online-survey. This technique of convenience sampling is a fast, easy and cost efficient way for data collection and allows researchers to obtain the.
(44) | 34. basic data collection (Cooper & Schindler, 2011). It is also useful for relationship detection between different subjects’ particular phenomena (Explorable.com, 2009). However, the convenience sampling technique was argued to be a misleading sampling technique as its collected samples can be highly unrepresentative (Black, 1999) due to the narrow base of sampling targets. However, the sampled subjects is acceptable for this research because people who look for the tourism place on website tend to be those who are technologically literate and university students generally fits in that description. Thus, the researcher thinks that university students are an acceptable of sample target.. 政 治 大. This is one of the reasons to why the questionnaire by Peng, Kao, Huang, Yeh & Hsiao (2011) was adopted.. 立. ‧ 國. 學. The whole of the collected sample will be used for modelling and predicting the. ‧. results in each of the classification methods. This research focuses on how the. sit. y. Nat. perception of subjects’ past experiences would affect their decision on attending a tour. io. al. n. gender groups etc.. er. or event. Therefore, no particular groups are distinguished or categorised, such as. Ch. engchi. i n U. v. 3.6. Planned Evaluation Method. The collected data from the survey will be used for analysing the precision rate at the first stage of the two-stage model with three different classifications methods: Decision Tree, Multi-staged Binary Tree and BPNN. As the aim of this research is to improve the first stage of the two-stage model of DTKNN approach as Decision Tree in DTKNN is low but when classified with KNN afterward, the precision rate is a much higher 86% (Fu & Tu, 2011). Thus, this research will use the collected data to analyse and compare the precision rate with different classifications in this research. The objective is to select and produce a higher accuracy rate of the two-stage approach.
(45) | 35. classifications than the previous DTKNN approach.. First of all, the collected data will be imported to the database document and then be reviewed and reorganised from the collections into the format of the classification methods manually. Second of all, the database of the data collection will be the source of analysis of precision rate by the different classification methods that have been mentioned in above section 3.1. Thirdly, this research will compare and analyse the results of each different classification methods from the data collected in database, and. 政 治 大. to conclude and suggest the better classification method with the data results at last.. 立. To evaluate Hypothesis 1, based on the questionnaire ideas and the content of the. ‧ 國. 學. questionnaire, the subjects’ perceptions are used in this study for generating and. ‧. analysing the databases with different classification models. Their resulting precision. sit. y. Nat. rates are then compared, rather than applying the recall measurement method, to see. io. er. which classification method is better for tourism recommendation system. As from the research of Fu and Tu (2011) they stated that the precision rate for suggesting decision. al. n. v i n Cthe is measured by the proportion of answers and the total suggested answers. h etarget ngchi U. The recall rate is measured by the proportion of the target answers and the total target answers (referred to the diagram in Figure 8). This indicates that the precision rate is more suitable than the recall method on evaluating the rates of recommended suggestion decisions in recommendation system. As the total target answers will only suggest the top suggested answer but will not provide all the possible suggestions to the users. Therefore, this research would like to use the secondary data questionnaire to generate and compare the modelling between Decision Tree, Multi-staged Binary Tree, and BPNN. It will test, evaluate and improve the precision rate in recommendation. system in this research. The analysis of this research is to determine how the subjects.
數據
+7


Outline
Introduction
Research Definition and Framework of Decision Tree
Research Definition and Framework of Multi-staged Binary Tree
Research Conceptual Framework
Analysis of “excited, usable and warm” for Decision Tree
Analysis of “excited and unexcited” for Multi-staged Binary Tree
Analysis of “usable and non-usable”
Analysis of “warm and non-warm”
Back Propagation of Error Neural Network Analysis
相關文件
– Taking any node in the tree as the current state induces a binomial interest rate tree and, again, a term structure.... Binomial Interest Rate
The main disadvantage of the Derman-Kani tree is the invalid transition probability problem, in which the transition probability may become greater than one or less than zero.
分為兩階段,第一階段選拔採用國際比賽使用之 Double Repechage 方式,取
傳統上市場上所採取集群分析方法,多 為「硬分類(Crisp partition)」,本研 究採用模糊集群鋰論來解決傳統的分群
Define instead the imaginary.. potential, magnetic field, lattice…) Dirac-BdG Hamiltonian:. with small, and matrix
Microphone and 600 ohm line conduits shall be mechanically and electrically connected to receptacle boxes and electrically grounded to the audio system ground point.. Lines in
The min-max and the max-min k-split problem are defined similarly except that the objectives are to minimize the maximum subgraph, and to maximize the minimum subgraph respectively..
Given a graph and a set of p sources, the problem of finding the minimum routing cost spanning tree (MRCT) is NP-hard for any constant p > 1 [9].. When p = 1, i.e., there is only
