Ultrafast Time-Resolved Pump
−Probe Spectroscopy of PYP by a
Sub
‑8 fs Pulse Laser at 400 nm
Jun Liu,
†,‡,§Atsushi Yabushita,
∥Seiji Taniguchi,
⊥Haik Chosrowjan,
⊥Yasushi Imamoto,
#Keiichi Sueda,
○Noriaki Miyanaga,
○and Takayoshi Kobayashi*
,†,§,∥,○†Advanced Ultrafast Laser Research Center, University of Electro-Communications, Chofugaoka 1-5-1, Chofu, Tokyo 182-8585 Japan ‡State Key Laboratory of High Field Laser Physics, Shanghai Institute of Optics and Fine Mechanics, Chinese Academy of Sciences,
Shanghai 201800, China
§Core Research for Evolutional Science and Technology (CREST), Japan Science and Technology Agency, 4-1-8 Honcho,
Kawaguchi, Saitama 332-0012, Japan
∥Department of Electrophysics, National Chiao Tung University, 1001 Ta Hsueh Road, Hsinchu 300, Taiwan ⊥Institute for Laser Technology, Osaka University, Yamadaoka 2-6, Suita Osaka, 565-0871 Japan
#Department of Biophysics, Graduate School of Science, Kyoto University, Kitashirakawa-Oiwake, Sakyo, Kyoto 606-8502 Japan ○Institute of Laser Engineering, Osaka University, Yamadakami 2-6, Suita 565-0871, Ibaraki 567-0047, Japan
ABSTRACT: Impulsive excitation of molecular vibration is known to induce wave packets in both the ground state and excited state. Here, the ultrafast dynamics of PYP was studied by pump−probe spectroscopy using a sub-8 fs pulse laser at 400 nm. The broadband spectrum of the UV pulse allowed us to detect the pump−probe signal covering 360−440 nm. The dependence of the vibrational phase of the vibrational mode around 1155 cm−1 on the probe photon energy was observed for thefirst time to our knowledge. The vibrational mode coupled to the electronic transition observed in the probe spectral ranges of 2.95−3.05 and 3.15−3.35 eV was attributed to the wave packets in the ground state and the excited state, respectively. The frequencies in the ground state and excited state were determined to be 1155 ± 1 and 1149 ± 1 cm−1, respectively. The frequency difference is due to change after photoexcitation. This means a reduction of the bond strength associated withπ−π* excitation,
which is related to the molecular structure change associated with the primary isomerization process in the photocycle in PYP. Real-time vibrational modes at low frequency around 138, 179, 203, 260, and 317 cm−1were also observed and compared with the Raman spectrum for the assignment of the vibrational wave packet.
■
INTRODUCTIONSpectroscopic studies of the structure, dynamics, and function of protein are important in biological research because the dynamical evolution of protein structures is tightly connected to the biochemical reactivity. The photoactive yellow protein (PYP) is a small (125 amino acids, 14 kDa) water-soluble blue-light photoreceptor protein. It is isolated from the purple sulfur bacterium Ectothiorhodospira halophila.1−4PYP has become an attractive model for the photochemical studies of the structure, dynamics, and function of protein since it was discovered by Meyer in 1985.5 This is because PYP has a simple and photochemically stable structure and shows a relatively simple photoreaction cycle.6−8These features make it an ideal sample for the investigation of the dynamical response of a protein in the photochemistry process. Blue-light excitation of PYP triggers a photocycle involving several intermediates on a time scale extending from a few hundred femtoseconds to hundreds of milliseconds. In the last decades, several experimental techniques, including time-resolved UV/vis spec-troscopy,8−13 X-ray crystallography,14−16 FTIR
spectrosco-py,17,18 and resonance Raman spectroscopy,19,20 have been applied for the clarification of the mechanism of this interesting photocycle.
PYP has a p-coumaric acid (4-hydroxy cinnamic acid) chromophore which is attached via a thioester linkage only to the cysteine residue in the protein (Cys69). This structure gives PYP’s ground state a bright yellow color. In a dark state, the chromophore is in the trans conformation. The chromophore carries a negative charge and is stabilized through a hydrogen bond with Tyr42 and Glu46 (protonated) to its phenolate oxygen.21−23 The structure of the p-coumaric acid chromo-phore is shown in Figure 1. After the absorption of the blue light by the chromophore in the dark state, PYPG(sometimes
called P or PG, with absorption maximum at 446 nm), several photocycle intermediates appear.
Received: January 4, 2013
Revised: March 25, 2013
Published: March 27, 2013
Typically, the photocycle includesfive steps.24−32The initial photoisomerization of the p-coumaric acid chromophore, which triggers the photocycle, is the primary photoreaction. The initial trans−cis isomerization process usually occurs on a time scale from several hundred femtoseconds to a few picoseconds. To study the mechanisms of the primary photoisomerization reaction in native PYP dispersed in an aqueous environment, several time-resolved techniques have been used, including time-resolved fluorescence spectroscopy33,34 and transient absorption spectroscopy.35,36 In addition, PYP’s mutants, analogues, and several chromophore models were synthesized and investigated.37−41 Different experimental studies have demonstrated that the photocycle in PYP is initiated by flipping the thioester bond with Cys69, instead of moving the aromatic ring.15This means that only a small rearrangement of the chromophore/protein structures in protein nanospace is required for the chromophore isomerization in the photocycle. In this study, broad-band pump−probe spectroscopy based on a sub-8 fs pulse at 400 nm was applied to clarify ultrafast primary dynamics in PYP. Real-time modulation of electronic transition probability and spectrum due to molecular vibrations of vibronically coupled modes was found in the induced difference absorbance traces. They are either impulsively induced by either the Raman process in the electronic ground state or excitation of coherent superposition of the two or more vibrational levels in the electronic excited state. The mechanism of the coherent vibration is discussed, utilizing the probe photon energy dependence of vibrational amplitude and phases of several modes generated by impulsive excitation. The low frequency modes were observed around 138, 179, 203, 260, and 317 cm−1. The dependence of the vibration phase and mode frequency on the probe photon energy at around 1155 cm−1 was investigated in detail.
■
EXPERIMENTAL SETUPThe time-resolved pump−probe spectroscopy was performed using a sub-8 fs pulse at 400 nm for both pump and probe pulses. The laser pulse was generated by a hollow fiber compressor system which has been described in detail elsewhere.42 Some key points are briefly described here. A commercial Ti:sapphire laser system (Coherent, Legend-USP) running at 1 kHz provides 2.5 mJ/800 nm/35 fs laser pulses. The amplified pulse was reduced to about 900 μJ and then frequency doubled in a 200-μm-thick beta barium borate (BBO, type I,θ = 29.2°) crystal. After several reflective mirrors, about 90μJ pulses at 400 nm were focused into a hollow fiber, which has a 140μm inner diameter and a 60 cm length. The hollow fiber was filled with 0.8 atm argon gas. The output pulse energy after the hollow fiber was about 45 μJ. The output beam diameter wasfirst reduced to about 2 mm by using two concave aluminum mirrors. Then, the pulse was dispersion compen-sated using a pair of Brewster-angle-cut fused silica prisms and another dispersion compensating system composed of a grating and a deformable mirror. Clean sub-8 fs pulses were obtained with energy satellites smaller than 3%. The sub-8 fs pulse duration was characterized with a sample-cell window from a broken sample cell by using the self-diffraction frequency-resolved optical gating (SD-FROG). In the pump−probe experiment, we moved away this sample-cell window used for dispersion precompensation. As a result, the sub-8 fs was the duration at the point between thefirst sample-cell window and the PYP sample. With the aid of a beam-pointing stabilizer before the hollow fiber,43 the energy stability of the output pulse was better than 0.5% rms for 3 h. The pump and probe configuration is the same as the SD-FROG measurement.43 The pump and probe beam diameters at 1/e2 on the sample were measured to be about 110 and 105μm, respectively, by a CCD camera. The pump and probe pulse energies can be tuned by using a step-variable 0.1-mm-thick neutral density (ND) filter. In the experiment, the pulse energies of the pump and probe beams were adjusted to be about 56 and 6.3 nJ, respectively.
In the experiment, the delay between the probe and the pump pulse was scanned by a stepper motor with 1 fs/step. The pump pulse was chopped to 500 Hz by a rotating sector. The probe beam was guided to the detection system through a bundled multimode fiber. As in our previous visible-pump/ visible-probe experiments,44,45 the detector of the ultrafast pump−probe experiment was a combined system of a polychromator and a 128-channel lock-in amplifier (MLA). The reference and probe pulses werefirst angular dispersed by the polychromator (600 grooves/mm, blazed at 300 nm), and then, the light at different wavelengths was separately guided by the 128-channel bundle fiber to the 128 photodetectors (avalanche photodiodes) before the MLA. The signal-to-noise ratio was enhanced by the phase-sensitive detection method. The MLA system detected the signal simultaneously over the full probe spectral range. The spectral resolution of the system was about 0.8 nm. The spectrum of the probe (pump) pulse measured by the MLA system without transmitting through the sample is shown in Figure 1.
■
SAMPLE PREPARATIONThe sample molecule was PYP dissolved in a buffer solution composed of Tris−HCl at pH 7.3. The absorbance of the sample solution in a 1-mm-thick sample cell at 446 nm (2.78
Figure 1.(top) The molecular structure of p-coumaric acid which is a chromophore in PYP and is bound to Tryp, Glu, and Cys by coordination for the former two and covalently to the last one, respectively. (bottom) The spectrum of the laser pulse used in the pump−probe experiment (thin black curve), the absorbed spectrum (red dotted curve), and the absorbance spectrum (thin blue curve) of the water solution sample of PYP in a 1 mm glass cell used in the pump−probe experiment.
eV) was ∼1.3. The stationary absorption spectrum measured with an absorption photometer (Shimadzu, UV-3101PC) is shown in Figure 1. Thefluorescence spectrum of PYP covers a range from about 450 nm (2.76 eV) to about 600 nm (2.07 eV) which is out of our probe wavelength region.42A 1-mm-thick sample cell containing the sample solution was set on a moving stage which continuously moves in the plane normal to the pump beam in a closed hexagram shape. The 0.2 mm/s moving speed is fast enough to avoid photodamage of the PYP sample because fewer than 250 shots are exposed in the same focal area. In this way, the damage to PYP from photolysis was minimized during the pump−probe experiment. This moving cell can reduce the consumption of samples in comparison with the case using the flowing cell in our previous experiment.42 The experimental results with both the moving cell and the flowing cell show the same vibrational frequency modes. The experiment with the moving cell was performed for a longer delay time to obtain higher frequency resolution and lower frequency modes. All experiments were performed at room temperature (295± 1 K).
■
RESULTS AND DISCUSSIONElectronic Relaxation. The absorbance change of the sample induced by the pump pulse was probed and recorded as a function of the pump−probe delay from −200 to 2300 fs. Figure 2 shows the two-dimensional pattern of difference
absorbance (ΔA = −log(1 + ΔT/T)) vs the pump−probe delay in the spectral range from 2.79 to 3.41 eV (or from 444 to 363 nm). The positiveΔA in the higher probe photon energy range is due either to the excited-state absorption (ESA) or to the intermediate/product-state absorption (PSA) process. The negative ΔA in the lower probe photon energy range can only be due to the ground-state bleaching (GSB), because the fluorescence spectrum of PYP46
is outside of our probe spectral range. The black line shows the position where the absorbance changeΔA is equal to 0. The curve shows the zero ΔA moving to the shorter wavelength (high photon energy) as the pump− probe delay increases. The loss rate of the electronic transition energy withΔA = 0 was calculated as about 25 meV/ps (=202 cm−1/ps) based on the curve.
We can discuss the above-mentioned energy relaxation more precisely by using thefirst moment of the induced absorption band of difference absorption spectrum, ΔA(ω), integrated
over the spectral range of the induced absorption band as in the following equation.
∫
ω ω ω∫
ω ω ϖ = Δ · Δ ω ω ω ω A( ) d / A( ) d t 1 2 1 2 (1)In the moment calculation, we used the integration range fromℏω1toℏω2corresponding to 3.1−3.4 eV, respectively, of
the probe photon energy. The calculated time trace and its FT power spectrum are shown in Figure 3, where the insetfigure
shows the time trace. From the results, we can conclude that the mode that contributes most to the energy loss is the 533 cm−1mode. The decay rate of the electronic transition energy can be estimated from the inset of Figure 3. The rate is determined to be about 5 meV/ps (=40 cm−1/ps) based on the slope. This means that if the relaxation occurs only through the mode with 533 cm−1, having the period of 629 fs, then the mean electronic energy is reduced by 25 (=40 × 629/1000) cm−1corresponding to 0.05 (=25/533) quanta of the 533 cm−1 mode. In other words, for the mean energy decay by one quant of the vibrational mode, it takes 20 vibrational periods corresponding to 12.6 ps.
The value of 5 meV/ps (=40 cm−1/ps) is much slower than the one obtained by the zero-crossing probe energy ofΔA. This can be explained as follows. The zero-crossing point is the point where the positive signal due to ESA and the negative signal due to GSB cancel each other. The excited state decays faster than the bleaching recovery due to some intermediates or triplet state before full recovery of the ground state. It then causes more negative signals around this point, which results in moving into the bleach side and showing the blue shift. Thus, the apparent energy shift is faster than thefirst moment shift in the strong absorption range. The difference of the shift rate appeared because thefirst moment is much less affected by the negative signal, due to absorption bleaching in the strong absorption range. The spectral regions of bleaching correspond to the stationary absorption spectrum and spontaneous fluorescence spectrum, respectively.
Other than GSB, ESA, and PSA, there can be signal contributions from a radical generated by the photoionization process and from ground state intermediates, as was reported by Larsen and van Grondelle.47,48Their report showed that the signal of the radical and that of the ground state intermediates appear in the probe wavelength regions 340−370 and 430−500
Figure 2.The two-dimensional difference absorption spectrum plotted against the pump−probe delay time in the probe range from 2.79 to 3.41 eV.
Figure 3.The calculated real-time trace of thefirst moment of the induced absorption band of difference absorption spectrum, ΔA(ω), in the range 3.1−3.4 eV of probe photon energy (inset figure) and its FT power spectrum (mainfigure).
nm, respectively. However, the probe wavelength in the present work is from 360 to 440 nm. Therefore, these signal contributions are not effective in most of the probe spectral region, except for the longer and shorter wavelength edges.
Real-Time Traces and Their Fourier Transform. Figure 4 shows several real-time traces probed at 2.85, 2.95, 3.05, 3.20, and 3.30 eV (corresponding to the wavelengths of 435, 420, 406, 388, and 376 nm, respectively). All the traces in Figure 4 show a slow intensity change due to electronic relaxation and a fast oscillatory structure due to molecular vibrations. The corresponding Fourier amplitude spectra calculated from 50 to 2300 fs are also shown in Figure 4. The data in the range 0−50 fs delay were affected by the scattered pump pulse. Therefore, they were deleted to increase the reliability of the Fourier amplitude result. From the results, we can evaluate the contribution of the modes to the modulation of electronic transition, which indicates the vibronic coupling strengths of the modes.
Figure 5 shows the real-time difference absorption spectra from 200 to 2200 fs with a step of 200 fs. There is an isosbestic point at 2.98 eV (or 416.5 nm) where the real-time difference absorption spectra curves cross each other. This crossing point is the wavelength where the absorbance of the two species of excited states and/or intermediates is equal. It also indicates
that this is a serial process without any parallel paths. The real-time difference absorption spectra between 2.98 and 3.15 eV show a blue shift. The spectral range from 3.15 to 3.41 eV is expected to be unaffected by the contribution of negative ΔA due to bleaching, since it is considered to be relatively small from the weak absorption in the range, as shown in Figure 1. Then, the signal is dominated by the ESA process in this spectral range.
Time-Resolved Spectrum. To determine the electronic relaxation time constants, the globalfitting of the observed ΔA traces was performed using the following exponential functions with two exponents ofτ1andτ2(τ1<τ2).
λ λ λ λ
ΔA( , )t = ΔA1( )e−t/τ1+ ΔA2( )e−t/τ2+ ΔA3( )
(2)
Here,fitting was made using the data of delay longer than 100 fs on the smoothed time-resolved spectrum to eliminate the strong artificial structures due to the interference near zero delay time. The two lifetime constants obtained by the global fitting were τ1 = 560 ± 20 fs and τ2 = 3.1 ± 0.2 ps. The
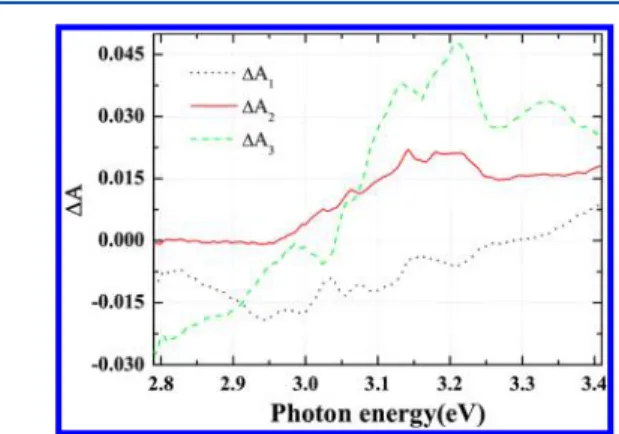
obtained time constants are comparable with the lifetimes reported as 0.7 and 3.6 ps using a 200 fs probe pulse in the visible spectral region.10The slight difference of the obtained time constants is thought to result from the difference of the probe wavelength region of the previous work (430−550 nm)10 and the present work (360−440 nm). The spectra of ΔA1(λ),
ΔA2(λ), and ΔA3(λ) or decay-associated difference spectra
(DADS) were also obtained by the global-fitting analysis simultaneously, as shown in Figure 6. The spectrum ofΔA2(λ) shows a positive value which indicates an ESA spectrum from 2.79 to 3.41 eV. This is comparable to Figure 4b. The spectrum of ΔA3(λ) is the difference spectrum of the long life
intermediate state minus that of the ground state and/or the product state minus the ground state. This can be calculated by theΔA2(λ) and the absorbance spectrum reflecting the ground state bleach spectrum.
Raman and Raman-Like Interactions. Figure 7b shows the two-dimensional Fourier transform (FT) amplitude spectrum of the time-resolved data in Figure 2 with the vibrational frequency range between 0 and 1800 cm−1. Hereafter, the probe photon energy dependence of the vibrational amplitude of each mode frequency is named as
Figure 4.Several real-time traces and their FT amplitudes at 2.85, 2.95, 3.05, 3.20, and 3.30 eV probe photon energies.
Figure 5. Time-resolved difference absorption spectra from 200 to 2200 fs with a step of 200 fs.
the vibrational amplitude spectrum (VAS). There was no vibrational signal when only the buffer was used as a sample in the experiment. Therefore, all the vibrational signals in the two-dimensional FT spectrum are due to the vibrational modes of PYP. The weight centers of the VASs in the ranges of 2.85− 3.075 and 3.075−3.35 eV were calculated for several intense
modes with frequencies of 1569, 1286, 1151, and 823 cm−1. To minimize the possible error in the determination of the peak frequencies of these modes at both the higher and lower frequency sides of the central bleaching band, the peak positions were defined by the first moment given by
∫
ω ω ω∫
ω ω ϖ =ν · ω ω ν ω ω ν F( ) d / F( ) d 1 2 1 2 (3)Here, Fν(w) is the probe photon frequency (ω) dependent FT
amplitude spectra of the vibrational modes with a frequency of ων.
The traces of the time-resolved absorption spectroscopy reflect the electronic transition probability. The transition probability can be affected by the wave packet motion in the electronic states oscillating in the period of the molecular vibration frequencies. The wave packet can be generated either via the simultaneous coherent excitation of the vibronic polarization of several vibration levels in the excited state or via impulsive stimulated Raman scattering in the ground state. The former case, a split excited state, and the latter case, a split ground state, are represented in terms of V-type and Λ-type interaction, respectively. Thus, Fourier power spectra of the absorption change traces modulated by the wave packet show peaks at the molecular vibration frequencies of the excited state and those of the ground state. The probe photon energy dependency of each peak shows a line around 0−0 transition energy with a slope of−1 or +1 whose detailed mechanism can be found in ref 49. The calculated results were displayed in Figure 7b as dots, which are linearlyfitted by red lines for both the higher and lower probe photon energy of 2.85−3.075 and 3.075−3.35 eV, respectively. The slopes of the two lines were calculated to be 0.97± 0.1 and −1.10 ± 0.1 for the two probe photon energy ranges. That is to say, the distributions of the vibrational modes at both the higher and the lower energy sides are linearly dependent on their own vibrational frequencies. Their slopes are very close to±1, which indicates that they are nearly symmetric with respect to some center line.49,50 This means that the vibration corresponds to the energy exchange between the probe laser photons and molecular vibrations, as was discussed and explained through the Λ-type Raman interaction and the V-type Raman-like interaction in our previous papers.49,50However, it seemed strange that the signal intensity at the central band was not as intense as at the sidebands; in fact, the vibrational signal vanished in this spectral range. Why did the signal disappear in the center and those at the sidebands disperse linearly? This can be explained in terms of destructive interference between the signal driven coherently with anti-Stokes and that with Stokes in the Raman and/or Raman-like process.51
Fourier transformation of the time-dependent absorbance (real-time traces) integrated over the probe photon energies region from 2.83 to 3.36 eV was calculated to improve the signal-to-noise ratio, as shown in Figure 7c as a red solid curve. The black dotted curve in thisfigure is the data obtained with theflowing glass cell.42Both experiments show nearly the same vibrational modes. These modes overlap with each other very well in frequency. Only small deviations appear in the intensity distribution. These properties also prove the good repeatability of the experiment. For the convenience of the discussion, we separate the figure into three parts based on the normalized amplitude of the modes. For the three parts I, II, and III, the normalized amplitudes A are in the region A > 0.4, 0.4 > A > 0.2, and 0.2 > A >0.1, respectively. Three tables according to
Figure 6.Spectral shapes of the three lifetime components obtained by the globalfitting method.
Figure 7.(a) The intensity distribution of the pump photon energy absorbed by the sample called absorbed laser spectrum, (b) two-dimensional contour map of FT amplitude spectra of the pump−probe signal over the probe photon energy. Red solid lines combine the centers of masses of the FT amplitude spectra defined as the probe photon energy dependence of Fourier amplitude for several main vibrational modes. (c) Fourier amplitude spectrum of the integrated real-time traces in the probe range from 2.83 to 3.36 eV. Red solid curve: The data obtained for the sample with moving glass cell. Dotted curve: The data obtained for the sample with aflowing cell.
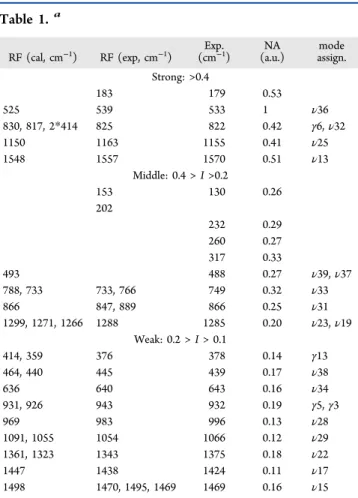
parts I, II, and III are used to compare the modes measured in this experiment to those by the calculated and measured Raman spectra,52,53as shown in Table 1.
Five intense vibrational modes are observed in the part I amplitude region. These modes have frequencies of 179, 533, 822, 1155, and 1570 cm−1. The most intense one is 533 cm−1 corresponding to the vibrational modeν36.52The strong low frequency mode at 179 cm−1observed in real time is assigned to in-plane skeleton-bending mode ν42.54 When a 0.5-mm-thickflowing cell was used, weak low vibrational modes at 203 cm−1 were observed. The large difference in low frequency modes may be due to the higher sensitivity of low frequency modes to the protein environment in contrast to high frequency modes. The highest peak at 1570 cm−1 out of the five frequency modes shows about 13 cm−1difference from the
Raman frequency of 1557 cm−1.52The 1155 cm−1vibrational mode shows a wavelength dependence which will be discussed in detail in the following section. The 822 cm−1 mode is assigned as the modeν32.52The width of the vibrational mode is about 24 cm−1, corresponding to the vibrational dephasing time of about 550 fs.
In the part II region, several low vibrational modes at 130, 232, 260, and 317 cm−1 were not reported in previous works52,53on the Raman spectrum of PYP and were observed only in this real-time spectrum. The 130 cm−1 mode is a coherent motion assigned to an out-of-plane bending mode of the chromophore and supposed to start theflip of the thioester bond along a barrierless isomerization pathway.46,55 The four
modes at 488, 749, 866, and 1285 cm−1were observed in every experiment offive runs.
In the part III region, although the amplitudes of these modes are low in this region, several modes were very clearly observed in every experiment offive runs. The frequencies of the modes are 439, 932, 1066, 1375, and 1469 cm−1. Table 1 shows the frequencies mode assignments and normalized amplitudes of FT of the real-time spectrum of PYP obtained by the present experiment (from the integrated amplitude probed in the range 2.83−3.35 eV) and the frequencies reported in Raman spectroscopy.52
Wave Packets in the Ground State and in the Excited State. The peak intensity of the vibrational mode around 1155 cm−1is shown in Figure 8a. Interestingly, we found that the vibrational mode around 1155 cm−1 in the two-dimensional spectrum does not show a single line parallel to the abscissa but is slightly bent with the probe photon energy, as shown in Figure 7b. Figure 8b also shows the frequency of the mode at each probe photon energy value calculated by thefirst moment Table 1.a RF (cal, cm−1) RF (exp, cm−1) Exp. (cm−1) NA (a.u.) mode assign. Strong: >0.4 183 179 0.53 525 539 533 1 ν36 830, 817, 2*414 825 822 0.42 γ6, ν32 1150 1163 1155 0.41 ν25 1548 1557 1570 0.51 ν13 Middle: 0.4 > I >0.2 153 130 0.26 202 232 0.29 260 0.27 317 0.33 493 488 0.27 ν39, ν37 788, 733 733, 766 749 0.32 ν33 866 847, 889 866 0.25 ν31 1299, 1271, 1266 1288 1285 0.20 ν23, ν19 Weak: 0.2 > I > 0.1 414, 359 376 378 0.14 γ13 464, 440 445 439 0.17 ν38 636 640 643 0.16 ν34 931, 926 943 932 0.19 γ5, γ3 969 983 996 0.13 ν28 1091, 1055 1054 1066 0.12 ν29 1361, 1323 1343 1375 0.18 ν22 1447 1438 1424 0.11 ν17 1498 1470, 1495, 1469 1469 0.16 ν15
aRF, raman frequency; Exp., vibrational modes measured in the
experiment; NA, normalized amplitude of every measured mode; mode assign., mode assignment.
Figure 8.(a) The peak intensity of the vibrational mode around 1155 cm−1. The frequency (b) and phase (c) of the 1155 cm−1 at each probe photon energy calculated by afirst moment of the vibrational mode spectrum in the frequency range from 1120 to 1180 cm−1.
in the frequency range from 1120 to 1180 cm−1. As we can see, the frequency is 1155 ± 1 cm−1in the probe photon energy range 2.95−3.05 eV, where ΔA is negative, and the mode frequency is 1149± 1 cm−1in the range 3.15−3.35 eV, where ΔA has mainly positive values. The phase of the vibrational mode is also shown in Figure 8c. The phases are (−0.48 ± 0.15)π and (−0.97 ± 0.10)π for the ranges 2.95−3.05 and 3.15−3.35 eV, respectively. The range 3.05−3.15 eV was not used because the vibrational amplitudes in this range are too small to determine the frequency precisely. The data of the ranges of >3.35 eV are not used because of the weak probe light intensity at the edges of the probe spectrum. The frequency and the phase data of the ranges of 2.85−2.95 eV are complex, which may be due to some other unclear process.
The modulation of time-resolved difference absorbance is the result of the contributions of wave packet motions on the potential surfaces of both the electronic ground state and the excited state. The ground-state wave packet starts its motion from its stable local minimum point in the ground state potential energy surface relevant to the specific vibrational mode among many other coupled modes, whereas the excited state wave packet starts its motion from the Franck−Condon point toward a local minimum point in the excited-state potential energy surface. Therefore, the vibrations of the wave packet along the potential surfaces of the ground state and the excited state are expected to be sine-like and cosine-like, respectively. The sign of the signal also helps to assign the origin of the signal as follows: a negative absorbance change shows photobleaching caused by depletion of the electronic ground state or stimulated emission from the excited state; on the other hand, a positive absorbance change shows induced absorption from thefirst excited state to a higher excited state. Thus, from the initial phases of the vibration and the signs of the difference absorbance, it can be safely concluded that the frequencies of 1155 and 1149 cm−1are due to the ground state and the excited state, respectively. Meanwhile, we did notfind probe photon energy dependence for the Skelton mode around 1600 cm−1and the dominant mode of 533 cm−1being assigned to the vibration modes in the ground state. The frequency difference of the mode by 6 cm−1 can be explained in the following way. The mode is assigned toν25ring bendδCH.19,52 The frequency of the experimentally observed Raman mode which seems to correspond to this mode is reported to be 116419or 1165 cm−1.18The calculated values extend from 1142 to 1207 cm−1, depending on the calculation methods, including the density functional theory (DFT) and vibrational self-consistentfield method (VSCF).52
On the basis of a theoretical study19 and experimental results,17,56 the following lines discuss the reaction of PYP. There have been at least two possible models19 for the formation of the first intermediate of the photocycle of PYP named PYPL: (i) thefirst model is the photoisomerization of
the chromophore by rotating the aromatic ring; (ii) the second model involves rotation of the carbonyl group to form a cis chromophore in PYPL.17,56The isomerization is associated with the reduction of bond order of the C7C8 bond (Figure 1) which results in the change of the benzene ring from benzenoid form to quinoid form. The bond lengths of C2C3 and C5 C6 are reduced and all other CC bonds are stretched, resulting in the change in the displacement of the stable position of the C1C2C3 angle, inducing the ring bend δCH mode activation. Because of the increment of bond order of the C2C3 and C5C6 bonds, namely, electron densities
along the bonds after excitation, the bond order of the CH bonds of the benzene ring decreases at the C3 and C5 positions. Then, the frequency of the ringδCH mode will be reduced and this is exactly what the experimental observation shows.
In this way, we could detect the change after excitation in the bond strength, which indicates the primary molecular structure change associated with the isomerization process, which is the primary process in the photocycle in PYP.
■
CONCLUSIONSIn conclusion, ultrafast spectroscopy with a broad-band detection system and ultrashort UV laser was used to study the relation between the electronic relaxation and vibrational dynamics of PYP. From the novel observation of the vibrational mode around 1155 cm−1, vibrational modes in the probe spectral ranges of 2.95−3.05 and 3.15−3.35 eV were attributed to the wave packets in the ground state and the excited state, respectively. The frequencies in the ground state and excited state are determined to be 1155 ± 1 and 1149 ± 1 cm−1, respectively. The frequency change after excitation means a reduction in the bond strength, which can be explained in terms of the primary molecular structure change afterπ−π* excitation initiating the isomerization, which is the primary process in the photocycle in PYP.
■
AUTHOR INFORMATIONCorresponding Author
*E-mail: [email protected].
Notes
The authors declare no competingfinancial interest.
■
ACKNOWLEDGMENTSThis work was supported by the Core Research for Evolutional Science and Technology (CREST) program of the Japan Science and Technology Agency (JST), the National Science Council of the Republic of China, Taiwan (NSC 98-2112-M-009-001-MY3), and a grant from the Ministry of Education, Aiming for Top University (MOE ATU) Program at National Chiao-Tung University (NCTU). A part of this work was performed under the joint research project of the Institute of Laser Engineering, Osaka University, under Contract No. A3-01. It was also supported by the Chinese Academy of Sciences visiting professorship for senior international scientist Grant No. 2011T2G06. J.L. gratefully acknowledges the support of the National Natural Science Foundation of China (NSFC) (grants 61178006 and 11274327), Shanghai Pujiang Program (12PJ1409300), and the Recruitment Program of Global Experts.
■
REFERENCES(1) Meyer, T. E.; Yakali, E.; Cusanovich, M. A.; Tollin, G. Properties of a Water-Soluble, Yellow Protein Isolated from a Halophilic Phototrophic Bacterium That Has Photochemical Activity Analogous to Sensory Rhodopsin. Biochemistry 1987, 26, 418−423.
(2) Hoff, W. D.; Düx, P.; Hård, K.; Devreese, B.; Nugteren-Roodzant, I. M.; Crielaard, W.; Boelens, R.; Kaptein, R.; van Beeumen, J.; Hellingwerf, K. J. Thiol Ester-Linked p-Coumaric Acid as a New Photoactive Prosthetic Group in a Protein with Rhodopsin-Like Photochemistry. Biochemistry 1994, 33, 13959−13962.
(3) Baca, M.; Borgstahl, G. E. O.; Boissinot, M.; Burke, P. M.; Williams, D. R.; Slater, K. A.; Getzoff, E. D. Complete Chemical Structure of Photoactive Yellow Protein: Novel Thioester Linked
4-Hydroxycinnamyl Chromophore and Photocycle Chemistry. Biochem-istry 1994, 33, 14369−14377.
(4) Hellingwerf, K. J.; Hendriks, J.; Gensch, T. Photoactive Yellow Protein, a New Type of Photoreceptor Protein: Will This“Yellow Lab” Bring Us Where We Want to Go? J. Phys. Chem. A 2003, 107, 1082− 1094.
(5) Meyer, T. E. Isolation and Characterization of Soluble Cytochromes, Ferredoxins and Other Chromophoric Proteins from the Halophilic Phototrophic Bacterium Ectothiorhodospira Halophila. Biochim. Biophys. Acta 1985, 806, 175−183.
(6) Devanathan, S.; Pacheco, A.; Ujj, L.; Cusanovich, M.; Tollin, G.; Lin, S.; Woodbury, N. Femtosecond Spectroscopic Observations of Initial Intermediates in the Photocycle of the Photoactive Yellow Protein from Ectothiorhodospira Halophila. Biophys. J. 1999, 77, 1017−1023.
(7) Meyer, T. E.; Tollin, G.; Hazzard, J. H.; Cusanovich, M. A. Photoactive Yellow Protein from the Purple Phototrophic Bacterium, Ectothiorhodospira Halophila. Quantum Yield of Photobleaching and Effects of Temperature, Alcohols, Glycerol, and Sucrose on Kinetics of Photobleaching and Recovery. Biophys. J. 1989, 56, 559−564.
(8) Thompson, M. J; Bashford, D.; Noodleman, L.; Getzoff, E. D. Photoisomerization and Proton Transfer in Photoactive Yellow Protein. J. Am. Chem. Soc. 2003, 125, 8186−8194.
(9) Imamoto, Y.; Kataoka, M.; Tokunaga, F. Photoreaction Cycle of Photoactive Yellow Protein from Ectothiorhodospira Halophila Studied by Low-Temperature Spectroscopy. Biochemistry 1996, 35, 14047−14053.
(10) Baltuška, A.; Stokkum, I. H. M.; van Kroon, A.; Monshouwer, R.; Hellingwerf, K. J.; van Grondelle, R. The Primary Events in the Photoactivation of Yellow Protein. Chem. Phys. Lett. 1997, 270, 263− 266.
(11) Changenet, P.; Zhang, H.; van der Meer, M. J.; Hellingwerf, K. J.; Glasbeek, M. Subpicosecond Fluorescence Upconversion Measure-ments of Primary Events in Yellow Proteins. Chem. Phys. Lett. 1998, 282, 276−282.
(12) Ujj, L.; Devanathan, S.; Meyer, T. E.; Cusanovich, M. A.; Tollin, G.; Atkinson, G. H. New Photocycle Intermediates in the Photoactive Yellow Protein from Ectothiorhodospira Halophila: Picosecond Transient Absorption Spectroscopy. Biophys. J. 1998, 75, 406−412.
(13) Pan, D.; Philip, A.; Pan, D.; Philip, A.; Hoff, W. D.; Mathies, R. A. Time-Resolved Resonance Raman Structural Studies of the pB2 Intermediate in the Photocycle of Photoactive Yellow Protein. Biophys. J. 2004, 86, 2374−2382.
(14) Genick, U. K.; Borgstahl, G. E.; Ng, K.; Ren, Z.; Pradervand, C.; Burke, P. M.; Šrajer, V.; Teng, T. Y.; Schildkamp, W.; McRee, D. E.; Moffat, K.; Getzoff, E. D. Structure of a Protein Photocycle Intermediate by Millisecond Time-Resolved Crystallography. Science 1997, 275, 1471−1475.
(15) Genick, U. K.; Soltis, S. M.; Kuhn, P.; Canestrelli, I. L.; Getzoff, E. D. Structure at 0.85 Å Resolution of an Early Protein Photocycle Intermediate. Nature 1998, 392, 206−209.
(16) Ren, Z.; Perman, B.; Srajer, V.; Teng, T. Y.; Pradervand, C.; Bourgeois, D.; Schotte, F.; Ursby, T.; Kort, R.; Wulff, M.; Moffat, K. A Molecular Movie at 1.8 Å Resolution Displays the Photocycle of Photoactive Yellow Protein, an Eubacterial Blue-Light Receptor, from Nanoseconds to Seconds. Biochemistry 2001, 40, 13788−13801.
(17) Brudler, R.; Rammelsberg, R.; Woo, T. T.; Getzoff, E. D.; Gerwert, K. Structure of the I1 Early Intermediate of Photoactive Yellow Protein by FTIR Spectroscopy. Nat. Struct. Biol. 2001, 8, 265− 270.
(18) Imamoto, Y.; Shirahige, Y.; Tokunaga, F.; Kinoshita, T.; Yoshihara, K.; Kataoka, M. Low-Temperature Fourier Transform Infrared Spectroscopy of Photoactive Yellow Protein. Biochemistry 2001, 40, 8997−9004.
(19) Unno, M.; Kumauchi, M.; Sasaki, J.; Tokunaga, F.; Yamauchi, S. Resonance Raman Spectroscopy and Quantum Chemical Calculations Reveal Structural Changes in the Active Site of Photoactive Yellow Protein. Biochemistry 2002, 41, 5668−5674.
(20) Unno, M.; Kumauchi, M.; Sasaki, J.; Tokunaga, F.; Yamauchi, S. Assignment of Resonance Raman Spectrum of Photoactive Yellow Protein in Its Long-Lived Blue-Shifted Intermediate. J. Phys. Chem. B 2003, 107, 2837−2845.
(21) Borgstahl, G. E. O.; Williams, D. R.; Getzoff, E. D. 1.4 Å Structure of Photoactive Yellow Protein, a Cytosolic Photoreceptor: Unusual Fold, Active Site and Chromophore. Biochemistry 1995, 34, 6278−6287.
(22) Kim, M.; Mathies, R. A; Hoff, W. D.; Hellingwerf, K. J. Resonance Raman Evidence that the Thioester-Linked 4-Hydrox-ycinnamyl Chromophore of Photoactive Yellow Protein Is Deproto-nated. Biochemistry 1995, 34, 12669−12672.
(23) Getzoff, E. D.; Gutwin, K. N.; Genick, U. K. Anticipatory Active-Site Motions and Chromophore Distortion Prime Photoreceptor PYP for Light Activation. Nat. Struct. Biol. 2003, 10, 663−668.
(24) Xie, A.; Hoff, W. D.; Kroon, A. R.; Hellingwerf, K. J. Glu46 Donates a Proton to the 4-Hydroxycinnamate Anion Chromophore During the Photocycle of Photoactive Yellow Protein. Biochemistry 1996, 35, 14671−14678.
(25) Kort, R.; Hellingwerf, K. J.; Ravelli, R. B. Initial Events in the Photocycle of Photoactive Yellow Protein. J. Biol. Chem. 2004, 279, 26417−26424.
(26) Heyne, K.; Mohammed, O. F.; Usman, A.; Dreyer, J.; Nibbering, E. T.; Cusanovich, M. A. Structural Evolution of the Chromophore in the Primary Stages of Trans/Cis Isomerization in Photoactive Yellow Protein. J. Am. Chem. Soc. 2005, 127, 18100−18106.
(27) Groot, M. L.; van Wilderen, L. J.; Larsen, D. S.; van der Horst, M. A.; van Stokkum, I. H.; Hellingwerf, K. J; van Grondelle, R. Initial Steps of Signal Generation in Photoactive Yellow Protein Revealed with Femtosecond Mid-Infrared Spectroscopy. Biochemistry 2003, 42, 10054−10059.
(28) Larsen, D. S.; Mikas, V.; van Stokkum, I. H.M.; van der Horst, M. A.; Cordfunke, R. A.; Hellingwerf, K. J.; van Grondelle, R. Initial Photo-Induced Dynamics of the Photoactive Yellow Protein Chromophore in Solution. Chem. Phys. Lett. 2003, 369, 563−569.
(29) Thompson, M. J.; Bashford, D.; Noodleman, L.; Getzoff, E D. Photoisomerization and Proton Transfer in Photoactive Yellow Protein. J. Am. Chem. Soc. 2003, 125, 8186−8194.
(30) Imamoto, Y.; Kataoka, M.; Tokunaga, F.; Asahi, T.; Masuhara, H. Photoisomerization and Proton Transfer in Photoactive Yellow Protein. Biochemistry 2001, 40, 6047−6052.
(31) Changenet-Barret, P.; Plaza, P.; Martin, M. M. Primary Events in the Photoactive Yellow Protein Chromophore in Solution. Chem. Phys. Lett. 2001, 336, 439−444.
(32) Groenhof, G.; Bouxin-Cademartory, M.; Hess, B.; de Visser, S.; Brendendsen, H.; Olivucci, M.; Mark, A. E.; Robb, M. A. Why Photon Absorption Triggers Isomerization of the Chromophore in Photo-active Yellow Protein. J. Am. Chem. Soc. 2004, 126, 4228−4233.
(33) Chosrowjan, H.; Mataga, N.; Nakashima, N.; Imamoto, Y.; Tokunaga, F. Femtosecond-Picosecond Fluorescence Studies on Excited State Dynamics of Photoactive Yellow Protein from Ectothiorhodospira Halophila. Chem. Phys. Lett. 1997, 270, 267−272. (34) Mataga, N.; Chosrowjan, H.; Taniguchi, S.; Hamada, N.; Tokunaga, F.; Imamoto, Y.; Kataoka, M. Ultrafast Photoreactions in Protein Nanospaces as Revealed by Femtosecond Fluorescence Dynamics Measurements on Photoactive Yellow Protein and Related Systems. Phys. Chem. Chem. Phys. 2003, 5, 2454−2460.
(35) Hoff, W. D.; van Stokkum, I. H. M.; van Ramesdonk, H. J.; van Brederode, M. E.; Brouwer, A. M.; Fitch, J. C.; Meyer, T. E.; van Grondelle, R.; Hellingwerf, K. J. Measurement and Global Analysis of the Absorbance Changes in the Photocycle of the Photoactive Yellow Protein from Ectothiorhodospira Halophila. Biophys. J. 1994, 67, 1691−1705.
(36) Usman, A.; Mohammed, O. F.; Heyne, K.; Dreyer, J.; Nibbering, E. T. J. Excited State Dynamics of a PYP Chromophore Model System Explored with Ultrafast Infrared Spectroscopy. Chem. Phys. Lett. 2005, 401, 157−163.
(37) Zhou, Y.; Ujj, L.; Meyer, T. E.; Cusanovich, M. A.; Atkinson, G. H. Photocycle Dynamics and Vibrational Spectroscopy of the E46Q
Mutant of Photoactive Yellow Protein. J. Phys. Chem. A 2001, 105, 5719−5726.
(38) Premvardhan, L. L.; Buda, F.; van der Horst, M. A.; Luehrs, D.; Hellingwerf, K. J.; van Grondelle, R. The Impact of Photon Absorption on the Electronic Properties of p-Coumaric Acid Derivatives of the Photoactive Yellow Protein Chromophore. J. Phys. Chem. B 2004, 108, 5138−5148.
(39) Devanathan, S.; Lin, S.; Cusanovich, M. A.; Woodbury, N.; Tollin, G. Early Photocycle Kinetic Behavior of the E46A and the Y42F Mutants of Photoactive Yellow Protein. Biophys. J. 2001, 81, 2314−2319.
(40) Changenet-Barret, P.; Espagne, A.; Katsonis, N.; Charier, S.; Baudin, J.-B.; Jullien, L.; Plaza, P.; Martin, M. M. Excited-State Relaxation Dynamics of a PYP Chromophore Model in Solution: Influence of the Thioester Group. Chem. Phys. Lett. 2002, 365, 285− 291.
(41) Shimizu, N.; Kamikubo, H.; Yamazaki, Y.; Imamoto, Y.; Kataoka, M. The Crystal Structure of the R52Q Mutant Demonstrates a Role for R52 in Chromophore pKa Regulation in Photoactive Yellow Protein. Biochemistry 2006, 45, 3542−3547.
(42) Liu, J.; Okamura, K.; Kida, Y.; Teramoto, T.; Kobayashi, T. Clean Sub-8-fs Pulses at 400 nm Generated by a Hollow Fiber Compressor for Ultraviolet Ultrafast Pump-Probe Spectroscopy. Opt. Express 2010, 18, 20645−20650.
(43) Liu, J.; Kida, Y.; Teramoto, T.; Kobayashi, T. Generation of Stable Sub-10 fs Pulses at 400 nm in a Hollow Fiber for UV Pump-Probe Experiment. Opt. Express 2010, 18, 4665−4672.
(44) Iwakura, I.; Kobayashi, T.; Yabushita, A. Direct Observation of Molecular Structural Change during Intersystem Crossing by Real-Time Spectroscopy with a Few Optical Cycle Laser. Inorg. Chem. 2009, 48, 3523−3528.
(45) Iwakura, I.; Yabushita, A.; Kobayashi, T. Transition States and Nonlinear Excitations in Chloroform Observed with a Sub-5 fs Pulse Laser. J. Am. Chem. Soc. 2009, 131, 688−696.
(46) Nakamura, R.; Hamada, N.; Ichida, H.; Tokunaga, F.; Kanematsu, Y. Coherent Oscillations in Ultrafast Fluorescence of Photoactive Yellow Protein. J. Chem. Phys. 2007, 127, 215102.
(47) Larsen, D. S.; van Grondelle, R. Initial Photoinduced Dynamics of the Photoactive Yellow Protein. ChemPhysChem 2005, 6, 828−837. (48) Larsen, D. S.; van Stokkum, I. H.; van Grondelle, R. Incoherent Manipulation of the Photoactive Yellow Protein Photocycle with Dispersed Pump-Dump-Probe Spectroscopy. Biophys. J. 2004, 87, 1858−1872.
(49) Ishii, N.; Tokunaga, E.; Adachi, S.; Kimura, T.; Matsuda, H.; Kobayashi, T. Optical Frequency and Vibrational Time-Resolved Two-Dimensional Spectroscopy by Real-Time Impulsive Resonant Coherent Raman Scattering in Polydiacetylene. Phys. Rev. A 2004, 7 (0023811), 1−7.
(50) Du, J.; Nakata, K.; Jiang, Y.; Tokunaga, E.; Kobayashi, T. Spectral Modulation Observed in Chl-a by Ultrafast Laser Spectros-copy. Opt. Express 2011, 19, 22480−22485.
(51) Du, J.; Teramoto, T.; Nakata, K.; Tokunaga, E.; Kobayashi, T. Real-Time Vibrational Dynamics in Chlorophyll a Studied with a Few-Cycle Pulse Laser. Biophys. J. 2011, 101, 995−1003.
(52) Unno, M.; Kumauchi, M.; Tokunaga, F.; Yamauchi, S. Vibrational Assignment of the 4-Hydroxycinnamyl Chromophore in Photoactive Yellow Protein. J. Phys. Chem. B 2007, 111, 2719−2726. (53) Adesokan, A. A.; Pan, D.; Fredj, E.; Mathies, R. A.; Gerber, R. B. Anharmonic Vibrational Calculations Modeling the Raman Spectra of Intermediates in the Photoactive Yellow Protein (PYP) Photocycle. J. Am. Chem. Soc. 2007, 129, 4584−4594.
(54) Chosrowjan, H.; Taniguchi, S.; Mataga, N.; Unno, M.; Yamauchi, S.; Hamada, N.; Kumauchi, M.; Tokunaga, F. Low-Frequency Vibrations and Their Role in Ultrafast Photoisomerization Reaction Dynamics of Photoactive Yellow Protein. J. Phys. Chem. B 2004, 108, 2686−2698.
(55) Mataga, N.; Chosrowjan, H.; Shibata, Y.; Imamoto, Y.; Kataoka, M.; Tokunaga, F. Ultrafast Photoinduced Reaction Dynamics of Photoactive Yellow Protein (PYP): Observation of Coherent
Oscillations in the Femtosecond Fluorescence Decay Dynamics. Chem. Phys. Lett. 2002, 352, 220−225.
(56) Xie, A.; Kelemen, L.; Hendriks, J.; White, B. J.; Hellingwerf, K. J.; Hoff, W. D. Formation of a New Buried Charge Drives a Large-amplitude Protein Quake in Photoreceptor Activation. Biochemistry 2001, 40, 1510−1517.