國立交通大學
機械工程學系
碩士論文
改變點火正時探討沼氣發電機燃燒穩定性及其
性能
The Experimental Study on Combustion
Stability and Performance of Biogas Power
Generation by Changing Spark Timing
研 究 生:吳凌宇
指導教授:陳俊勳 教授
改變點火正時探討沼氣發電機燃燒穩定性及其性能
The Experimental Study on Combustion Stability and Performance of Biogas Power Generation by Changing Spark Timing
研究生 :吳凌宇 Student:Lin-Yu Wu 指導教授:陳俊勳 Advisor:Chiun-Hsun Chen 國 立 交 通 大 學 機 械 工 程 學 系 碩 士 論 文 A Thesis
Submitted to Department of Mechanical Engineering College of Engineering
National Chiao Tung University In Partial Fulfillment of the Requirements
For the Degree of Master of Science In Mechanical Engineering
June 2012
Hsinchu, Taiwan, Republic of China
I 本論文在台中月眉台糖養豬場測試 30kW 沼氣發電機。研究計畫 其一,為了提高引擎效率,安裝除濕機以祛除沼氣中多餘的水分,此 外量測除濕後沼氣的確切成分及其相對應之濃度。計畫其二,安裝完 整之點火系統,包括火星塞式壓力感測器、旋轉編碼器及點火正時訊 號擷取。實驗結果顯示,在沼氣除濕後發電功率明顯提升;在沼氣供 給量為 220L/min 時,沼氣除濕後發電功率比未除濕之沼氣提高 5.9%。 本發電機最佳點火正時為 BTDC13 度,在此角度下操作引擎可以達 到最大之發電功率以及熱效率,同時其燃燒穩定性也較穩定(CoVIMEP 較小)。提前點火或延後點火,除了發電功率及熱效率下降以外,亦 使燃燒穩定性變差(CoVIMEP較大)。另外,實驗發現燃燒越穩定,沼 氣甲烷使用率越高,反之亦然。 關鍵字:沼氣發電、沼氣水氣、點火正時、燃燒穩定性
改變點火正時探討沼氣發電機燃燒穩定性及
其性能
學生:吳 凌 宇 指導教授:陳 俊 勳
國立交通大學機械工程學系
摘要
II
The Experimental Study on Combustion
Stability and Performance of Biogas Power
Generation by Changing Spark Timing
Student: Lin-Yu Wu Advisor: Prof.Chiun-Hsun Chen
Department of Mechanical Engineering National Chiao Tung University
ABSTRACT
This study tested a 30kW-generator in a small biogas plant in Taiwan Sugar swine farm in Taichung. The biogas after desulfurization process still contains the water vapor. Hence, it is necessary to remove the water vapor in the intake biogas before it is fueled into the engine. In this study, the first work is to dehumidify the water vapor in intake biogas. In addition to these, the detailed intake biogas constitutes and their concentrations are also measured in order to get the real data. Secondly, install a complete ignition system, consisting spark plugs pressure sensor and rotary encoder, to record the in-cylinder pressure and crank angle of piston cylinder. In the present study, the engine power output of dehumidified biogas provides up to 5.9% with respective to the humid biogas at biogas supply rate of 220L/min at excess air ratio λ=1. Besides, the optimum spark timing of present engine locates at BTDC13 degree, where supply the highest power generation and thermal efficiency.
III
Delaying or advancing the optimum spark timing leads to poorer power outputs. The spark timing of BTDC13 has lower coefficient of variation in indicated mean effective pressure (CoVIMEP) than delayed and
advanced ones, where engine performs more stable indicated mean effect pressure (IMEP) during combustion. In addition, it found that the lower CoVIMEP makes the higher CH4 consumption ratio.
Keywords: Biogas generation, Water vapor in biogas, Spark timing, Combustion stability
IV
Acknowledgements
感謝指導教授 陳俊勳教授,除了論文的指導以外您也教導我們 要對自己負責、尊師重道等看似基本卻是比什麼都重要的事情。感謝 宗翰學長在沼氣發電實驗過程中再三的指導,在實驗過程遇到困難時 懂得如何在危機中做出正確的判斷。感謝昶安學長和家維學長於研究 生生活中,適時地給我研究上協助以及建議。並感謝國科會計畫的經 費支持,使實驗能夠完成。 感謝同窗兩年的天洋、詠翔及鉦鈞,大家碩一時,一起奮鬥準備期 中、期末考的日子歷歷在目;碩二時,一起為實驗努力還不忘為對方 打氣。謝謝你們,有你們的陪伴,讓我在研究過程添加許多樂趣倍感 溫暖。感謝學弟妹 Austin、泰全、羿彣、子博、秉楷以及毓瑾,有你 們的陪伴及幫忙,研究室熱鬧許多。感謝畢業學姊聖容,在做實驗過 程中給予的建議。感謝朋友逸倫與文楷,在課暇之餘一起運動減輕我 壓力,說好的每天晨泳,並且謝謝你們在研究的路上給的鼓勵以及英 文的指導讓我順利完成論文。 感謝妹妹岱玲,你樂觀開朗的個性讓我在困難時跟你聊天感到溫暖 不已,現在你也要追求你的夢想,希望你一切順利。最後最要感謝我 的父母,謝謝您們在我求學道路上的支持、鼓勵、協助與栽培。時光 如梭,偶爾還是會想起第一天上小學時的情景,謝謝您們。V CONTENTS ABSTRACT(CHINESE) ... I ABSTRACT(ENGLISH) ... II CONTENTS ... III LIST OF TABLES ... V LIST OF FIGURES ... VII
Chapter 1 Introduction ... 1
1.1 Motivation and Background ... 1
1.2 Literature Review ... 4
1.3 Scope of Present Study ... 11
Chapter 2 Biogas Generation System ... 12
2.1 Process of Biogas Production ... 12
2.2 Utlization of Biogas ... 12
2.3 Engines ... 13
2.3.1 Four-stroke Gas Engine and Diesel Engine ... 14
2.3.2 Stirling Engine ... 15
2.3.3 Gas Turbine ... 15
2.3.4 Micro Gas Turbine ... 15
2.3.5 Fuel Cell ... 16
Chapter 3 Experimental Apparatus and Procedures ... 17
3.1 Experimental Equipment Layout ... 17
3.1.1 Engine ... 17
3.1.2 Air Flow Meter (VA-400) ... 19
3.1.3 Biogas Flow Meter (TF-4000) ... 20
3.1.4 Dehumidifier (RD15) ... 20 3.1.5 Temperature with Humidity Transmitter (JHTD3010-N)
VI
... 21
3.1.6 Gas Analyzer (ECA450) ... 21
3.1.7 Methane Concentration Analyzer (GuardCH4) ... 21
3.1.8 Spark Plug Pressure Sensor (BKR5E-11 and 112A05) . 21 3.1.9 Ignition System ... 22
3.1.9.1 Tachometer (VC4000DAQ) ... 23
3.1.9.2 Spark Plug Pressure Sensor (BKR5E-11 and 112A05)... 23
3.1.9.3 Charge Converter (PCB 422E05) ... 23
3.1.9.4 Rotary Encoder (HPN-6A) ... 23
3.2 The Theoretical Calculation ... 24
3.2.1 Excess Air Ratio ... 24
3.2.2 Consumption of CH4 ... 26
3.2.3 Thermal Efficiency ... 27
3.2.4 Combustion Stability ... 29
3.3 Dehumidifying Water Vapor of Intake Fuel ... 30
3.4 The Effect of Spark Timing ... 31
Chapter 4 Results and Discussion ... 33
4.1 Effect of Water Vapor of Intake Fuel ... 33
4.2 Addition of Ignition System ... 42
4.2.1 Power Generation, Thermal Efficiency and Waste Gas Analysis ... 42
4.2.2 In-cylinder Pressure Analysis ... 46
4.3 Comparison with Other Researches ... 53
Chapter 5 Conclusions and Recommendations ... 55
VII
5.2 Recommendations ... 56 Reference ... 58
VIII
LIST OF TABLES
Table 3.1 Engine Technical Data ... 19 Table 3.2 Specifications of the Data Acquisition Modules... 22 Table 4.1 Compositions of Biogas with and without Dehumidification
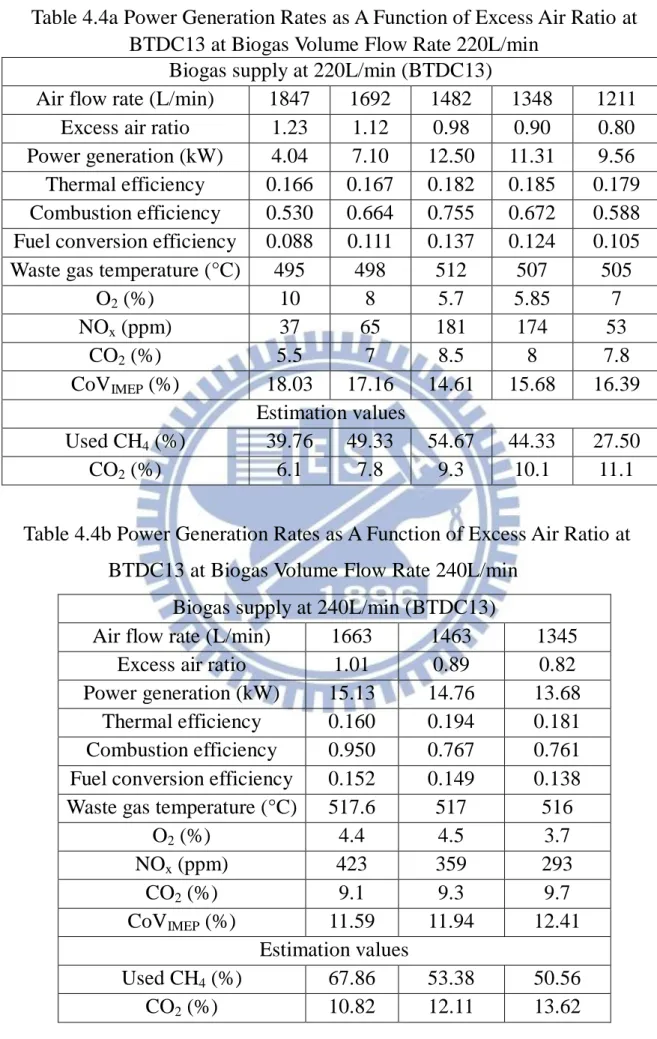
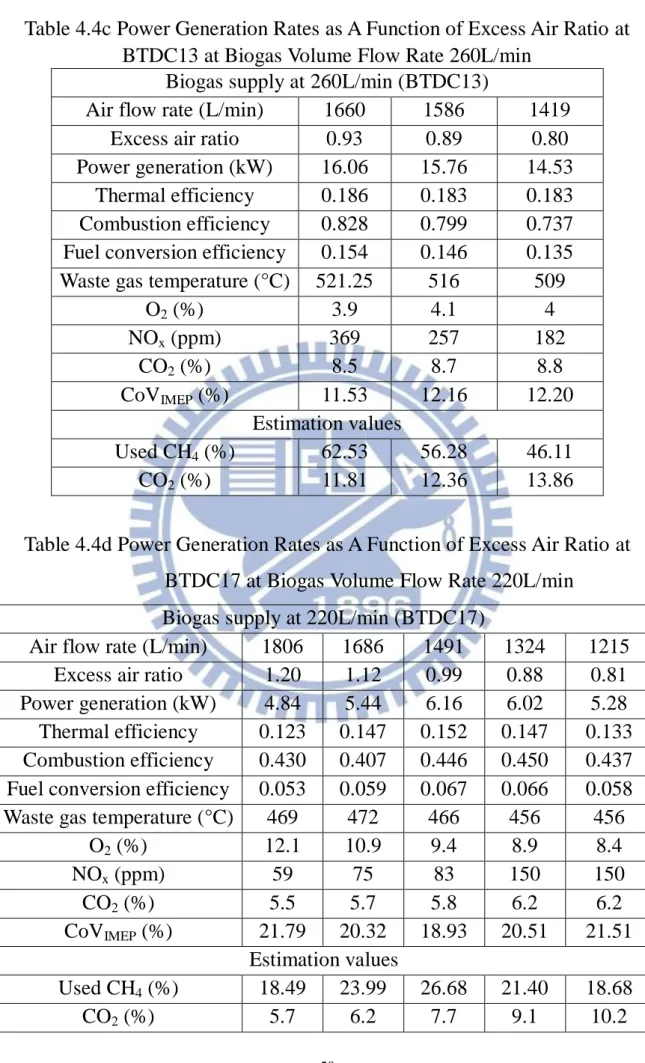
... 34 Table 4.2a Power Generation Rates as A Function of Excess Air Ratio without Dehumidification at Biogas Volume Flow Rate 200L/min ... 39 Table 4.2b Power Generation Rates as A Function of Excess Air Ratio with Dehumidification at Biogas Volume Flow Rate 200L/min ... 39 Table 4.2c Power Generation Rates as A Function of Excess Air Ratio without Dehumidification at Biogas Volume Flow Rate 220L/min ... 40 Table 4.2d Power Generation Rates as A Function of Excess Air Ratio with Dehumidification at Biogas Volume Flow Rate 220L/min ... 40 Table 4.2e Power Generation Rates as A Function of Excess Air Ratio without Dehumidification at Biogas Volume Flow Rate 240L/min ... 41 Table 4.2f Power Generation Rates as A Function of Excess Air Ratio with Dehumidification at Biogas Volume Flow Rate 240L/min ... 41 Table 4.3 Composition of Biogas with Dehumidification ... 42 Table 4.4a Power Generation Rates as A Function of Excess Air Ratio at BTDC13 at Biogas Volume Flow Rate 220L/min ... 49 Table 4.4b Power Generation Rates as A Function of Excess Air Ratio at BTDC13 at Biogas Volume Flow Rate 240L/min ... 49 Table 4.4c Power Generation Rates as A Function of Excess Air Ratio at BTDC13 at Biogas Volume Flow Rate 260L/min ... 50 Table 4.4d Power Generation Rates as A Function of Excess Air Ratio at BTDC17 at Biogas Volume Flow Rate 220L/min ... 50
IX
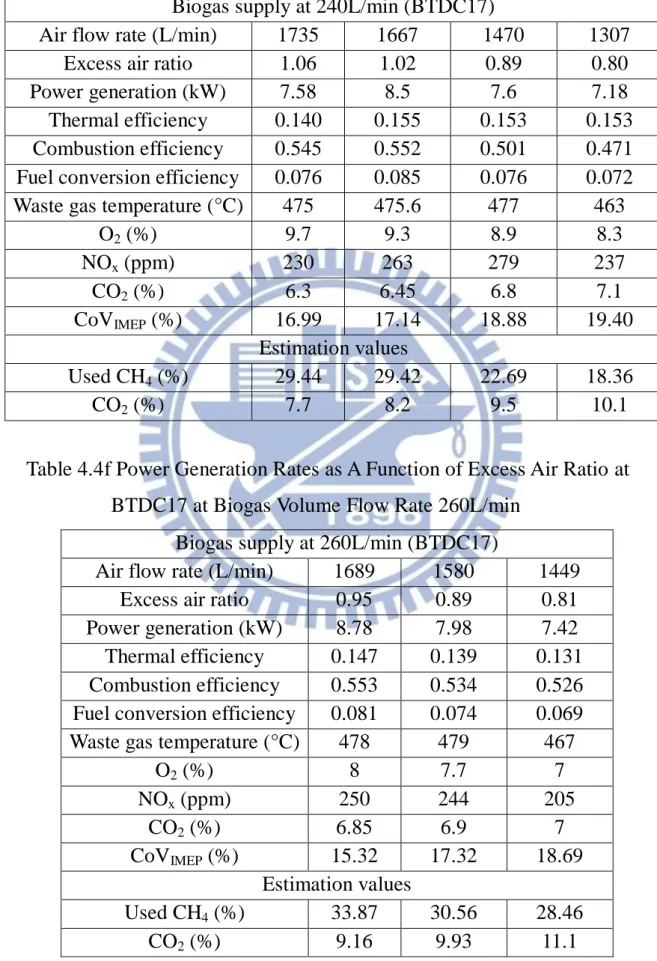
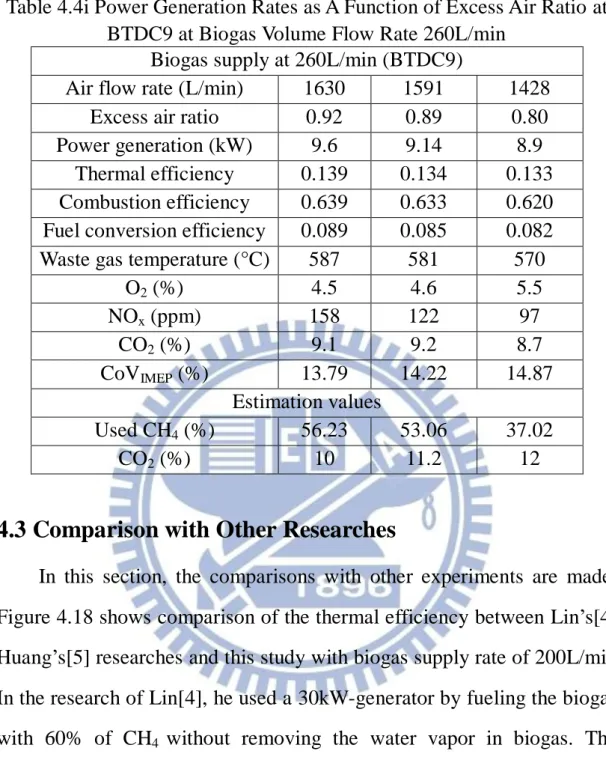
Table 4.4e Power Generation Rates as A Function of Excess Air Ratio at BTDC17 at Biogas Volume Flow Rate 240L/min ... 51 Table 4.4f Power Generation Rates as A Function of Excess Air Ratio at BTDC17 at Biogas Volume Flow Rate 260L/min ... 51 Table 4.4g Power Generation Rates as A Function of Excess Air Ratio at BTDC9 at Biogas Volume Flow Rate 220L/min ... 52 Table 4.4h Power Generation Rates as A Function of Excess Air Ratio at BTDC9 at Biogas Volume Flow Rate 240L/min ... 52 Table 4.4i Power Generation Rates as A Function of Excess Air Ratio at BTDC9 at Biogas Volume Flow Rate 260L/min ... 53
X
LIST OF FIGURES
Fig. 1.1 Simple Carbon Cycle for Biogas ... 61
Fig. 1.2 Scope of this Research ... 61
Fig. 2.1 Process of Biogas Production ... 62
Fig. 2.2 Range of Capacities for the Power Generators ... 62
Fig. 2.3 Values of Power Generators ... 63
Fig. 3.1 Experimental Equipment Layout ... 64
Fig. 3.2 Four Stroke Diesel Engine ... 64
Fig. 3.3a VA-400 Flow Sensor ... 65
Fig. 3.3b VA-400 Flow Sensor Data ... 65
Fig. 3.4a TF-4000 Flow Meter ... 66
Fig. 3.4b TF-4000 Flow Meter Data ... 67
Fig. 3.5 Dehumidifier (RD15) ... 68
Fig. 3.6 JHTD3010-N Temperature with Humidity Transmitter ... 68
Fig. 3.7 ECA450 Gas Analyzer ... 69
Fig. 3.8 Guardian Plus Infra-Red Gas Monitor ... 69
Fig. 3.9a CompactDAQ Chassis ... 70
Fig. 3.9b NI 9203 Analog Input Module ... 70
Fig. 3.9c NI 9211 Analog Input Module ... 71
Fig. 3.9d NI 9401 Digital Input Module ... 71
Fig. 3.10 Ignition System Layout ... 72
Fig. 3.11 Spark Timing Controller ... 72
Fig. 3.11 VERICOM 4000DAQ Tachometer ... 73
Fig. 3.12 Spark Plug Pressure Sensor (BKR5E-11 and 112A05)... 73
Fig. 3.13 Charge Converter (PCB 422E05) ... 74
XI
Fig. 4.1 Power Generation v.s. Excess Air Ratio with and without Dehumidification ... 75 Fig. 4.2 Waste Gas Temperature v.s. Excess Air Ratio with and without Dehumidification ... 75 Fig. 4.3a Thermal, Fuel Conversion and Combustion Efficiency v.s. Excess Air Ratio with 240L/min Biogas Supply and with and without Dehumidification ... 76 Fig. 4.3b Thermal, Fuel Conversion and Combustion Efficiency v.s. Excess Air Ratio with 220L/min Biogas Supply and with and without Dehumidification ... 76 Fig. 4.3c Thermal, Fuel Conversion and Combustion Efficiency v.s. Excess Air Ratio with 200L/min Biogas Supply and with and without Dehumidification ... 77 Fig. 4.4 O2 Concentration in Waste Gas v.s. Excess Air Ratio with and
without Dehumidification ... 77 Fig. 4.5 NOx Concentration in Waste Gas v.s. Excess Air Ratio with and
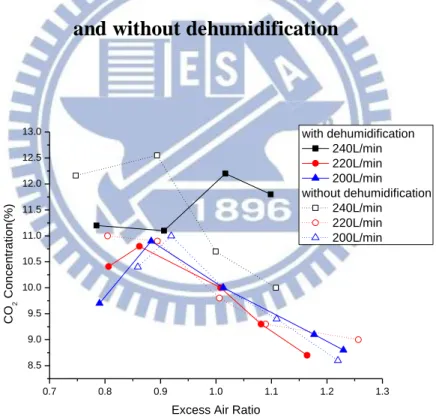
without Dehumidification ... 78 Fig. 4.6 CO2 Concentration in Waste Gas v.s. Excess Air Ratio with and
without Dehumidification ... 78 Fig. 4.7a Power Generation v.s. Excess Air Ratio with 260L/min Biogas Supply and Different Spark Timings ... 79 Fig. 4.7b Power Generation v.s. Excess Air Ratio with 240L/min Biogas Supply and Different Spark Timings ... 79 Fig. 4.7c Power Generation v.s. Excess Air Ratio with 220L/min Biogas Supply and Different Spark Timings ... 80 Fig. 4.8a Thermal Efficiency v.s. Excess Air Ratio with 260L/min
XII
Biogas Supply and Different Spark Timings ... 80 Fig. 4.8b Thermal Efficiency v.s. Excess Air Ratio with 240L/min
Biogas Supply and Different Spark Timings ... 81 Fig. 4.8c Thermal Efficiency v.s. Excess Air Ratio with 220L/min
Biogas Supply and Different Spark Timings ... 81 Fig. 4.9 Waste Gas Temperature v.s. Excess Air Ratio with Different Biogas Supply and Different Spark Timings ... 82 Fig. 4.10 O2 Concentration in Waste Gas v.s. Excess Air Ratio with
Different Biogas Supply and Different Spark Timings ... 82 Fig. 4.11 NOx Concentration in Waste Gas v.s. Excess Air Ratio with
Different Biogas Supply and Different Spark Timings ... 83 Fig. 4.12 CO2 Concentration in Waste Gas v.s. Excess Air Ratio with
Different Biogas Supply and Different Spark Timings ... 83 Fig. 4.13a Estimated CH4 Consumption Ratios v.s. Excess Air Ratio
with 260L/min Biogas Supply and Different Spark
Timings………...84 Fig. 4.13b Estimated CH4 Consumption Ratios v.s. Excess Air Ratio
with 240L/min Biogas Supply and Different Spark
Timings………...84 Fig. 4.13c Estimated CH4 Consumption Ratios v.s. Excess Air Ratio
with 220L/min Biogas Supply and Different Spark
Timings………...85 Fig. 4.14 In-cylinder Pressure v.s. Crank Angle Degree with 240L/min
Biogas Supply Rate and λ=1.0 at Different Spark Timings ... 85 Fig. 4.15 IMEP v.s. 200 Combustion Cycles with 240L/min Biogas Supply Rate and λ=1.0 at Different Spark Timings ... 86
XIII
Fig. 4.16a CoVIMEP v.s. Excess Air Ratio with 260L/min Biogas Supply
and Different Spark Timings……….….86 Fig. 4.16b CoVIMEP v.s. Excess Air Ratio with 240L/min Biogas Supply
and Different Spark Timings……….….87 Fig. 4.16c CoVIMEP v.s. Excess Air Ratio with 220L/min Biogas Supply
and Different Spark Timings……….…….87 Fig. 4.17 Estimated CH4 Consumption Ratios v.s. CoVIMEP with
Different Spark Timings ... 88 Fig. 4.18 Comparison of Thermal Efficiency with Other Researches at 200L/min Biogas Supply ... 88
1
Chapter 1
Introduction
1.1 Motivation and Background
On March 11, 2011, a severe earthquake in the western Pacific Ocean of Japan caused tsunami, subsequently resulting in a nuclear disaster. Four nuclear power plants in Fukushima were shut down. The failure of the cooling system led to the meltdown of atomic reactors and caused radiation pollution. Consequently, many countries intend to refrain from utilizing nuclear energy as the main source of energy. Hence, it is important to search alternative energy.
Although fossil fuels are the most widely used in the world, it is expected to deplete eventually. Renewable energies, such as wind, geothermal, hydro, solar thermal and biomass power, have the great potential to replace the fossil fuels and nuclear power and also be able to provide relatively cleaner energies. Biomass is one of the renewable energies that might become an important energy supply in the near future. Currently, the biomass supplies 50EJ/yr globally. The potential due to the progress of biomass technology is estimated 1500EJ/yr by 2050 in the 2010 survey of WEC (World Energy Council) [1].
Biomass is one of the most popular renewable energy in the world. There are many types of biomass energy supply, such as residues, natural resources and energy crops. Biogas, a sort of residues of biomass energy, can be produced from dung of livestock, harvested cereal stalks, sawdust, sewage and landfill, etc. Today, there are more than 3900 biogas plants built in Germany because the German government promulgated and
2
enacted Renewable Energy Act in 2000.
The manure and urine of swine include of methane (CH4), carbon
dioxide (CO2) and nitrous dioxide (NOx). They turn into biogas after
anaerobic treatment, which comprises methane (CH4) and carbon dioxide
(CO2) with a little amounts of hydrogen (H2), nitrogen (N2), ammonia
(NH3), hydrogen sulfide (H2S) and organic compounds. The methane is
burnable for generating power and heating.
There are many benefits to manage swine manure for the biogas. First, it can reduce the green house gases (GHG) emissions. Most of governments reinforce to reduction of GHG emissions nowadays. The main GHG in atmosphere are water vapor, carbon dioxide, methane, nitrous oxide, ozone and chlorofluorocarbons. The global warming potential of methane from untreated animal manure is 23 times of the carbon dioxide. It will cause the environment impact if those gases emit to the surrounding. Furthermore, the biogas can be regarded as a carbon neutral energy resource. Plants produce their own organic compounds by using carbon dioxide and solar radiation to photosynthesize. Carbon is transferred to animals fed by the plants. The carbon in biogas comes from the manure of animals. Then, a part of carbon goes back to the surroundings in a form of carbon dioxide by respiration or by combustion of biogas. Therefore, the net of carbon amount in this cycle, as shown in Fig. 1.1, equals to zero. Unlike the carbon of biogas, the carbon of fossil fuels takes long term to complete the carbon cycle. Besides, as long as the sun continues emitting light, the carbon cycle will keep running. The second one is the power generation. 99% of the energy source at Taiwan is imported. In the meantime, swine population is up to 90% of livestock.
3
If Taiwan intends to use limited resources to self-supported, then biogas is a good candidate to invest [2]. As the biogas as fuel is used for combustion, the exhausted heat can be further utilized, like to heat the water to provide the swine farm. Third, it can avoid polluting the environment. The manure of swine has high content of volatile organic compounds, which can deteriorate the quality of rivers. Last, there are many swine on farm, and the swine is the major livestock in Taiwan, which reach up to 6.62 million heads. According to this data, the potential of methane generation is about 400Gg/yr [3]. From the above reasons, biogas is an apparent renewable and green energy fuel.
This laboratory has been awarded a three-year research project by National Science and Technology Program for Energy from 2010 to 2012. The project is named as Development the technology of agricultural waste
bioconversion to biogas for electricity generation and carbon dioxide elimination by microalgae. Constructing a pilot biogas plant is the
ultimate goal of this project, which is divided into four subprojects. The subproject 1 is to upgrade the utilization efficiency of biogas by removing H2S and CO2 to improve the biogas generation rate. In the subproject 2, the
desulfurized biogas of subproject 1 will be utilized to operate the biogas engine to produce electricity under different monitoring parameters. The subproject 3 is to produce biodiesel from high lipid-content algae utilizing waste CO2 either from the engine flue gas or the biogas itself. The
purpose of the subproject 4 is to research the operating conditions which will affect biogas production rates and methane concentrations emission during the anaerobic processes.
4
[4] used a 30kW generator to construct a waste heat recovery system and to analyze the power output and thermal efficiency. In the second year, based on the experience from the first year, a pilot plant was constructed for the biogas treatment and power generation in a Taiwan Sugar swine farm. Besides, Huang[5] utilized the heat recovery system to analyze the preheating influence on the performance of power generation. In this year, a completely self-operated biogas plant and a remote control system are established. Up to 2011, this subproject is expected to be capable to generate 90,000kW-h electricity per year, equivalent to electricity charge saving of USD 9000, in aswine farm of 3000-head pigs.
Both Lin [4] and Huang [5] tested the same biogas generator under different concentration of CH4. In other words, they did not consider the
effects of the water vapor content in biogas and the spark timing on generator. Hence, this study will remove the water vapor at intake fuel and install the spark timing system to enhance the performance and combustion stability of engine to find the best operative condition to raise the thermal efficiency. In addition to these, the detailed intake biogas constitutes and their concentrations are also measured in order to get the real data, instead of the assumed ones in Lin [4] and Huang [5], to carry out the analyses.
1.2 Literature Review
Brown [1] pointed that in the world, biomass comprise two third of total renewable energy. The renewable energy has not yet fully developed in Taiwan because the fossil energy is much cheaper than renewable
5
energy. However, the renewable energy will become more competitive in the energy market since Legislative Yuan of Taiwan passed “Renewable Energy Development Bill” in June 2009, investigated by and Chen et al. [2]. Besides, Tsai and Lin [3] surveyed bioenergy from livestock manure management in Taiwan. Based on the characteristics of the swine dung, the benefits from total swine pollution (about 4.3 million heads) of the farm scale of over 1000-head swines in Taiwan showed as follows: emissions of methane reduce 21.5Gg/yr, total electricity is generated 7.2×10⁷ kWh/yr, equivalent to electricity charge saving USD7.2×106/yr (1 dime per kW-h in Taiwan) and carbon dioxide mitigation is 500Gg/yr.
Lin [4] tested different air-fuel ratios for 30kW generator with 60% methane concentration of biogas in a small swine farm in Miaoli. The oxygen-enriched combustion and heat recovery were also applied to his research. The results showed that a higher power output and better thermal efficiency can be achieved by a greater conversion of CH4 in the
combustion process. The engine performances are not improved much by 1% oxygen-enriched air, but with 3% oxygen-enriched air, the maximum power generation and thermal efficiency are increased, especially the engine can be operated normally at a lower limiting fuel supply rate. The heat recovery system is used to heat water, leading to an improvement of overall efficiency. Next year, Huang [5] used 73% methane concentration of biogas to compare with the results of Lin [4] and applied the heat recovery system to heat the inlet gas under different temperature and analyze the preheating influence on the generation performance. The results showed that the power generation with 73% CH4 of biogas are
6
λ<0.85. However, the thermal efficiency increases with the increasing methane concentration just in the region of λ>0.95. In the case of the increasing inlet gas temperature effect, there is an obvious improvement when the temperature increases from 40°C to 120°C for biogas supply rate of 140L/min with λ=1.58.
Su et al. [6] made the comparison between the livestock wastewater treatment systems in Taiwan according to IPCC standard. The investigation showed that anaerobic wastewater treatment systems of swine emit 0.768 kg CH4, 0.714 CO2, and 0.002 N2O per year per head
during three seasons in Taiwan. The average emissions rates of CH4 in the
selected swine is lower than the limits imposed by the IPCC due to the dilution of animal manure being treated with a solid/liquid separator and an anaerobic wastewater treatment system. Yang et al. [7] estimated the methane and nitrous oxide emissions from animal production sector in Taiwan during 1990~2000. Methane emission from enteric fermentation of livestock was 30.9 Gg in 1990, increased to 39.3 Gg in 1996, and decreased to 34.9 Gg in 2000. Methane emission from the waste management was 48.5 Gg in 1990, 60.7 Gg in 1996, and 43.3 Gg in 2000. In the case of poultry, methane emission from enteric fermentation and waste management were 30.6~44.1 ton and 8.7~13.2 Gg. Nitrous oxide emission from waste management of livestock was 0.78 ton in 1990, 0.86 ton in 1996, and 0.65 ton in 2000. Nitrous oxide emission from waste management of poultry was higher than that of livestock with 1.11 ton in 1990, 1.68 ton in 1999, and 1.65 ton in 2000.
Porpatham et al. [8] tested the effect of CO2 concentration in biogas on
7
scrubber was used to absorb CO2 in biogas. They found when CO2 in
biogas is reduced from 41% to 30%, then, 20% of engine performance is improved, unburnt hydrocarbons is reduced and lean limit of combustion is extended. However, such improvement occurs just in the lean-fuel region. Increasing methane concentration plays a significant role in lean-fuel region because the flame velocities are low in such region. There is no benefit for power and efficiency on the rich-fuel side due to incomplete combustion of engine.
Bika et al. [9] varied H2 and CO proportions to compare engine knock
and combustion characteristics of a spark ignition engine. They showed the knock limits, used to determine the safe operating region and describe the knocking characteristics of the fuel, of the engine at spark timing of 12 crank angle degree before top-dead-center (CAD BTDC). The knock limited equivalence ratio is drop with increasing compression ratio. The non-knocking area falls to the left side of the equivalence ratio versus compression ratio curve. The curve displaces to the right side when the CO fraction in H2/CO mixture increases from 0% to 50%, standing for
the enlargement of non-knocking area. As increasing CO fraction in H2/CO mixture at equivalence ratio equals to 0.6 (λ=1.67), the spark
timing at the maximum brake torque (MBT) advances and the overall burn duration postpones. The peak cylinder pressures decreases lightly with increasing CO fraction. Although higher CO fraction makes burning worse, it reduces the knock.
Arunachalam and Olsen [10] used a CFR F-2 engine and fueled with different compositions of producer gases in order to evaluate the knocking characteristics. The critical compression ratio referred to the
8
compression ratio at which the fuel mixture experience of light audible knock on the test engine. They found that an increase in volume percentage of CO2 in test gas makes an increase of critical compression
ratio. Besides, there is a decrease of the critical compression ratio as the percentage volume of H2 in the composition is increased.
Agarwal et al. [11] investigated the effect of exhaust gas recirculation (EGR) burnt with diesel on the performance and emission of a compression ignition engine. Thermal efficiency increases slightly at lower loads with EGR because EGR is full of un-burning hydrocarbons. But at higher loads, thermal efficiency with EGR is almost the same as the one without EGR. It found that enhancement of EGR can reduce NOx,
especially at 15% EGR rate. Hu et al. [12] also surveyed the effect of EGR on the combustion characteristics of a spark ignition engine by changing the proportion of natural gas and hydrogen. Increasing hydrogen will shorten the lag of ignition and speed up the flame propagation speed. Hence, the MBT spark timing is advanced. Increase of EGR rate makes a delay of heat release at the beginning. The burn duration also increase with the enhancement of EGR rate. They also found that increase of H2 reduces the cylinder peak pressure at 5% EGR
rate under engine speed of 2000rpm. When EGR rate over than 20%, the cylinder peak pressure is almost equal to the maximum motoring pressure because of occurrence of misfire.
Nathan et al. [13] converted a single-cylinder, diesel engine to operate in homogeneous charge compression ignition (HCCI) mode with acetylene as fuel. They tested the effects of intake air temperature and EGR on the engine performance and exhaust gas emissions. The intake air was heated
9
by an electric heater in the range of 40~110°C from no load to brake mean effective pressure (BMEP) of 4 bar. The results showed that the intake air temperature and amount of EGR have to be controlled according to engine output. At high output, engine is very sensitive to the intake air temperature and EGR. In order to get greater brake thermal efficiency, precise control is required. It is observed that the best charge temperature is reduced as BMEP increases, because the elevation of BMEP will lead to an increase of engine temperature and make the mixture become richer. When the mixture is rich, the self-ignition temperature reduces and the combustion rate increases. Besides, at high BMEPs, using EGR will lead to knock.
Szwaja et al. [14] used a single cylinder engine and applied gasoline with compressed hydrogen under stoichiometric condition (λ=1) to measure the pressure and accelerometer intensities and to analyze the frequency. The coefficient of determination (COD) was used to compare the relationship between the in-cylinder pressure intensity (PI) and the accelerometer intensity (AI). The result showed that the COD(PI, AI) of
hydrogen is 0.62 and the one of gasoline is 0.64. If a COD(PI, AI) is
greater than 0.6, the combustion knock of engine is sufficiently robust by using only accelerometer. They surveyed the combustion knock by frequency analysis. The frequencies were determined by a high filter to remove the low frequency components, and then computed the fast Fourier transform (FFT) for each combustion cycle. The peak frequency in the FFT of the fuel H2 occurs at 6.4 kHz of pressure signal and at 5.7
kHz of accelerometer signal; the FFT’s peak of the biogas occurs at 5.7 kHz for both of pressure signal and for accelerometer signals. Only slight
10
difference between hydrogen and gasoline knock was observed by using FFT frequency analysis. The reason for the difference between the FFT’s peaks mostly comes from different mean gas temperature and different crank position for maximum knock pressure.
Park et al. [15] operated an 8-L, 6-cylinder spark ignition engine fueled by various the proportions of methane and nitrogen. Increasing N2
concentration makes the enhancement of thermal efficiency because with higher N2 dilation makes a decrease of combustion temperature due to
less cooling loss to coolant. The experiment also applied different concentrations of H2 in biogas at stoichiometric (λ=1) and lean conditions.
The engine operation at λ=1 with more than 5% H2 addition makes the
decrease of thermal efficiency caused by increasing cooling loss. The lift of H2 fraction also makes the evaluation of NOx emission due to faster
burning speed. The similar situation also happens at lean burning condition. The maximum NOx emission occurs at λ=1.1 for the entire fuel
condition.
Badr et al. [16] carried out a parametric study on the lean misfiring and knocking limits of gas-fueled spark ignition engine. They tested Ricardo E6 engine, using propane and liquefied petroleum gas (LPG) as fuels. The parameters included engine speed, compression ratio, spark timing, intake temperature, intake pressure, and relative humidity of intake air. The experimental results are shown in the following: Advancing the spark timing leads to the reduction of lean misfire and knocking limit. For low engine speeds, when the intake temperature increases, the lean misfire limit decreases. For high speeds, when the intake air temperature is up to 70°C, the lean misfire limit increases, however, beyond 70°C the lean
11
misfire decreases. As the relative humidity of the intake air increases, the lean misfire limit increases because the water vapors as a diluents will damp down the reaction rates during compression and combustion processes.
Zarante et al. [17] operated four-cylinder and flexible fuel engine by using gasoline and nature gas as fuels to evaluate the exhaust emissions of CO and CO2. Due to the low carbon-hydrogen ratio of nature gas with
respect to gasoline, the CO2 emission of nature gas is less than that of
gasoline. So does the CO emission, because the engine can operate with leaner mixtures when natural gas is used instead of gasoline.
1.3 Scope of Present Study
The scope of this research is shown in Fig. 1.2. A 30kW-generator is used in a swine farm. The biogas after desulfurization process still contains the water vapor. Hence, it is necessary to remove the water vapor in the intake biogas before it flows into the engine. Besides, the detailed intake biogas constitutes and their concentrations are also measured. Moreover, the ignition system had been installed on the engine to enhance its performance and combustion stability. After these implementations, the effects of varying the fuel flow rate and the excess air ratio on the engine’s performance are studied.
12
Chapter 2
Biogas Generation System
2.1 Process of Biogas Production
Fig. 2.1 shows the process of biogas production. The manure of swine after collection goes to wastewater treatment. The first step is solid/liquid separation. Separation of the solid from the wastewater is to reduce the content of solids for subsequent handling and treatment, and to recovered solids can be used as fertilizer, etc. This physical process is accomplished by using various kinds of filters. Anaerobic treatment is conducted after solid/liquid separation, and occurs inside of anaerobic basins enclosed with “red-mud plastic (RMP) cover” (1.2~1.8mm of thickness), made of a kind of PVC material, which is corrosion-resistant and gas-and-water impermeable. The anaerobic treatment system can also salvage a part of chemical energy content of wastewater by producing methane.
Biogas from the anaerobic tank contains very high degree of hydrogen sulfide (H2S), which can corrupt the power generator, so the
desulfurization process is needed in advance. The common method for reduction of hydrogen sulfide is biological desulfurization. In the process, the H2S is absorbed in water and then its content is mitigated greatly by
biological method. After desulfurization process, the biogas will store in a red plastic bag.
2.2 Utilization of Biogas
Biogas can be used either for the production of heat only or for the generation of electric power. Normally heat and power are produced in
13
the same time for higher energy efficiency. Such power generators are called combined heat and power (CHP) generation plants, and it is normally used in a four-stroke or a Diesel engine. CHP generation is an efficient way for energy conversion of biogas at small- and large-scale plants of biogas production. A Stirling engine or gas turbine, a micro gas turbine, high- and low-temperature fuel cells, or a combination of a high-temperature fuel cell with a gas turbine are alternatives.
Biogas can also be used by burning it to produce steam, by which can drive an engine in the Organic Rankine Cycle (ORC) or the Cheng Cycle, the steam turbine, the steam piston engine, or the steam screw engine.
Fig. 2.2 shows the range of capacities for the power generators, which are available on the market for the pilot-plant or industrial scale. The efficiency is defined as the ratio of the electrical power generated to the total energy content in the biogas. Efficiency figures are also provided by different manufacturers. Small-capacity engines generally can result in the lower efficiencies than that of high-capacity engines.
The generated current and heat can supply to the bioreactor itself, associated buildings, and neighboring industrial companies or houses. The power can be fed into the public electricity network, and the heat into the network for long-distance heat supply.
2.3 Engines
Fig. 2.3 lists some engines that can be operated with biogas. These have been improved during the recent years by following the development works inspired by the worldwide boom in biogas plants. The performance by some manufacturers even has already exceeded that
14
of those given in this figures.
2.3.1 Four-stroke Gas Engine and Diesel Engine
Today’s four-stroke biogas engines were originally developed for natural gas and are therefore well adapted by the special features of biogas. Their electrical efficiencies normally do not exceed 34~ 40%, as the nitrogen oxide (NOx) output has to be kept below the prescribed
values. The capacity of the engines ranges from 100 kW to 1 MW.
Four-stroke biogas engines often run in the lean-burn range (ignition window 1.3 < λ < 1.6, λ is air-fuel ratio/stoichiometric air-fuel ratio), where the efficiency is expected to drop. The efficiency of lean-burn engines with turbocharger is 33~ 39%. The NOx emissions can be
reduced, however, by a factor of 4 in comparison to ignition (by compression) oil Diesel engines, and the limiting values can be met without further measures. Since the engines tend to knock with varying gas qualities, a methane content of at least 45% in biogas should be ensured.
In small agricultural plants, ignition oil Diesel engines are frequently installed. These engines are more economical and have a higher efficiency than four-stroke engines in the lower capacity range. However, higher NOx emissions are produced by Diesel engine. Their lifetimes
usually are given as 35,000h of operation.
In general, Diesel engines burning gas fuel can be operated by direct injection because pre-chamber engines develop hot places, resulting in uncontrolled spark failures with biogas. Owing to the internal formation of gas mixtures, Diesel engines can be faster controlled. The ignition oil Diesel engine is operated ideally at λ < 1.9. The efficiency is then up to
15
15% better than that in a four-stroke engine.
2.3.2 Stirling Engine
An alternative to the commonly used four-stroke and the Diesel engines is the Stirling engine. The efficiency of the Stirling process is closest to that of the ideal cycle. The Stirling engine has been recommended for power generation for many years, but is seldom realized on an industrial scale because of technical problems in details. Power generated from biogas in Stirling engines is not known yet in industrial scale installations.
2.3.3 Gas Turbine
Biogas can be converted to current via gas turbines of medium and large capacity (20 MW and more) at a maximum temperature 1200 °C. The tendency is to go to even higher temperatures and pressures, whereby the electrical capacity and thus the efficiency can be increased. The main parts of a gas turbine are the compressor, combustion chamber, and turbine.
Ambient air is sucked and compressed in the compressor and transmitted to the combustion chamber, where biogas is introduced and burnt with the compressed air. The flue gas that is so formed is passed to a turbine, where it expands and transfers its energy to the turbine. The turbine propels the compressor on the one hand and the power generator on the other hand. The exhaust gas leaves the turbine at a temperature of approximately 400~600 °C. The waste heat can be recovered by driving a steam turbine downstream for heating purposes or for preheating the air that is sucked in.
16
Micro gas turbines are small high-speed gas turbines with low combustion chamber pressures and temperature, which are designed to generate the electrical powers between 28kW to 200kW. They are operated on a Brayton cycle, consisting of a gas compressor, a combustion chamber and an expansion turbine. For normal operation, the compressor sucks in the combustion air. The fuel is normally supplied to meet the combustion air in the combustion chamber. When biogas with a low calorific value is used, it must be adjusted to a flammable mixture of biogas and air before it is supplied into the combustion chamber.
The electrical efficiency of 15~25% for today’s micro gas turbines is still unsatisfactorily low. An attempt to increase the efficiency has been made by preheating the combustion air in heat exchange with the hot turbine exhaust gases. But great improvements are still necessary before micro gas turbines can be introduced into the market of industrial biogas plants. However, the coupling of a micro gas turbine with a micro steam turbine to form a micro gas-steam turbine seems already interesting and economical today because of its high electrical efficiency.
2.3.5 Fuel Cell
Comparing to combustion engines, the fuel cell converts the chemical energy of hydrogen and oxygen directly into current and heat. Water is formed as the reaction product.
In principle, a fuel cell works with a liquid or solid electrolyte held between two porous electrodes–anode and cathode. The electrolyte lets ions pass only and allow no free electrons from the anode to the cathode side. The electrolyte is thus “electrically non-conductive.” It separates the reaction partners and thereby prevents direct chemical reaction. For some
17
fuel cells, the electrolyte is also permeable to oxygen molecules. In this case the reaction occurs on the anode side. The electrodes are connected by an electrical wire.
Both reaction partners are continuously fed to the two electrodes, respectively. The molecules of the reactants are converted into ions by the catalytic effect of the electrodes. The ions pass through the electrolyte, while the electrons flow through the electric circuit from the anode to the cathode. Taking into account all losses, the voltage per single cell is 0.6 ~ 0.9 V. The desired voltage can be reached by arranging several single cells in series, a so-called stack. In a stack, the voltages of the single cells are added.
Depending on the type of fuel cell, the biogas has to be purified to remove CO and H2S especially before feeding into the fuel cell. Only a
small number of fuel cell plants, mostly pilot plants, are in operation for the generation of electricity from biogas.
18
Chapter 3
Experimental Apparatus and Procedures
3.1 Experimental Equipment Layout
The experimental equipment layout is shown in Fig. 3.1 When the engine is running, the air and the biogas are sucked into the engine automatically. The water vapor of biogas is removed by dehumidifier, marked by D, before biogas flows through the flow meter, F1. The flow meters, marked by F1 and F2, measure the air and the biogas flow rates, respectively, which are controlled by valves at the engine inlets. The crank angle degree can be recorded by rotary encoder, marked by R. The spark timing controller, marked by ST, can adjust spark timing according to the correspondent crank angle degree. The in-cylinder pressure can be obtained at each crank angle degree by the spark-plug pressure sensor, marked by P. The engine gets the power by combustion to drive the generator to produce the electricity. A waste gas analyzer places at the engine outlet to measure the compositions of waste gases, and the gas temperature is measured by a thermocouple.
3.1.1 Engine
The spark ignition system, adopted by Lin [4] and Huang [5], was installed to the four-stroke diesel engine. In other words, The ignition way was changed into spark ignition instead of comprssion one. For the original engine, the ideal power cycle is Diesel cycle. When the compression ignition system is converted to spark ignition system, the ideal power cycle of present engine becomes Otto cycle. Figure 3.2 shows the modified engine and its detailed data can be referred in the
19
following table.
Table 3.1 Engine Technical Data
Engine Technical Data
Engine model 8031i06
Diesel 4 stroke - Injection type direct
N° of cylinders 3 in line Total displacement 2.9 L Bore × Stroke 104 × 115 mm Compression ratio 10 : 1 Engine speed 1800rpm Aspiration natural
Cooling system liquid (water + 50% Paraflu11)
Lube oil specifications ACEA E2-96 MIL-L-2104E
Lube oil consumption ~ 0.3% of fuel consumption
Fuel specifications EN 590
Speed governor mechanical (G2 class)
Engine rotating mass moment of inertia 0.942 kg m2
Dry weight ( standard configuration) ~ 370 kg
This study still uses the engine but with an important modification, which will be described in Section 3.1.9., to enhance its combustion stability.
3.1.2 Air Flow Meter (VA-400)
20
flow sensor, whose range varies with the installed pipe diameter. In order to maintain the accuracy stipulated in the data sheets, the sensor must be inserted in the center of a straight pipe section with an undisturbed flow progression. An undisturbed flow progression is achieved if the sections in front of the sensor and behind the sensor are sufficiently long, absolutely straight and without any obstructions such as edges, seams, curves etc. The minimum length ahead the sensor along the pipe should be 10 times of pipe diameter and 5 times behind sensor for the fully developed turbulent flow profile, so the measured flow rate can be accurate enough. Figures 3.3a and 3.3b show the flow meter and its detailed data.
3.1.3 Biogas Flow Meter (TF-4000)
The flow meter at biogas inlet is TOKYO KEISO TF-4000 thermal-mass flow meter. Figure 3.4a and Figure 3.4b show the flow meter and its technical data. Operation principle is following: Two temperature sensors are put on along the flow path of gas. One of them is heated by a controlled power supply, and another one is not heated. The temperature difference between these two sensors should be always kept constant under a fixed mass flow rate. The different mass flow rate will result in different temperature difference. Therefore, it can deduce the mass flow rate of fluid flow by the quantity of power supply to maintain the temperature difference between these two sensors.
3.1.4 Dehumidifier (RD15)
Figure 3.5 shows the dehumidifier, GTT RD15, used for removing the water vapor of biogas. The maximum inlet biogas flow rate is 30 L/sec. It is pre-cooled as biogas leaves from the evaporator. The coolant in the
21
dehumidifier is R22.
3.1.5 Temperature with Humidity Transmitter (JHTD3010-N)
Such transmitter is shown in Fig. 3.6, whose humidity accuracy covers the full range from 0 to 100% RH, allowing precise measurement of the humidity over the operating temperature from -40 to 80 °C. It is used for measuring the temperatures and humidity of biogas that with and without dehumidification and also measuring the temperatures and humidity of intake air.
3.1.6Gas Analyzer (ECA450)
Figure 3.7 is the gas analyzer, BACHARACH ECA 450, used for measuring waste gas component data, which include the concentrations of oxygen, NOx and carbon dioxide.
3.1.7 Methane Concentration Analyzer (GuardCH4)
Figure 3.8 is guardian plus infra-red gas monitor GuardCH4, which is used for measuring the methane concentration of the inlet biogas.
3.1.8Data Acquisition
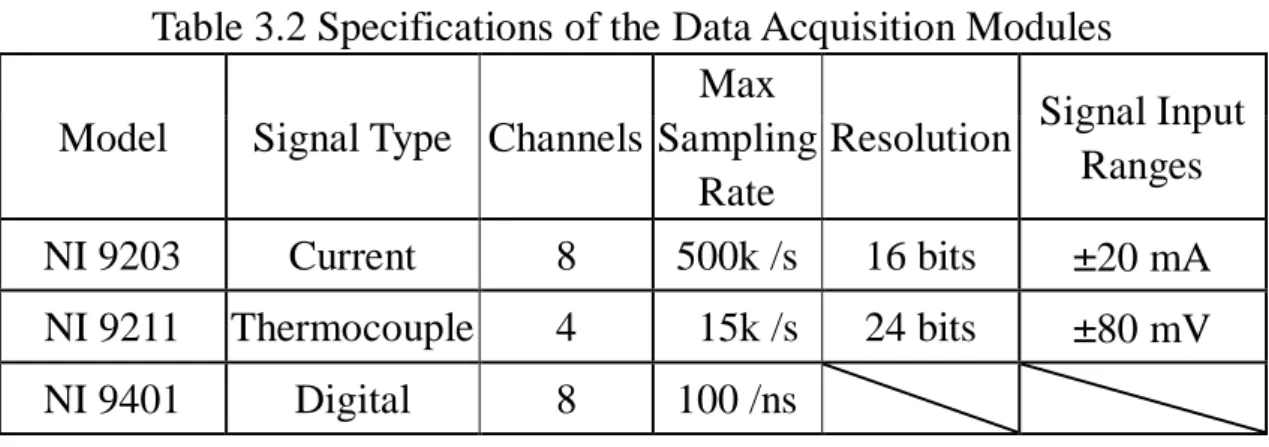
Data acquisition system can automatically collect signals from analog and digital measurement sources, such as sensors and devices, under tests. It uses a combination of PC-based measurement hardware and software to provide a flexible and user-defined measurement system. Usually, the researcher must calibrate sensors and signals before a data acquisition device acquires them. The specifications of these modules of National Instruments are shown in Table 3.2.
22
Table 3.2 Specifications of the Data Acquisition Modules Model Signal Type Channels
Max Sampling
Rate
Resolution Signal Input Ranges NI 9203 Current 8 500k /s 16 bits ±20 mA NI 9211 Thermocouple 4 15k /s 24 bits ±80 mV NI 9401 Digital 8 100 /ns
National Instruments, a leader in PC-based data acquisition, offers a complete family of proven data acquisition hardware devices and the powerful and easy-to-use software that can extend to many languages and operating systems. NI CompactDAQ delivers fast and accurate measurements in a small, simple, and affordable system. A CompactDAQ Chassis shown in Fig. 3.9a, a product of NI, is adopted because of the following advantages: plug-and-play installation and configuration, AC power supply and USB cable connection, mounting kits available for panel, enclosure, DIN-rail and desktop development, A380 metal construction, more than 5 MS/s streaming analog input per chassis, and Hi-Speed USB-compliant connectivity to PC. Different types of signal process modules are chosen to complete the data acquisition system, including NI 9203 Analog Input Module, NI 9211 Thermocouple Differential Analog Input Module and NI 9401 TTL Input Module. All of these are shown in Fig. 3.9b, Fig. 3.9c and Fig. 3.9d.
3.1.9 Ignition System
Figure 3.10 shows the details of ignition system. When the spark plug starts to ignite, the ignition signal is recorded into NI recorder by the tachometer. The in-cylinder pressure is captured by the spark plug
23
pressure sensor, and then the charge converter converts the charge signal to voltage signal by the supply of steady current of power unit. The rotary encoder is installed to record the crank angle of piston cylinder. The spark timing controller shows in Fig.3.11, which can be adjusted to change the spark timing by different supply rate of high voltage for spark plugs.
3.1.9.1 Tachometer (VC4000DAQ)
The VERICOM 4000DAQ tachometer is used for measuring the exact spark timing, shown in Fig.3.12. It is clamped onto the spark plug wire to capture the spark signal.
3.1.9.2 Spark Plug Pressure Sensor (BKR5E-11 and 112A05)
The spark plug pressure sensor is modified from NGK BKR5E-11 spark plug with PCB Piezotronics 112A05 pressure sensor, shown in Fig. 3.13.The pressure range is up to 350 bar and the operating temperature up to 240 to 310°C. It is used for measuring the in-cylinder pressure during the combustion process.
3.1.9.3 Charge Converter (PCB 422E05)
Such converter is shown in Fig. 3.14, which is designed to convert the high impedance of a charge mode piezoelectric transducer into a low-impedance voltage. The charge output of the transducers is scaled in term of pressure, mV/psi.
3.1.9.4 Rotary Encoder (HPN-6A)
The HONTKO HPN6A rotary encoder, shown in Fig. 3.15, is used to record the crank angle of piston cylinder during the cycle.
24
3.2 The Theoretical Calculation
The following calculations include the excess air ratio, thermal efficiency, theoretical mole fraction of CO2 in waste gas, theoretical
percentage of consumed CH4, the percentage of water vapor removed
from biogas and combustion stability. These data will be used in the analyses of the following experiments.
3.2.1 Excess Air Ratio
The air-fuel ratio (AF) is defined as a ratio of the mole of air to the one of fuel in the combustion process. The composition of biogas in this study contains air, leaking from the atomosphere to the storage tank when the water line of anaerobic fermentation pool is too low. Hence, the stoichiometric reaction for combustion of biogas with standard air is given as:
(3.1)
where , and are the moles of CO2, air and water vapor in the
biogas, respectively. Both and can be measured by instruments, and can be obtained from the absoulate humidity( ) of biogas. Since the water vapor is considered as an ideal gas, the percentage of vapor from biogas can be calculated as follows:
(3.2)
25
air in biogas, respectively. is the pressure of biogas and is the vapor pressure in biogas, which is obtained from:
(3.3)
where is the relative humidity, measured by instrument, and the saturation pressure of vapor at the same temperature.
The stoichiometric air-fuel ratio, AFstoich, is:
(3.4)
On the other hand, AFact is the air-fuel ratio of the actual mole of the air to the summation of moles of the methane, CO2 and air in biogas into the
engine. Because the mole ratio is equal to the volume flow rate ratio, and the summation of the methane, CO2, air and water vapor in biogas flow
rate is equal to the biogas flow rate. AFact can be also expressed as:
(3.5)
The air flow rate can be measured by air flow meter directly, whereas the methane flow rate is obtained by the measured biogas flow rate
26
multiplied by the mole fraction of methane (both flow meters were demonstrated in sections 3.1.2 and 3.1.3).
The Excess Air Ratio (λ) is the ratio of the actual mole of air used to the stoichiometric mole of air, defined as:
(3.6)
Note that the actual mole of fuel is equal to stoichiometric mole of fuel because in the engine experiments the fuel supply rate is fixed, whereas the air volume flow rate is changed. As a consequence, the excess air ratio is equal to ratio of AFact to AFstoich. Also remind that λ is reciprocal of equivalence ratio.
3.2.2 Consumption of CH4
The theoretical consumed percentage of CH4 and the percentage of
CO2 in waste gas in the combustion process are calculated as follows:
The balanced reaction is:
(3.7)
where the NOx and CO concentration (in an order of ppm) in waste gas
can be neglected. , and are the moles of CO2, moles of air and
mloes of water vapor in the biogas, respectively. and are the moles of O2 and CH4, respectively, in waste gas. can be calculated from the
27
percent of O2 in waste gas as follow:
(3.8)
where is the total moles in waste gas, is obtained from the atom balance as:
(3.9)
The theoretical percent of CO2 in waste gas can be calculated by:
(3.10)
The theoretical percent of used CH4 is defined as:
(3.11)
3.2.3 Thermal Efficiency
The thermal efficiency is defined as the ratio of the fuel conversion efficiency to the combustion efficiency, and its formulation is as following :
(3.12)
28
(3.13)
where W is the electric power generated and LHV the lower heating value.
Combustion Efficiency is expressed as the ratio of the enthalpy difference
between the the products and reactants to the LHV of biogas:
(3.14)
where the numerator stands for the real heat release rate between inlet and outlet of the biogas, and the denominator represents the ideal heat release rate. Now,
4[ +( ) ] 4+ 2[ +( ) ] 2+ 2 [ +( )
] 2 + 2[ +( ) ] 2}
(3.15)where the unit of enthalpy is kJ/kmole, and is the mole flow rate of biogas, calculated by:
(3.16)
in which and refer to the density and the mole of biogas, respectively.
29
Eventually, the thermal efficiency can be obtained by dividing the fuel conversion efficiency (Eq. 3.13) by combustion efficiency (Eq. 3.14); that is
(3.17)
3.2.4 Combustion Stability
The process of spark-ignition engines includes suction, compression, expansion and exhaust strokes. The combustion stability, represented by knock, can be detected by many ways in which three of them are introduced as follows. The ionization current measurement circuit is installed with spark plug electrodes to obtain current intensity. The high frequencies contain to the current signal due to variation of pressure when combustion stability becomes bad. Hence, the combustion stability can be analyzed through current intensity. Second one is the engine vibration method. By the way of an accelerometer fixed on the top-surface of the engine cylinder. The last one is the in-cylinder pressure method. The in-cylinder pressure is measured by pressure sensor. It is much more reliable than other two methods because the fact that in-cylinder pressure method directly measure the pressure of in-cylinder.
The indicated mean effect pressure (IMEP) is calculated by integrating pressure with respect to response volume during the combustion process, and Vd is the effective working volume. It is expressed as:
30
The combustion stability, coefficient of variation in indicated mean effective pressure ( ), is defined as:
(3.19)
where is the average of indicated mean effect pressure and the standard deviation of IMEP. Their formulations are as following:
(3.20)
(3.21)
where n is the number of combustion cycle.
3.3 Dehumidifying Water Vapor of Intake Fuel
The compositions of biogas have more water vapors when it ferments under higher temperature. The water vapor will block the pipe by fueling biogas, making impact on the generator performance.
The experimental parameters include biogas flow rate and excess air ratio. Before experiment, the intake biogas constitutes and their concentrations are measured. The biogas flow rates are set as 200, 220 and 240 L/min, respectively. Under each fixed biogas flow rate, it tests different excess air ratios, ranged from 0.8 to 1.2. The collected data include biogas flow rate, air flow rate and power generation. The measurement starts when the engine is operating continuously until all conditions are ensured to be steady. Then, all measurements are tested twice and take an average. The experimental procedure is as follows:
31
1. Dehumidify water vapor in biogas.
2. Measure the relative humidity, temperature and pressure of biogas. 3. Measure the intake biogas constitutes and their concentrations. 4. Operate the engine at least 20 minutes to warm up.
5. Fix the biogas flow rate at demanded quantity. 6. Control the air flow rate for specific excess air ratio. 7. Collect the corresponding data, mentioned above. 8. Repeat the procedure for different excess air ratio.
3.4 The Effect of Spark Timing
The spark timing adjustment is an important parameter for engine performance. The optimum spark timing gives a maximum brake-torque, and leads to the maximum power output. In this study, the maximum power output of spark timing can be found. The advance or delay from the optimum spark timing lead to improper performance of engine.
The experimental parameters are spark-timing, biogas flow rate and excess air ratio. The biogas flow rates are 220, 240 and 260 L/min, and excess air ratios are ranged from 0.8 to 1.2. The optimum spark timing is adjusted in this study. Besides, the advance and delay of the optimum spark timing are investigated as well. At each specific spark timing, it tests different biogas flow rates and each flow rate is accompanied with different excess air ratios. The collected data include biogas flow rate, air flow rate, resultant power generation, pressure of in-cylinder, and concentrations of methane, oxygen, carbon dioxide and NOx. The
32
1. Dehumidify water vapor of intake biogas.
2. Measure the relative humidity, temperature and pressure of biogas. 3. Measure the intake biogas constitutes and their concentrations. 4. Operate the engine at least 20 minutes for warm up.
5. Control the spark timing at a fixed degree. 6. Fix the biogas flow rate at demanded quantity. 7. Control the air flow rate at specific excess air ratio. 8. Collect the corresponding data, mentioned above. 9. Repeat the procedure for different excess air ratio. 10. Repeat the above procedure for different spark timing.
33
Chapter 4
Results and Discussion
This study is a continuous effort of Lin’s[4] and Huang’s[5] works. It carries out with three major modifications, which are the measurements of the detailed intake biogas constitutes and their concentrations, dehumidification of the water vapor in intake biogas and installation of the complete ignition system, consisting spark-plug pressure sensor, and rotary encoder to record the crank angle of piston cylinder.
The biogas used in this research was supplied from the anaerobic tank made of red plastic bag. The original biogas from the tank contains high concentration of H2S, around 4000ppm. It would corrode the engine
severely if without proper treatment. Therefore, an H2S removal system,
was built up by using biological process, which is environment and cost friendly. The removal rate of screened micro-organism could remove H2S
of biogas up to 99%. In other words, the H2S concentration in the biogas
was effectively reduced from 4000ppm to 50ppm.
4.1 Effect of Water Vapor of Intake Fuel
The desulfurized biogas passed a methane concentration analyzer, temperature with humidity transmitter and gas analyzer that the concentrations of CH4, O2, and CO2, temperature and relative humidity of
biogas can be measured. From the measurements, it found that the biogas comprised O2. It is impossible for the biogas containing O2 after the
anaerobic process, so the existence of O2 must be from the air, leaking
from atmosphere to the storage tank. According to the concentration of O2,
34
vapor of biogas with and without dehumidification can be derived by using Eq. (3.2) in Sec. 3.2.1. Since the temperature of intake biogas was 30°C, therefore, the relative humidities of intake biogases without and with dehumidification were 85.2% and 52.7%, respectively. Table 4.1 shows the details of biogas compositions.
Table4.1 Compositions of Biogas with and without Dehumidification without Dehumidification with Dehumidification
CH4 72% 72.2% CO2 18.6% 17.8% O2 1.09% 1.39% N2 4.1% 5.23% H2O 3.14% 1.9% Residues 1.07% 1.48%
From above table, there are two kinds of biogases due to an addition of dehumidifier (Sec. 3.1.4). Therefore, the respective stoichiometric air-fuel ratios based on the measured or deduced data are 5.57 (without dehumidification) and 5.31 (with dehumidification). Note that the maximum allowable total volume flow rate (sum of biogas and air flow rates) into the engine is about 2000L/min, therefore, the maximum air supply rate is limited by the biogas one. In other words, the experiments with the higher biogas flow rates carried out with a narrower range of air flow supply rates. So it restricted the maximum excess air ratio for each biogas supply rate.
35
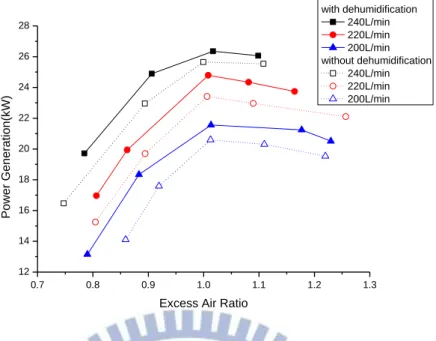
Figure 4.1 is the power generation rates as a function of excess air ratio with and without dehumidification. The detailed experimental values are given in the Table 4.2 a~f. In these tables, the measured results include the power generation, waste gas temperature and waste gas species concentrations (O2, CO2 and NOx). Besides, the thermal efficiency
deduced from measurements, described in Sec.3.2.3, is provided as well. It can be seen from Fig. 4.1 that the power outputs of dehumidified biogas are higher than those without dehumidification. Apparently, the power generations by dry intake biogas are better than those by untreated one. In general, the maximal power outputs occur at the excess air ratio approximately equal to 1.0 (stoichiometric condition). The maximum power outputs of biogas supply at 200, 220 and 240L/min after dehumidification with an excess air ratio of 1.00 are 21.55kW, 24.78kW and 26.35kW. In comparison with the corresponding ones without dehumidifying, the increases in power generation are 4.7, 5.9 and 2.7%, respectively.
The waste gas temperatures for different biogas supply rates as a function of excess air ratio are shown in Fig. 4.2. The higher biogas supply rate at fixed excess air ratio lead to the higher waste gas temperature. It is because more heat can be released during combustion as the biogas supply rate increases. The exhaust temperatures of dry biogas are higher than those of wet biogas at a specified excess air ratio. Also the maximum waste gas temperatures for the different biogas flow rates occur at λ~1.00.
There are two main reasons that power output is increased after dehumidification. First, from the composition of biogas (see Table 4.1.),
36
the methane concentration in dry biogas is higher. In other words, the water vapor in biogas acts as a diluent and it would damp down the reactions. Second, these data indicate that the dried intake biogas avoids the energy absorption by water vapor during combustion process. If the increase of biogas flow enthapy is due to the increase of methane concentration and the avertion of energy absorption by water vapor, then the biogas flow enthapy increasing rate can be defined as:
(4.1)
where , and can be measured and they refer to biogas flow rate, exhaust gas temperature and intake biogas temperature respectively. Thus, the biogas flow enthapy increase rates of biogas supply at 200, 220 and 240L/min after dehumidification with an excess air ratio of 1.00 are 0.79%, 1.17% and 1.27% respectively. Obviously, the higher biogas supply flow provides more enthapy after the dehumidification.
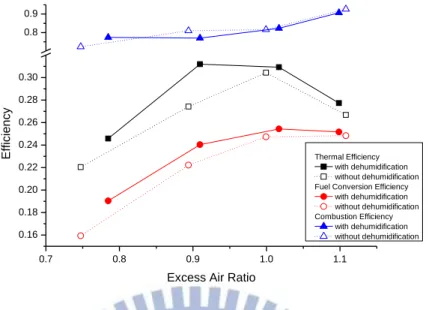
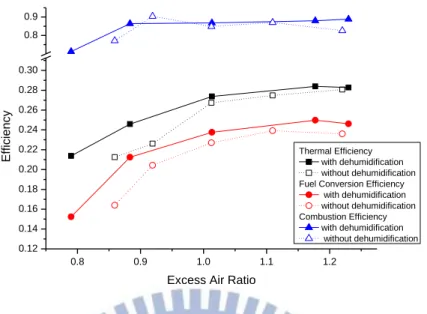
Figures 4.3a~c show the thermal, fuel conversion and combustion efficiencies as a function of excess air of 240, 220 and 200L/min biogas supply rates with and without dehumidification. These are deduced by Eqs. (3.12), (3.13) and (3.14) given in section 3.2.3. It can be seen from these three figures that the thermal efficiency is higher than fuel conversion efficiency. This is because not all the fuel energy supplied to the engine is released by the combustion process since the combustion usually is incomplete. Therefore, it is necessary to cosider the combustion efficiency for evaluating the thermal efficiency. The average of combustion efficiency of the engine is about 0.85. In other words, about
![Figure 1.1 Simple Carbon Cycle for Biogas [4]](https://thumb-ap.123doks.com/thumbv2/9libinfo/8499107.185102/76.892.136.764.110.971/figure-simple-carbon-cycle-for-biogas.webp)