BIOINFORMATICS
APPLICATIONS NOTE
Vol. 20 no. 18 2004, pages 3691–3693doi:10.1093/bioinformatics/bth428GeneNetwork: an interactive tool for
reconstruction of genetic networks using
microarray data
Chia-Chin Wu
1, Hsuan-Cheng Huang
1,2,∗, Hsueh-Fen Juan
3,4and
Shui-Tein Chen
1,3,5,∗1Institute of Biological Chemistry and Genomics Research Center, Academia Sinica, Taipei, Taiwan,2Institute of Bioinformatics, National Yang-Ming University, Taipei, Taiwan,3Department of Life Science, Institute of Molecular and Cellular Biology, Institute of Biochemical Sciences, National Taiwan University, Taipei, Taiwan, 4Department of Chemical Engineering, National Taipei University of Technology, Taipei, Taiwan and5ALPS Biotech Co., Ltd, Taipei, Taiwan
Received on November 12, 2003; revised on April 29, 2004; accepted on July 5, 2004 Advance Access publication July 22, 2004
ABSTRACT
Summary: Inferring genetic network architecture from time series data generated from high-throughput experimental technologies, such as cDNA microarray, can help us to under-stand the system behavior of living organisms. We have developed an interactive tool, GeneNetwork, which provides four reverse engineering models and three data interpolation approaches to infer relationships between genes. GeneNet-work enables a user to readily reconstruct genetic netGeneNet-works based on microarray data without having intimate knowledge of the mathematical models. A simple graphical user inter-face enables rapid, intuitive mapping and analysis of the reconstructed network allowing biologists to explore gene relationships at the system level.
Availability: Download from http://genenetwork.sbl.bc.sinica. edu.tw/
Contact: [email protected]; [email protected]. edu.tw
Supplementary information: Supplement documentation of algorithms for the four approaches is downloadable at the above location.
INTRODUCTION
Most biochemical relationships among genes, proteins and other organic substrates are known to be many-to-many, meaning that one component can have many functions and one function can be influenced by many components. To understand these complex relationships, the structure of a biological system, such as regulatory relationships of genes, needs to be identified first. Reverse engineering methods provide a good way to model genetic interactions as network
∗To whom correspondence should be addressed.
diagrams of interacting elements based on time-course gene-expression data generated from cDNA microarray exper-iments. The reconstructed genetic network can then be validated experimentally.
Because most genetic network models are mathematically and computationally complicated, a full understanding of the logic and complex behavior of genetic networks will require the development of tools for the computational and visual exploration of complex networks. Although several previ-ous attempts have been made to visualize pathways from prior known knowledge and to simulate system dynamic processes in software packages (Breitkreutz et al., 2003; Dahlquist et al., 2002; Shannon et al., 2003), none of them allow users to infer genetic networks from experimental gene-expression data using reverse engineering approaches. This paper presents a computational and user-friendly soft-ware tool, GeneNetwork, to visually reconstruct genetic networks from gene-expression data using reverse engineer-ing models. It can be used by biologists with only a minimal amount of mathematical training, yet gives them the power to explore a wide range of sophisticated questions about genetic networks.
OVERVIEW OF THE SOFTWARE
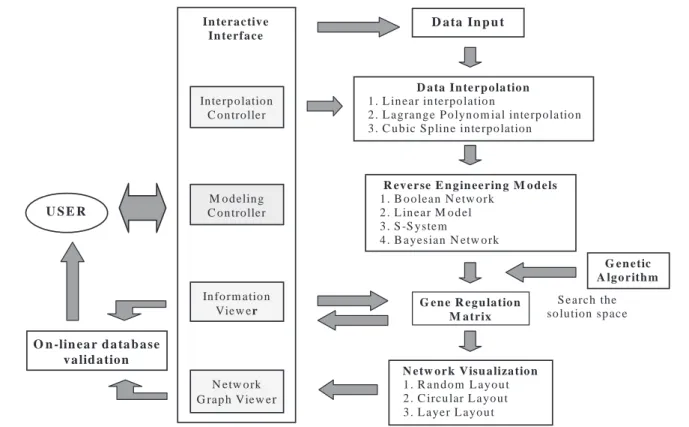
The architecture of GeneNetwork, written in C++, is outlined in Figure 1. The work flow for GeneNetwork is as follows: (1) input experimental data in tab-delimited text format; (2) interpolate data through the Interpolation Controller if the number or sets of experimental data points are insufficient to initiate the inference calculations; (3) implement reverse engineering inference approaches through the Modeling Con-troller to generate the gene regulation matrix that describes
C.-C.Wu et al. O n -lin ea r d a ta b a se v a lid a tio n D a ta In p u t D a ta In te r p ola tio n 1 . L in ea r in terpo latio n
2 . L a grange P o lyn o m ial inte rp ola tio n 3 . C u b ic S p lin e in terpo lation
R ev e r se E n g in ee rin g M o d e ls
1 . B o o lea n N etw o rk 2 . L in ear M o d el 3 . S -S yste m
4 . B a yesia n N etw o rk
N etw o r k V isu a liza tio n
1 . R a n d o m L ayo u t 2 . C ircu lar L ayo u t 3 . L aye r L ayo u t G e n e R eg u latio n M a trix G e n e tic A lg o rith m S e arch the so lution sp ace In terp o lation C o n troller In tera c tiv e In terfa ce M o d elin g C o n troller In fo rm atio n Vie w er N etw o rk G ra p h View er U S E R
Fig. 1. The architecture of GeneNetwork.
how genes regulate each other; (4) automatically draw the network for visualization, based on the regulation matrix; (5) compare the inferred intuitive network with on-line data-bases such as KEGG (Kanehisa et al., 2004), based on the information from the Network Graph Viewer and the Informa-tion Viewer; and (6) review the proposed sets of experiments and generate hypothesis. These high-level capabilities of GeneNetwork are described as follows.
Interpolation Controller
The required minimum number of data time points depends on the number of variables in the mathematical model for genetic network inference. If the time points of experimental data are insufficient to fulfill the requirement of the specified model, the network analysis can be initiated by interpolation of the time series data points. The Interpolation Controller provides three selections of data interpolation approaches: linear, Lagrange polynomial and cubic spline interpolation (Constantinides and Mostoufi, 1999).
Modeling Controller
Various reverse engineering algorithms have been used to model genetic regulatory networks (de Jong, 2002). Gene-Network offers four different inference models to extract the ‘gene regulation matrix’ from the gene expression data: (1) the linear model (D’haeseleer et al., 1999) is a continu-ous method that uses linear ordinary differential equations to
describe the system; (2) the S-system (Kikuchi et al., 2003) is an approximation of traditional rate laws with a uniform type of non-linear ordinary differential equation in which the component processes are characterized by the power-law functions; (3) the Boolean network (Liang et al., 1998) is a logical description in which variables and functions (the relationships between the components) are simply presen-ted as ON or OFF; and (4) the dynamic Bayesian network (de Jong, 2002) stochastically models causality between genes over time series data. For the latter three models, the genetic algorithm is applied to effectively search for the optimal point in the large solution space and to learn network structure (Repsilber et al., 2002). Users can change the parameters in the four approaches through the Modeling Controller.
Network Graph Viewer/Information Viewer
To extract valuable information from the gene regulation matrix, GeneNetwork embraces several network visualization layouts. A network diagram is presented with nodes corres-ponding to genes and edges indicating relations between the genetic network components. Information on the network structure and genes, from the gene regulation matrix and input information, can be shown on the Information Viewer. Clicking on any node reveals the biological processes that involve the selected gene and its relation to others. GeneNet-work is fully customizable and allows users to define personal settings to generate interaction networks by manipulating
GeneNetwork
several graphical setting options, such as linkage changes, gene selections, gene searches, font and graph settings, etc.
DISCUSSION
The four inference models in GeneNetwork have different advantages and weaknesses and users can select the appropri-ate model based on their requirements. The linear model is a gross simplification for most biological systems but it offers an easy method to infer genetic network; the assumptions may be unrealistic. The S-system can capture the non-linear system dynamics, although the method exerts large computational cost to search for the optimal solution. In Boolean network model, the regulatory control of gene expression is expressed by logical rules, which allows large-scale genetic networks to be analyzed in an efficient way. The advantages of the dynamic Bayesian network include the ability to model stochasticity, to incorporate prior knowledge, and to handle hidden vair-ables and missing data in a principled way. Nevertheless, determining the optimal network structure of Bayesian net-works is an NP-hard problem. Furthermore, discretization of gene expression in both Boolean and Bayesian models would induce information loss.
In the Supplementary material, we provide detailed
descriptions of the four methods and an application of the Saccharomyces cerevisiae cell-cycle gene-expression data (Spellman et al., 1998) to GeneNetwork. Many of the inferred gene relations are known to be involved in the S.cerevisiae cell-cycle pathway.
FUTURE WORKS
The future works will focus on the automatic integration with on-line databases to provide more up-to-date genome informa-tion to a user while using GeneNetwork. In addiinforma-tion, the visualization capabilities for large-scale network layout will be enhanced.
ACKNOWLEDGEMENT
We thank John Y. Lin for revising the manuscript. We grate-fully acknowledge the support of the National Research
Program for Genomic Medicine of National Science Council, Taiwan (NSC 91-3112-13-001-002 and NSC 92-3112-B-027-001).
REFERENCES
Breitkreutz,B.J., Stark,C. and Tyers,M. (2003) Osprey: a network visualization system. Genome Biol., 4, R22.
Constantinides,A. and Mostoufi,N. (1999) Numerical Methods for
Chemical Engineers with Matlab Applications. Prentice-Hall Inc., NJ.
Dahlquist,K.D., Salomonis,N., Vranizan,K., Lawlor,S.C. and
Conklin,B.R. (2002) GenMAPP: a new tool for viewing and ana-lyzing microarray data on biological pathways. Nat. Genet., 31, 19–20.
D’haeseleer,P., Wen,X., Fuhrman,S. and Somogyi,R. (1999) Linear modeling of mRNA expression levels during CNS development and injury. Pac. Symp. Biocomput., 4, 41–52.
de Jong,H. (2002) Modeling and simulation of genetic regulatory systems: a literature review. J. Comput. Biol., 9, 67–103. Kanehisa,M., Goto,S., Kawashima,S., Okuno,Y. and Hattori,M.
(2004) The KEGG resource for deciphering the genome. Nucleic
Acids Res., 32, 277–280.
Kikuchi,S., Tominaga,D., Masanori,A. and Tomita,M. (2003) Dynamic modeling of genetic networks using genetic algorithm and S-system. Bioinformatics, 19, 643–650.
Liang,S., Fuhrman,S. and Somogyi,R. (1998) REVEAL: a general reverse engineering algorithm for inference of genetic network architectures. Pac. Symp. Biocomput., 3, 18–29.
Repsilber,D., Liljenstrom,H. and Andersson,S.G. (2002) Reverse engineering of regulatory networks: simulation studies on a genetic algorithm approach for ranking hypotheses. Biosystems,
66, 31–41.
Shannon,P., Markiel,A., Ozier,O., Baliga,N.S., Wang,J.T.,
Ramage,D., Amin,N., Schwikowski,B. and Ideker, T. (2003)
Cytoscape: a software environment for integrated models
of biomolecular interaction networks. Genome Res., 13,
2498–2504.
Spellman,P.T., Sherlock,G., Zhang,M.Q., Iyer,V.R., Anders,K., Eisen,M.B., Brown,P.O., Botstein,D. and Futcher,B. (1998) Com-prehensive identification of cell cycle regulated genes of the yest
Saccharomyces cerevisiae by microarray hybridization. Mol. Biol. Cell, 9, 3273.