A FRAMEWORK OF PERFORMANCE EVALUATION AND ERROR
ANALYSIS METHODOLOGY FOR SPEECH UNDERSTANDING SYSTEMS
Bor-shen Lin, Lin-shan Lee
Department of Electrical Engineering, National Taiwan University
Taipei, Taiwan, Republic of China
e-mail: bsl@speech .ee.ntu.edu.tw
ABSTRACT
With improved speech understanding technology, many successful working systems have been developed. However, the high degree of complexity and wide variety of design methodology make the performance evaluation and error analysis for such systems very difficult. The different metrics for .individual modules such as the word accuracy, spotting rate, language model coverage and slot accuracy are very often helpful, but it is always difficult to select or tune each of the individual modules or determinr: which module contributed to how much percentage of understacding errors based on such metrics. In this paper, a new frmework for performance evaluation and error analysis for speech understanding systems is proposed based on the comparison with the ‘best-matched’ references obtained from the word graphs with the target words and tags given. In this framework, all test utterances can be classified based on the error types, and variour. understanding metrics can be obtained accordingly. Error analysis approaches based on an
error plane are then proposed, with which the sources for understanding errors (e.g. poor acoustic recognition, poor language model, search error, etc.) can be identified for each utterance. Such a framework will be very helpfd for design and analysis of speech understanding systems.
1. INTRODUCTION
With improved speech understanding technology in recent years, many spoken dialogue systems have been successfully developed [l]. In general, almost each system is associated with a performance evaluation and error analysis scheme. For example, the speech recognizers and language understanding modules were very often evaluated by different metrics [2], such as the spotting rate, the word accuracy, the language model coverage, the slot accurac!; etc., but it’s always difficult to select among the many available acoustic/linguistic processing modules to achieve the best understanding results, and determine which module contributed to how much percentage of which type of understanding errors based on such metrics. This is apparently due to the high degree of complexity of such speech understanding systems and the wide variety of design methodology and system architecture. Some of the difficulties also come from the wide variety of application tasks of such systems. Take the example below. Three acoustic recognition modules are considered for the acoustic front end of a speech understanding system: module A with word accuracy 92%, module B with keyword spotting rate 90% and false alarm rate 7%, and module C with key phrase spotting rate 95% and false alarm rate 24%. All these metrics are helpful, but none of them
can describe how the acoustic modules A, B or C can perform within a very complicated speech understanding mechanism and which one should be selected. For example, all the three modules can generate a word graph for each utterance for understanding purposes, but the characteristics of a word graph involved in the understanding processes include not only the word accuracies or spotting rates, but many other factors such as the discriminating functions of the acoustic scores, and the accuracies of the time spans for the word candidates in the graph. The interaction among such characteristics with the following language understanding mechanism is another key. As a result, the performance metrics for each individual module may not be very helpful in determining the final understanding performance. Also, the analysis of the understanding errors and the improvement of system performance based on error analysis become very difficult as well for the same reason.
In this paper, a new framework for performance evaluation and error analysis for speech understanding systems is proposed based on the comparison with the ‘best-matched’ references obtained from the word graphs with the target words and tags given. In this framework, all test utterances can be classified based on the error types, and various understanding metrics can be obtained accordingly. Error analysis approaches based on an error plane are then proposed, with which the sources for understanding errors (e.g. poor acoustic recognition, poor language model, search error, etc.) can be identified for each utterance. Such a framework will be very helpful for design and analysis of speech understanding systems.
2.
THE PROPOSED FRAMEWORK AND
THE BEST-MATCHED REFERENCES
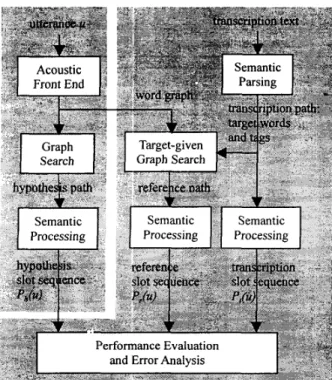
In a speech understanding system as shown on the left-hand side of Figure 1, each input utterance U is usually first recognized byan acoustic front end to produce a set of promising word candidates located on different time spans, or a word graph. Some graph search algorithms such as the A* search is then performed on the graph based on some language models to find the desired hypothesis path’ on the graph. Such a hypothesis path may contain different types of errors due to deleted, substituted or inserted words, poor acoustic or language modeling scores, and wrong time-alignments in the word graph. This hypothesis path is then transcribed into a hypothesis slot sequence or the understanding output (denoted as P,(u) in Figure 1) by some semantic processing approaches. The evaluation and error analysis method proposed in this paper is shown on the right -
I The word ‘path’ here may represent a word sequence as in the N-best interface or a tag sequence with associated parsing trees.
Semantic
I
ProcessingFigure 1. The proposed framework for performance evaluation and error analysis methodology
hand side of Figure 1. The transcribed text for the input utterance is first parsed by some semantic parsing algorithm to produce a transcription path. This path may include all the target words and tags. These target words and tags are then directly applied on the word graph obtained in the speech understanding system on the left-hand side of the figure to perform the target-given graph search, such that all the target words can be obtained as long as they are located in the word graph well. The output, the reference path as shown in the middle of Figure 1, is therefore the ‘upper bound’ of the hypothesis path because all the target words and tags are given. This reference path together with the transcription path obtained directly from the transcription text then go through the semantic processing to produce the reference slot sequence (P,(u) in Figure 1) and the transcription slot sequence (P,(u) in Figure 1). Again, the reference slot sequence P,(u) is the ‘upper bound’ of the hypothesis slot sequence Ph(u). All the evaluation and error analysis proposed here in this paper is then based on the comparison among the three slot sequences: the hypothesis slot sequence P,,(u), the reference slot sequence P,(u), and the transcription slot sequence PI@).
In order to analyze how the defected word graphs actually constrained the understanding accuracy, the concept of ‘best- matched’ references is introduced here which includes the ‘upper bound’ reference path generated by the target-given graph search shown in the middle of Figure 1, and the ‘upper bound’ reference slot sequence P,(u) after the semantic processing. In principle, the ‘best-matched’ reference path is the ‘best obtainable’ path in the word graph prior to semantic processing, and the ‘best- matched’ reference slot sequence P,(u) gives the ‘best obtainable’ understanding of the utterance given the word graph, because in both cases the knowledge about the transcription path has been given. The above description can be summarized with
the following inequality:
A.dph(u), p~(u)) A.dpr(u), Br
where A.JP,@), PJ(u)) denotes the slot accuracy by comparing the slots of
P,(u)
to those of P,(u), and B, is the reference bound indicating the degree of understanding achievable from the given word graph or some kind of metric for ‘the quality of the word graph’ in terms of understanding. Such a metric is sometimes very useful because it provides more information than the acoustic metrics alone. For example, different acoustic front ends can be compared with this metric for understanding purposes. Also, with the proposed approach as shown in Figure 1, more detailed error analysis in terms of understanding performance also becomes possible as will be given below.Figure 2. Utterance clustering according to the relationships of the slot sequences P,,(u),
P,(u),
and P,(u)3. UTTERANCE CLASSIFICATION
Based on the relationships among the three slot sequences, P,,(u), P,(u), and P,(u) for each utterance, all the utterances can be classified into seven different clusters, as shown in Figure 2. The relationship, ‘P,(u)=
PJ(u)’ represents ‘completely-matched’, i.e., all the slots of P,(u) and P,(u) are identical, the relationship‘P,(u)
C PJ(u)’ represents ‘partially-matched’, i.e., all slots of P,(u) are also slots of P,(u) but the reverse is not true, and the relationship ‘P,(u)d
PJ(u)’ represents ‘mismatched’ with insertion or substitution errors, i.e., some slots ofP,(u)
are not slots of PJ(u). The relationships ‘partially-matched’( C
), and ‘mismatched’( d
) are separately considered, because the insertion or substitution errors (mismatched) usually lead to misunderstandings which either make the dialog fail or need to be corrected by more and complicated dialogs, while pure deletion errors (partially-matched) usually only lead to incomplete understanding. The classification processes in Figure 2 have two layers. For each utterance U the reference slotsequence PJu) and transcription slot sequence PI@) are first compared in the upper layer. If P,(u) P,(u), ‘the quality of the word graph’ is really poor. If P,(u)
C
P,(u) or P,(u)=
P,(u), Ph(u) and P,(u) are then compared in the lower layer. The seven utterance clusters obtained in Figure 2 is thus:s,+sl
‘G8\,,
>sa+s,
>O Region 1 : between Sa+S, =O and S, =Opoor acoustic score
A,={u: P,(u) B,={u: P,(u) A,=&: P,(u) B,=(u: P,(u) . A,={u: P,(u) C,={u: P,(U)
e,=@:
P,(u) Region I‘\,
Region 4 Region 2: between Sa=O and S, =Opoor acoustic and language- modeling scores
Region 3: between S,+S, =O and
So
=Os,
=O poor language-modeling scoresearch errors Region 4: Sa+S, >O
.I I ,
In this way, different types of errors can be well classified. For example, the cluster A , consists of all utterances that always lead to misunderstandings due to defected word graphs. The cluster B,, on the other hand, consists of the utterances for which complete- understanding is in principle possible (P,(u)
=
P,(u)), but notachieved (Ph(u) C P,(u)) because of poor acoustic and linguistic scores. Based on this clustering scheme, we can further define the following sets:
scrrmp=
c,
(set of complete-understanding;)S,,= B,+ B,+ C, (set ofpartial-understanding) S,,,,= A , + A,+ A, (sei ofmisundersiandingj S,,,r= Sic,mp+ S,, (set of correct understanding) Se,= S,,, +Sp,.,= A,+ A,+ A,+B,+ B,+ C, (error set) Furthermore, some meaningful understanding metrics can be defined as follows.
N ( s c t l n l p )
R romp = complete understanding rate
N ( S A l l
R parr = ( parr ) partial understanding rate
N ( S A I I )
R . = mis ( smi” ) misunderstanding rate
N ( S A I / )
R w r r = ( sct’rr ) correct understanding rate
N ( S A I I ) where N
( s
j,’
is the numbers A N
is the union of all seven clustersof utterances in
s
J . The errors occurring in the different clusters in the error set S,,can be further analyzed, which will be discussed in the next section.
4.
ERROR ANALYSIS
Unlike the error analysis usually performed in large vocabulary speech recognizers [3], the analysis for understanding errors here emphasizes on the reference path for comparison rather than the transcription path. In other words, instead of paying great attention to analyzing the differences between the hypothesis path and the transcription path, here in this approach the
Region 3’\. Region 2
sa
=Odifferences between the hypothesis path and the ‘upper bound’ reference path are analyzed with more attention. This is because the function of the graph search here is not to find the transcription path, but instead to achieve best possible understanding out of the given word graph. This is also the way to separate the effect of a defected word graph from other understanding mechanism. First of all, two clusters A , and C, should be used to analyze the acoustic front end module and/or reestimate the acoustic models, because A , is the set with seriously defected word graphs, and the graph search performed on utterances in C, are in fact completely correct. Excluding the set C , with completely correct processing, further error analysis can be performed on the four clusters of utterances: A,, A,, and B,, B,. Two very useful parameters Sa and S, are first defined for each utterance as follows:
where So,, and S,, are the acoustic recognition and language- modeling scores for the hypothesis path respectively, and Sa,, and
S,, are the acoustic recognition and language-modeling scores of the reference path respectively. By normalizing with the scores for the hypothesis path, the scores
Sa
and S, represents the differences between the hypothesis path and the ‘upper bound’ path in terms of the graph search. They have also been normalized in such a way that the values of Sa and S, are comparable and additive. Using (So,Si)
as the coordinates, each utterance in the set A,, A,, B,, B, can be located on an error plane as shown in Figure 3. Different types of errors can be easily identified by the error regions defined on the error plane in Figure 3. Region 3 in Figure 3, for example, is the region enclosed by the lines Sa+ S, =O and Sa =0, is the region in which the reference path has a better acoustic score (Sa XI), but loses in the total score(So
+ S, 4) due to poor language-modeling score. Therefore, the utterances located into region 3 can be used to update the language models, etc. In this way, all utterances with understanding errors can be properly analyzed, and the real source causing each of the errors can be easily identified. It should be pointed out that the language models should be updated by not only the transcription texts but the reference paths, so as to improve the grammar coverage.sa =
-
=-
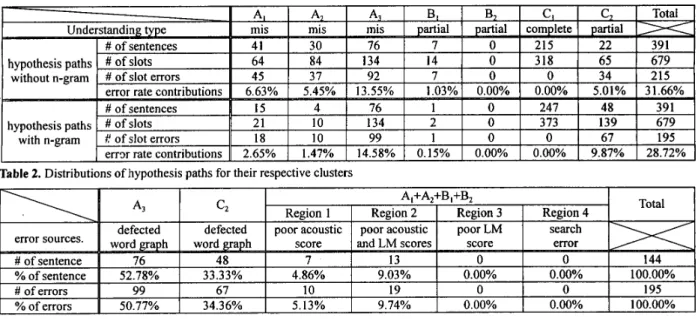
S , hTable 1. Understanding rates and slot accuracy for the example experiment
Table 2. Distributions of hypothesis paths for their respective clusters
Table 3. Error analysis for the data with n-gram language models
5. AN EXAMPLE
The above evaluation and error analysis scheme was applied to a train ticket reservation system, which provides the user with a spoken dialogue interface in Mandarin Chinese such that the train schedule information retrieval and ticket reservation can be easily performed with voice. The acoustic front end is a key phrase spotter [4] which generates key phrase graphs, while the language understanding module includes a hierarchical tag-graph search [5], in which the n-gram language models are used and the tag sequence with associated parsing trees is generated for semantic processing. 391 utterances in 45 real dialogs generated by four male and four female speakers were used for the test in the development phase of the system. The various understanding rates as defined in section 3 together with the slot accuracy for the hypothesis paths (with and without language models) and the reference paths are shown in Table 1. As shown in the table, the 74.67% reference path slot accuracy constrains the overall sentence understanding rate to 80.56%. The improvement of slot accuracy for the hypothesis paths by n-gram language models, from 68.34% to 71.28%, is not significant because the defected word graphs have seriously limited the functions of the language models, although the slot accuracy of 71.28% is not too far from the ‘upper bound’ of 74.67%. The detailed distributions of all utterances in different clusters and corresponding test data are shown in Table 2. The n-gram language models, as shown in the table, have reduced the numbers of errcm in the clusters A,, A, and B,, while increased that in A,. This is because the utterances in cluster A3 with seriously destroyed word graphs get no benefits from the n-gram constraints. Furthermore, the reduction of error sentences in the clusters A,, A, and B, leads to the increase of correct and partial understanding sentences in the clusters C, and C,. Finally, the sources causing the understanding errors with n-gram language models applied are analyzed in Table 3. It can be found in Table 3 that in this case 50.77% of the understanding errors come from defected word graphs (A3), which lead to f a t 4 misunderstanding errors, while 34.36% of the understanding errors come from imperfect word graphs (C2),
which are not very serious because the ‘upper bound’ reference paths with partial understanding are achieved. The other 14.87% of the understanding errors are due to poor acoustic and/or language modeling scores. Though no search errors are observed in this case, the approach proposed here is able to handle them if any search errors are identified.
6. CONCLUDING REMARKS
It’s really difficult to evaluate a speech understanding system and analyze the different types of errors precisely. The traditional metrics developed for speech recognition are helpful but not necessarily able to provide a direct insight into the understanding mechanism, while the slot accuracy can’t indicate how and why the understanding errors occurred. In this paper, a best-matched path is derived from a target-given graph search, and a framework for performance evaluation and error analysis is proposed accordingly. This framework has the potential to become powerful tool for the design, analysis and evaluation of speech understanding systems.
7. REFERENCES
[l] Victor Zue, etc., “From Interface to Content: Translingual Access and Delivery of On-line Information”, Proc. Eurospeech, 2227-2230, 1997.
[2] Harald Aust, Hermann Ney, “Evaluating Dialogue Systems Used in Real World”, Proc. ICASSP, Vol. 2, 1053- 1056, 1998.
Lin Chase, “Blame Assignment For Errors Made By Large Vocabulary Speech Recognizers”, Proc. Eurospeech, 8 15-81 8,
1997.
Berlin Chen, etc., “A*-Admissible Key-Phrase Spotting with Sub-syllable Level Utterance Verification”, to appear in Proc. ICSLP, 1998.
Bor-shen Lin, etc., “Hierarchical Tag-Graph Search For Spontaneous Speech Understanding in Spoken Dialog Systems”, to appear in Proc. ICSLP, 1998.
[3]
[4]
[5]