191
Community Structure and Functional Organization of Aquatic
Insects in an Agricultural Mountain Stream of Taiwan:
1985-1986 and 1995-1996
Sen-Her Shieh* and Ping-Shih Yang**
Department of Entomology, National Taiwan University, Taipei, Taiwan 106, R.O.C. (Accepted March 2, 2000)
Sen-Her Shieh and Ping-Shih Yang (2000) Community structure and functional organization of aquatic insects in an agricultural mountain stream of Taiwan: 1985-1986 and 1995-1996. Zoological Studies 39(3): 191-202. Changes in stream water and habitat quality of Chichiawan Stream, which flows through Wulin Farm in central Taiwan, were examined using community structure and functional organization of aquatic insects at 4 sites in 1985-1986 and 1995-1996. Long-term records of water chemistry for the study area indicate that water quality in 1995-1996 had not degraded as compared with data in 1987-1988. It was found that there were significant differences in the number of taxa and number of individuals per sample unit for samples at all sites combined between 1985-1986 and 1995-1996. In general, the number of taxa and number of individuals per sample unit were higher in 1985-1986 than in 1995-1996 at the 4 sites. Higher relative abundances of Baetis spp., Rhithrogena ampla, Cincticostella fusca, and Uenoa taiwanensis were found in 1985-1986 compared to 1995-1996, suggesting that the substrate quality of the stream had deteriorated at sites located in agricultural areas. Similar results were found between the taxonomic and functional feeding group analyses when the percentage similarity analysis was used. The functional organization and community composition of aquatic insects at sites 1 and 2 in 1995-1996 were similar to those at site 4 in 1985-1986. Site 4 is located downstream of the confluence between Chichiawan Stream and Yousheng Stream where the stream watershed has been developed for agri-cultural land use. Principal component analysis (PCA) indicated that, in addition to the substrate quality of the stream, water temperature, dissolved oxygen, conductivity, and ammonia were the most important physico-chemical variables shaping the aquatic insect community structure in the study stream reach. The study sites in agricultural areas had poorer stream water and habitat quality. The raw cropping of orchards and vegetable farms greatly increased soil erosion and suspended solids inputs to the stream which may have been harmful to the aquatic insect communities.
Key words: Biological monitoring, Agricultural activities, Functional feeding groups, Chichiawan Stream.
*Current address: National Museum of Natural Science, No. 1 Kuan-Chien Rd., Taichung, Taiwan 404, R.O.C.
**To whom correspondence and reprint requests should be addressed. Tel: 886-2-23627023. Fax: 886-2-23632699. E-mail: senher@mail. nmns.edu.tw, psyang@ccms.ntu.edu.tw
*
iological monitoring of aquatic insects can provide important insights into changes in stream water and habitat quality (Rosenberg and Resh 1993). Benthic aquatic insects are sensitive indica-tors of environmental changes in streams because they express long-term changes in water and ha-bitat quality rather than instantaneous conditions (Johnson et al. 1993). Recently, many techniques, protocols, and indices have been developed to moni-tor stream quality using changes in species com-position, diversity, and functional organization ofaquatic insects (e.g., Hilsenhoff 1988, Plafkin et al. 1989, Lenat 1993). These changes are valuable in demonstrating the effects of anthropogenic distur-bances on stream ecosystems. For example, Hsu and Yang (1997) pointed out that Hilsenhoffs family-level biotic index was a reliable method for assessing water quality of the Keelung River, northern Taiwan. Biological monitoring is generally used to exam-ine existing stream conditions. Applying biological monitoring to comparative historical and contempo-rary data can provide insights into how benthic
com-N W S E Check dam Check dam Site 1 Site 2 Check dam Check dam Check dam Site 3 Chichia w an Stream Hsuehshan Stream Check dam Check dam Check dam Site 4 Tachia Riv er 0 0.5 1.0 km Yousheng Stream Study area Taiwan 50 km 23°N 25°N 121°E 122°E
munities have responded to long-term anthropo-genic changes in a stream ecosystem or its catch-ment (Grubaugh and Wallace 1995). The stream reach of the Chichiawan Stream in the Wulin Farm area is the last refuge of the Formosan landlocked salmon (Oncorhynchus masou formosanus) (Tsao 1988 1995). The salmon was listed as an endan-gered species by the Taiwanese government in 1984. Habitat degradation due to agricultural deve-lopment and dam construction led to severe de-creases in the salmon population and further re-duced salmon distribution in the watershed (Tsao 1995). To protect the habitat of the Formosan salmon, programs to monitor stream quality using aquatic insects were conducted in Chichiawan Stream in 1985-1986 and 1995-1996. The objec-tives of this study were to examine the extent the stream environment had been modified, naturally or anthropogenically, during this period, and to assess changes in the community structure and functional organization of aquatic insects.
MATERIALS AND METHODS Study area
Sampling sites were established on Chichiawan Stream in the Wulin Farm, upstream of the Tachia River, in central Taiwan (Fig. 1). The stream origi-nates from 3 mountains: Tao Mountain (3324 m), Chihyu Mountain (3301 m), and Pingtien Mountain (3536 m). The stream is about 15.3 km long and has a drainage area of 76 km2. The stream basin has an annual precipitation of about 1607 mm, with the high-est precipitation in September and the lowhigh-est in November. Typhoons often occur in summer or fall and lead to floods. Local air temperatures historically vary between 8 and 29 °C (Wang 1989). Fifty per-cent of the river basin has been developed for agri-cultural purposes (Tsao 1995). The west bank of the stream reach has been subjected to intensive agri-cultural development since the 1960s. Water from the stream is diverted for irrigation throughout the entire year. Orchards (e.g., apple, peach, and pear) and vegetable farms (e.g., cabbage and spinach) are located throughout the basin. These orchards and vegetable farms are located adjacent to the stream in areas where slopes are very steep (Lin and Chang 1990). Furthermore, this area is not only profitable for producing fruits and vegetables, but is also a popular tourist site receiving more than 200 000 tour-ists a year (Lin and Chang 1990). The great number of tourists affects water quality through sewage
efflu-ents from hotels.
Four sampling sites were chosen based on their location relative to agricultural areas (Fig. 1). Sites 1 and 2 are located upstream of major agricultural areas. The sampling area at site 1 is a riffle/run with a substrate of boulders, cobbles, gravel, and sand. Site 2 is located upstream of a check dam where a pool is formed, and the substrate consists mainly of sand with a few cobbles. Site 3 is in an agricultural area. The substrate composition at site 3 is similar to that of site 1. Site 4 is located downstream of a do-mestic sewage effluent from a hotel and the confluence of Chichiawan Stream and Yousheng Stream where the stream basin has been developed for agricultural land use. The substrate composition at this site is primarily cobbles, gravel, and sand. All sampling sites have open canopies.
Benthic samples
A Surber sampler (area = 50 × 50 cm2, mesh size = 250 µm) was used to collect 3 samples of benthic aquatic insects at each sampling site 9 times per year from March 1985 to February 1986 and
Fig. 1. Location of Chichiawan Stream and the 4 sampling sites in central Taiwan. Arrows indicate direction of stream flow.
from November 1995 to October 1996. The samples were taken during the same months in the 2 sam-pling years. Three samples were taken from differ-ent subsites. Two were taken near the banks and 1 from near the center between the 2 banks. The aquatic insects were picked from the samples and were preserved in 75% ethanol in the field. In the laboratory, all aquatic insects were identified using Kawai (1985), Wong (1987), Kang (1993), Kang and Yang (1994a, b), and Merritt and Cummins (1996). Chironomidae were not identified further. All taxo-nomic identifications and the numbers of organisms in each taxon were recorded. The functional feeding groups of these aquatic insects were determined by following Merritt and Cummins (1996). Chirono-midae were not used in this analysis because the level of identification was not sufficient to determine functional feeding groups.
Physicochemical variables
Physicochemical variables of stream water quality were not available in 1985-1986. Since 1995, the physicochemical variables of stream water qua-lity have been measured by Chen (1995) at 5 sites in the study stream reach. However, there were only 2 sites (sites 1 and 3) at which both benthic samples were taken and physicochemical variables were measured. Ten physicochemical variables were measured monthly at sites 1 and 3 in 1995-1996 (Table 1). The methods used to produce these vari-ables are described by Chen (1995). In the present study, therefore, only the physicochemical variables at sites 1 and 3 were included in the analysis. Data analysis
Wilcoxon signed rank test (Cody and Smith 1997) were used to compare differences in numbers of individuals per sample unit, numbers of taxa, Hilsenhoffs family-level biotic index (FBI), and rela-tive abundance of each functional feeding group between the 2 sampling times. The calculation of Shannon-Weaver diversity was based on Ludwig and Reynolds (1988), and FBI on Hsu and Yang (1997). Taxonomic and functional feeding group re-lationships among the 4 sampling sites over the 2 sampling periods were examined using percentage similarity analysis (Ludwing and Reynolds 1988). The use of functional feeding groups circumvents problems with taxonomic identification (Cummins 1974), and the distribution patterns of functional feeding groups reflect resource distribution and use and facilitate the understanding of organic matter
processing in stream ecosystems (Vannote et al. 1980). A percentage similarity matrix was con-structed based on relative abundance at the 4 sam-pling sites, and a dendrogram was generated using the centroid strategy index (Ludwig and Reynolds 1988). Principal component analysis (PCA) was used to examine the site-water quality relationship and to relate aquatic insect distribution to gradients in physicochemical variables. Forward selection of physicochemical variables was used to ascertain the minimal set of variables that explain the species data. The statistical significance of a variable was determined by means of a Monte Carlo permutation test. The procedures were conducted with the com-puter software CANOCO 3.12 (ter Braak 1988 1990). However, since the data of physicochemical variables were incomplete, this analysis was only done on the data set of sites 1 and 3 in 1995-1996. In this analysis, density data were log10(x+1) trans-formed.
RESULTS
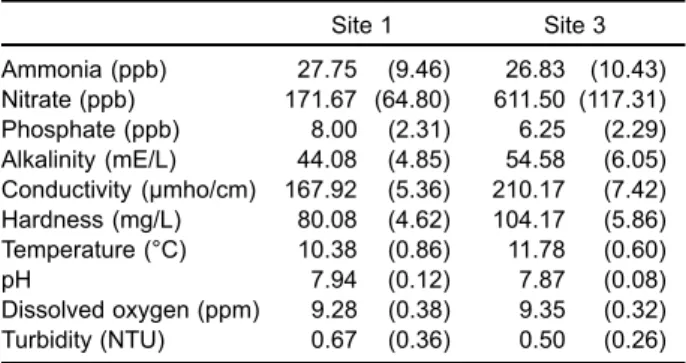
Mean values of selected physicochemical vari-ables at sites 1 and 3 in 1995-1996 are given in table 1. Concentrations of nitrate at site 3 were obviously higher than those at site 1, but the concentrations of ammonia and phosphate did not differ between sites 1 and 3. Conductivity and hardness values were higher at site 3 than at site 1.
A total of 40 insect taxa was collected during the periods 1985-1986 and 1995-1996 (Table 2). Tricho-ptera were the most diverse with 13 taxa; Ephemer-optera had 9 taxa. The number of taxa for the other orders was: 6 (Plecoptera), 7 (Diptera), 3 (Coleop-tera), and 2 (Odonata). At the 4 sites, the dominant
Table 1. Mean values of physicochemical variables at sites 1 and 3 on Chichiawan Stream from Novem-ber 1995 to OctoNovem-ber 1996. NumNovem-bers in parentheses are standard errors (n = 12)
Site 1 Site 3 Ammonia (ppb) 27.75 (9.46) 26.83 (10.43) Nitrate (ppb) 171.67 (64.80) 611.50 (117.31) Phosphate (ppb) 8.00 (2.31) 6.25 (2.29) Alkalinity (mE/L) 44.08(4.85) 54.58 (6.05) Conductivity (µmho/cm) 167.92 (5.36) 210.17 (7.42) Hardness (mg/L) 80.08 (4.62) 104.17 (5.86) Temperature (°C) 10.38(0.86) 11.78 (0.60) pH 7.94 (0.12) 7.87 (0.08) Dissolved oxygen (ppm) 9.28(0.38) 9.35 (0.32) Turbidity (NTU) 0.67 (0.36) 0.50 (0.26)
taxa of Trichoptera were Stenopsyche marmorata, Rhyacophila nigrocephala, and Uenoa taiwansis. The numerically predominant taxa shifted from U. taiwansis at site 1 to R. nigrocephala at site 4. Ephemeroptera taxa were dominated by Baetis spp., Baetiella bispinosa, and Rhithrogena ampla at each of the 4 sites. For Plecoptera, Neoperla spp. were
the most numerous taxa at the 4 sites. The most dominant taxa of Diptera were Chironomidae. In addition, four taxa (Caenis sp., Lanthus sp., Pleco-trocnemia sp., and Melanotrichia sp.) were not found in the samples in 1995-1996, and only 1 taxon (Hybomitra sp.) was not found in the samples in 1985-1986 (Table 2).
Table 2. Relative composition (%) of the total aquatic insect fauna at each site of Chichiawan Stream in 1985-1986 and 1995-1996
Site 1 Site 2 Site 3 Site 4
Abbr. 95-96 85-86 95-96 85-86 95-96 85-86 95-96 85-86 Ephemeroptera
Afronurus floreus Afro 1.45 1.55 0.44 2.65 5.47 1.87 2.97 0.94
Baetiella bispinosa Baeb 5.94 0.73 6.67 0.9810.94 12.72 5.94 10.19
Baetis spp. Baet 20.15 27.06 18.15 24.25 20 29.39 14.38 17.21
Caenis sp.a 0 0.080 0.34 0 0.26 0 0
Cincticostella fusca Cinc 6.7 1.55 6.89 1.37 1.89 5.39 21.56 13.16
Epeorus erratus Epeo 0.380.12 0.3 0.39 0.75 0.82 0.31 1.69
Ephemera sauteria 0.13 0.2 0.07 9.080.19 0.34 0.63 1.15
Paraleptophlebia spinaa 0.19 0.69 1.11 0.88 0 0.15 0 0
Rhithrogena ampla Rhit 11.12 20.01 6.89 7.41 19.43 22.14 13.13 7.96
Plecoptera Amphinemura sp. Amph 1.2 0.24 0.96 0.15 1.13 0.04 0.16 0.67 Cerconychia sp. Cerc 0.57 0.61 1.19 2.41 0.19 0 0.780.13 Kiotina spp. Kiot 0.44 0.080.3 0.05 1.32 0.04 1.25 0.88 Neoperla spp. Neop 9.48 5.83 4.96 7.12 3.4 0.82 0.78 1.35 Protonemura spp. Prot 3.280.53 6.59 1.91 2.64 0.15 0.47 0.81 Rhopalopsole spp.a 0 0.12 0.15 0.2 0 0.11 0 0 Odonata Lanthus sp.a 0 0.04 0 0 0 0.07 0 0.13 Sieboldius deflexusa 0.06 0 0 0.2 0 0.07 0 0.88 Trichoptera Agarodes sp.a 0 0 0 0.05 0.75 0 1.41 0 Arctopsyche sp. Arct 0.44 0.29 0.59 1.33 0.19 0.26 0.16 0.27 Cheumatopsyche spp.a 0.06 0 0.07 0 0 0 0 0 Goerodes sp..a 0 0.41 0 1.57 1.13 0.07 3.91 1.35
Himalopsyche japonica Hima 0.25 0.04 0.15 0.05 1.13 0 0 0.27
Hydropsyche sp. Hydr 3.66 1.63 3.78 3.44 1.51 0.71 2.81 0.81
Melanotrichia sp.a 0 0.04 0 0 0 0 0 0
Plectrocnemia sp.a 0 0.24 0 1.23 0 0.07 0 0
Rhyacophila nigrocephala Rhyn 3.982.04 3.33 1.03 1.51 1.31 6.56 5.4
Rhyacophila spp. Rhya 0.95 0.77 3.26 0.74 0.57 0.15 0.31 0.13
Stenopsyche marmorata Sten 3.983.06 2.37 1.082.64 0.82 0.63 1.62
Tinodes sp.a 0.25 0.29 0.37 0.1 0.57 0 0 0.07
Uenoa taiwanensis Ueno 5.94 8.39 16.37 13.99 4.53 3.03 1.41 11.67
Coleoptera Cyphon sp. Cyph 2.080.33 1.41 0.05 0.57 0 0.47 0.13 Eubrianax sp.a 0 0.04 0.07 0.05 0 0.07 0 0.13 Zaitzevia sp. Zait 3.92 1.55 0.89 0.93 0.57 0.52 0.78 0.88 Diptera Antocha sp. Anto 1.07 1.63 0.59 0.15 0.380.64 0.780.74 Atherix sp.a 0 0.16 0 0 0.19 0 0 0.07 Chironomidae Chir 7.71 16.26 6.52 11.09 7.74 15.97 14.06 11.88 Dicranota sp.a 0.06 0 0.07 0 0.57 0.04 0 0 Eriocera spp. Erio 2.4 2.81 1.93 2.99 2.08 1.2 1.56 1.42 Hybomitra sp. Hybo 0.63 0 1.7 0 1.32 0 0.31 0 Simulium spp. Simu 1.33 0.57 1.480.74 4.72 0.79 2.19 6.01
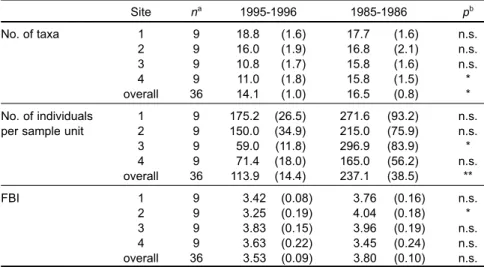
For samples of all sites combined, there were significant differences in numbers of taxa (p < 0.05) and numbers of individuals per sample unit (p < 0.01) between 1985-1986 and 1995-1996, but there were no significant differences in Hilsenhoffs family biotic index (p > 0.05) (Table 3). The significant differ-ences in total numbers of taxa were primarily due to greater numbers of Ephemeroptera, Plecoptera, and Trichoptera taxa (EPT taxa) in 1985-1986 than in 1995-1996 (Fig. 2). The number of individuals was greater at the 4 sampling sites in 1985-1986 than in 1995-1996 (Fig. 3). Hilsenhoffs family biotic index was higher in 1985-1986 than in 1995-1996 (Table 3), suggesting that the water quality or stream sub-strate had been altered during the 10-yr period. For the samples from each of the 4 sampling sites, there were no significant differences in the number of taxa between the 2 sampling times (p > 0.05), except at site 4 (p < 0.05) (Table 3). The number of taxa was significantly lower in 1995-1996 than in 1985-1986 at site 4. The number of individuals per sample unit between the 2 sampling times was significantly dif-ferent at site 3 (p < 0.05) (Table 3). Like the numbers of taxa, the numbers of individuals at site 3 was higher in 1985-1986 than in 1995-1996. Hilsenhoff s family biotic indices were significantly different be-tween the 2 sampling times at site 2 (p < 0.05). The values of Hilsenhoffs family biotic index at site 2
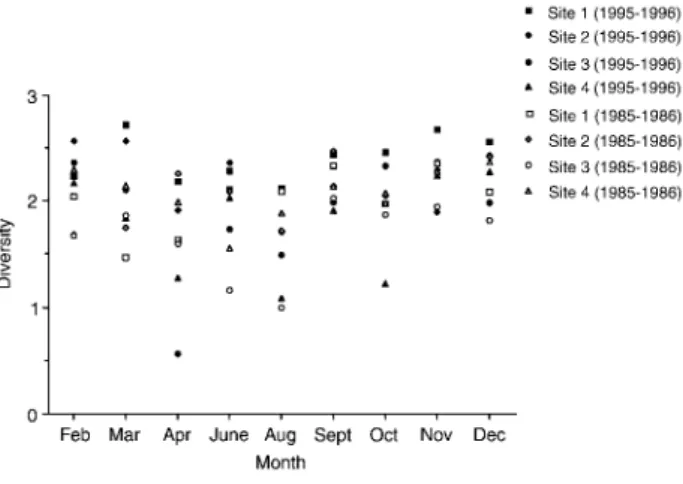
were lower in 1995-1996 than in 1985-1986. Shan-non-Weaver diversity indices provided mixed results of comparative stream conditions between 1985-1986 and 1995-1996 (Fig. 4). Higher diversities were found in 1995-1996 than in 1985-1986. The lower diversities found in spring and summer, espe-cially at site 3 in April 1996, were probably due to heavy rains and typhoons.
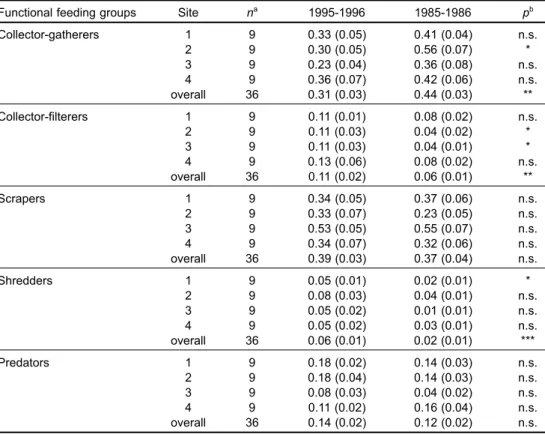
The results of Wilcoxon signed rank test of per-cent composition of each functional feeding group for samples from each sampling site, and for all
Table 3. Mean number of taxa, mean number of individuals per sample unit, and Hilsenhoff's family-level biotic index (FBI) at the 4 sites in the sampling periods of 1995-1996 and 1985-1986. The associated level of significance for Wilcoxon signed rank tests on these parameters between the 2 yr are given. Numbers in parentheses are standard errors
Site na 1995-1996 1985-1986 pb No. of taxa 1 9 18.8 (1.6) 17.7 (1.6) n.s. 2 9 16.0 (1.9) 16.8(2.1) n.s. 3 9 10.8(1.7) 15.8 (1.6) n.s. 4 9 11.0 (1.8) 15.8 (1.5) * overall 36 14.1 (1.0) 16.5 (0.8) * No. of individuals 1 9 175.2 (26.5) 271.6 (93.2) n.s.
per sample unit 2 9 150.0 (34.9) 215.0 (75.9) n.s.
3 9 59.0 (11.8) 296.9 (83.9) * 4 9 71.4 (18.0) 165.0 (56.2) n.s. overall 36 113.9 (14.4) 237.1 (38.5) ** FBI 1 9 3.42 (0.08) 3.76 (0.16) n.s. 2 9 3.25 (0.19) 4.04 (0.18) * 3 9 3.83 (0.15) 3.96 (0.19) n.s. 4 9 3.63 (0.22) 3.45 (0.24) n.s. overall 36 3.53 (0.09) 3.80 (0.10) n.s. an = sample size.
bp = significance level; n.s. = not significant, *p < 0.05, **p < 0.01. ;;;;;;;; ;;;;;;;;;;;;;;; ;; ;;; ; ;;; ;;;; ;; ;; ; ;; ;; ;;; ; ;;;;;; ;; ; ;;;; ;;;; ;; ;;;;;;;;;;;;;;;; ;;;;;;;;;;;; ;; ; ;;;;;; ;;;; ;;;;;;;;;;;; ;;; ;; ;;;; ;;;;;;;; ; ;;;;;;;;;;;;;;; ;;;;;;;;;;;;; ;;;;;;;;; ; ;;; ; ;;;; ;;; ; ;;; ;; ;;;;;;;;; ;; ;; ;;;;;;;;;;;; ;; ; ;;;; ;;;; ; ;; ;; ;; ;; ;; ;; ;; ; ;;;;;;;;;;;; ;;; ;;;;;;;; ; ;; ;;;;;;;;;;;;;;;; ;; ;;;;;;;;;;;;; ;; ;; ;;;;;;; ;;;;;;; ; ;; ;;; ; ; ;; ;;;;; ;;; ; ; ;;;;;;;; ;; ;; ;; ;; ;; ; ;; ;; ; ;; ;;;;; ;; ; ;;; 40 30 20 10 0
Site 1 Site 2 Site 3 Site 4
No
. of taxa per sample unit
(1995-1996) (1985-1986) (1995-1996) (1985-1986) (1995-1996) (1985-1986) (1995-1996) (1985-1986) ; ;;;; ;;; ;;;;;; ;; ; ;; ; Diptera Coleoptera Trichoptera Plecoptera Ephemeropte
Fig. 2. Number of taxa per sample unit for Ephemeroptera, Plecoptera, Trichoptera, Coleoptera, and Diptera at the 4 sites in Chichiawan Stream in 1985-1986 and 1995-1996.
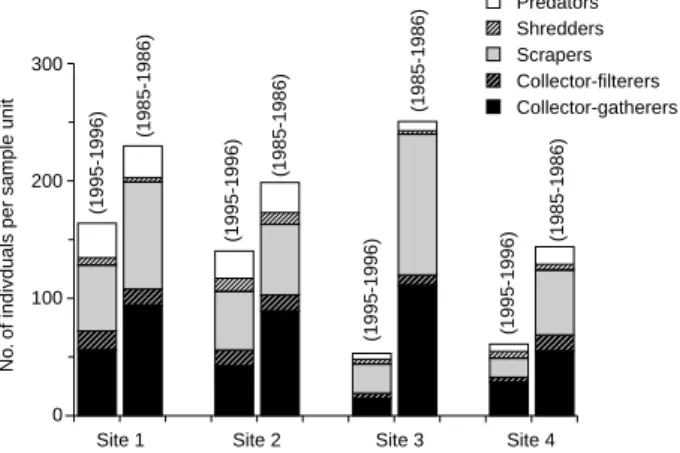
samples combined from all 4 sites between the 2 sampling periods, are given in table 4. The relative numbers of collector-gatherers at site 2 and for all sites pooled in 1985-1986 were significantly higher than those in 1995-1996 (p < 0.05 and p < 0.01, respectively) (Table 4). The percent compositions of collector-filterers were significantly different when all sites were pooled (p < 0.01). The collector-filterers accounted for a greater percentage of the total num-ber of individuals in 1995-1996 than in 1985-1986 (Table 4). The percent compositions of shredders were significantly different between 1995-1996 and 1985-1986 at site 1 and for all sites pooled (p < 0.05 and p < 0.001, respectively), whereas no statistical differences were observed in the relative abundance of scrapers or predators (p > 0.05) (Table 4). How-ever, the abundances of scrapers per sample unit at sites 1, 3, and 4, respectively, were much greater in 1985-1986 than in 1995-1996 (Fig. 5).
Results of the percent similarity analysis for indi-vidual taxa classified the 4 sampling sites into 3 groups during the 2 sampling times (Fig. 6B). The 1st group includes samples at sites 1 and 3 in 1985-1986. The 2nd group includes samples from sites 2 and 4 in 1985-1986 and from sites 1 and 2 in 1995-1996. The 3rd group includes samples from sites 3 and 4 in 1995-1996. The community structure at sites 1 and 2 in 1995-1996 was similar to that in 1985-1986 at site 4 where the stream receives flow from a tributary affected by adjacent agricultural activities. This result reflects that the water and/or habitat quality at site 1 in 1995-1996 was as poor as that at site 4 in 1985-1986. From figure 6, it can also been seen that changes in the aquatic insect community structure at sites 1 and 2 over the years were fewer than those at sites 3 and 4. Moreover,
changes in the aquatic insect community structure at site 2 over the years were less than those at site 1, because benthic samples collected from site 2 in 1985-1986 and 1995-1996 were in the same group. Similar results were found when the data of func-tional feeding groups were used in this analysis, whereas the functional organization at sites 1 and 2 in 1995-1996 was similar to that in 1985-1986 (Fig. 6A).
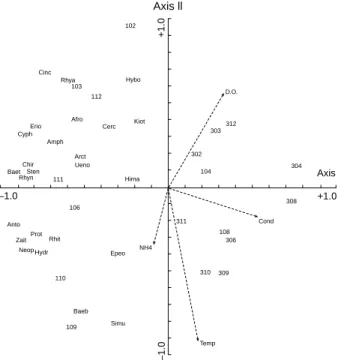
The results of PCA for the data set of sites 1 and 3 in 1995-1996 indicate the relative importance of physicochemical variables to aquatic insect distribu-tions and are shown as a triplot (Fig. 7). The first 4 PCA axes explain 74% of the total variance in the aquatic insect distributions. Eigenvalues for the first 4 axes are 0.43, 0.15, 0.09, and 0.07, respectively. The results indicate that the 2-dimensional diagram of PCA was proper to present the data sets. In this study, water temperature was the variable most strongly related to the aquatic insect distributions (Fig. 7). Other variables, such as dissolved oxygen, conductivity, and ammonia, were also important in shaping the community structure of aquatic insects. Water temperature was positively correlated with conductivity and ammonia, but negatively to dis-solved oxygen. The 1st axis of the PCA represents a gradient of conductivity, and the 2nd axis is a gradi-ent of water temperatures. Axis 1 separates sum-mer samples from winter samples. Samples col-lected during summer are located in the lower part of the diagram, and samples collected in winter are lo-cated in the upper part of the diagram. Axis 2 sepa-rates samples at site 1 from samples at site 3. Samples collected from site 1 are located on the left side of the diagram, except samples in April and August. Samples from site 3 are located on the right
300
200
100
0
Site 1 Site 2 Site 3 Site 4
No
. of individuals per sample unit
(1995-1996) (1995-1996) (1995-1996) (1995-1996) (1985-1986) (1985-1986) (1985-1986) (1985-1986) ;;; ;;;;;;; ;;;;;;; Diptera Coleoptera Trichoptera Plecoptera Ephemeropte ;;;;;;;;;;; ;;;;;;;; ;;;;;;;;;;; ;;;; ;;;;;;;;; ;;;;;;;;;;; ;;;; ;;;;; ;;;;;;; ;;;;;;;;;; ;;; ;;;;;;; ;;;;; ;;;;;;;;;;; ;;;;;;;;;;;;;;;;;;; ;;;;;;;;; ;;;;; ;;;;;; ;;;;;;; ;; ;;;;;; ;;;;;; ;;;;;;;; ;;; ;;;;;;;; ;;;;; ;;;;;; ;;;; ;;;;;;;
Fig. 3. Number of individuals per sampel unit for Ephemer-optera, PlecEphemer-optera, TrichEphemer-optera, ColeEphemer-optera, and Diptera at the 4
side of the diagram. The results reflect the gradient of conductivity at the 1st PCA axis. Furthermore, when the first 2 PCA axes are correlated with the 3 community structure parameters and FBI, the 1st PCA axis is negatively associated with the total num-ber of individuals, diversity, and numnum-ber of taxa (r = 0.83, 0.64, and 0.69, respectively; p < 0.001), and the secondary PCA axis does not correspond to any of these parameters. Therefore, the 1st PCA axis de-scribes the gradients of density, diversity, and spe-cies richness.
The distribution of samples along the PCA gra-dients (Fig. 7) shows that plots of site 3 are associ-ated with high values of conductivity, and samples at site 1 are associated with low values of conductivity. The high conductivity values occurred in summer when neighboring agricultural activities prevailed. Samples collected in April and August at sites 1 and 3 are located on the right side of the diagram. Distur-bances resulting from heavy rains and typhoons
might have led to lower density, diversity, and num-bers of taxa during the 2 sampling periods. Further-more, by comparing taxa with samples in the PCA diagram, where and when the different taxa domi-nated could be determined. The abundances of Baetis spp., Stenopsyche marmorata, Rhyacophila nigrocephala, and Chironomidae reached their maxi-ma at site 1 in November. Cincticostella fusca and Rhyacophila spp. had maximum abundances at site 1 in March and December. The maximal abun-dances of Baetiella bispinosa and Simulium spp. oc-curred at site 1 in September and October. All taxa were more abundant at site 1 than at site 3. B. bispinosa and Simulium spp. were associated with higher values of water temperature, and C. fusca, Rhyacophila spp., and Hybomitra sp. with lower wa-ter temperature. Inversely, B. bispinosa and Simu-lium spp. were associated with lower dissolved oxy-gen, and C. fusca, Rhyacophila spp., and Hybomitra sp. with higher dissolved oxygen. All taxa were
asso-Table 4. Mean relative abundance of each functional feeding group at the 4 sites in the sampling years of 1995-1996 and 1985-1986. The associated level of signifi-cance for Wilcoxon signed rank tests on relative abundance of each functional feed-ing group between the 2 samplfeed-ing periods are given. Numbers in parentheses are standard errors
Functional feeding groups Site na 1995-1996 1985-1986 pb
Collector-gatherers 1 9 0.33 (0.05) 0.41 (0.04) n.s. 2 9 0.30 (0.05) 0.56 (0.07) * 3 9 0.23 (0.04) 0.36 (0.08) n.s. 4 9 0.36 (0.07) 0.42 (0.06) n.s. overall 36 0.31 (0.03) 0.44 (0.03) ** Collector-filterers 1 9 0.11 (0.01) 0.08 (0.02) n.s. 2 9 0.11 (0.03) 0.04 (0.02) * 3 9 0.11 (0.03) 0.04 (0.01) * 4 9 0.13 (0.06) 0.08 (0.02) n.s. overall 36 0.11 (0.02) 0.06 (0.01) ** Scrapers 1 9 0.34 (0.05) 0.37 (0.06) n.s. 2 9 0.33 (0.07) 0.23 (0.05) n.s. 3 9 0.53 (0.05) 0.55 (0.07) n.s. 4 9 0.34 (0.07) 0.32 (0.06) n.s. overall 36 0.39 (0.03) 0.37 (0.04) n.s. Shredders 1 9 0.05 (0.01) 0.02 (0.01) * 2 9 0.08 (0.03) 0.04 (0.01) n.s. 3 9 0.05 (0.02) 0.01 (0.01) n.s. 4 9 0.05 (0.02) 0.03 (0.01) n.s. overall 36 0.06 (0.01) 0.02 (0.01) *** Predators 1 9 0.18 (0.02) 0.14 (0.03) n.s. 2 9 0.18 (0.04) 0.14 (0.03) n.s. 3 9 0.08 (0.03) 0.04 (0.02) n.s. 4 9 0.11 (0.02) 0.16 (0.04) n.s. overall 36 0.14 (0.02) 0.12 (0.02) n.s. an = sample size.
ciated with low conductivity values.
DISCUSSION
The stream water quality of Chichiawan Stream appears to have deteriorated as a result of changes in local land use. The observed differences in water chemistry between sites 1 and 3 were probably asso-ciated with agricultural activities (Table 1). Changes in concentrations of nutrients and conductivity values between sites 1 and 3 reflect the effects of nearby agricultural activities on stream water quality. Site 3 is located in agricultural areas. Agricultural prac-tices, such as the use of fertilizers and associated chemicals, probably explain the higher levels of nitrate, conductivity, and hardness occurring at site 3. Fertilizers were used intensively on croplands dur-ing the growdur-ing season from March to October (Lin and Chang 1990). This is reflected in the higher con-centration of ammonia and higher values of conduc-tivity during summer (Fig. 7). Lin et al. (1988a, b) also found that conductivity values increased down-stream in this study reach. Chen (1995) suggested that the use of fertilizers, such as lime and calcium phosphate, led to high conductivity values in the study stream reach. Omernik (1977) indicated that the levels of nutrients in streams were positively cor-related to percentage of land in agriculture, which may explain the high concentrations of nutrients downstream in the study stream reach.
Physicochemical variables, such as water tem-perature, dissolved oxygen, discharge, nutrients, and substrate influence community structure and function of aquatic insects (see Resh and Rosen-berg 1984, Ward 1992). In this study, PCA identified
water temperature, dissolved oxygen, conductivity, and ammonia to be the most important physico-chemical variables shaping the community structure of aquatic insects at sites 1 and 3 (Fig. 7). Long-term records for the study area indicate that water tem-peratures decreased between 1987-1988 (Tsao 1988) and 1995-1996. The ranges and annual means of hardness and conductivity values were very similar during the 2 sampling times. The con-centrations of nitrate and phosphate declined be-tween the periods of 1987-1988 and 1995-1996. These results suggest that the water quality in the stream reach did not degrade between 1987-1988 and 1995-1996. This is probably due to decreases in the use of fertilizers after 1984 when the Formosan landlocked salmon was listed as an endangered species.
The PCA diagram (Fig. 7) clearly separates site 1 from site 3 in the stream reach on the basis of aquatic insect community structure. From this analysis, patterns of community structure in the study area were primarily associated with water temperature, dissolved oxygen, conductivity, and ammonia. The mean water temperature at site 1
;;;; ;;;;;;;;;;; ;;;;;;;;;;; ;;;;;;;;; ;;;;;;;; ;;;; ;;;;;;;;; ;;;;;;;;;; ;;;;;;;;;;;; ;;;;; ;;;;;;;;;; ;; ;;;;;;;;;;;; ;;; ;;;;;;;; ;; ;;;;;;;;;; ;;;;; ;;;;;;;;; ;;;;;;;;;; ;;;;;; ;;;;;; ;;;;;;;;;; ;;;;; ;;;;;;;;;; ; ;; ;;;;;;;;;; ;;;; ;;;;;; ;;;;; ;;;;; Predators Shredders Scrapers Collector-filterers Collector-gatherers (1985-1986) (1985-1986) (1985-1986) (1985-1986) (1995-1996) (1995-1996) (1995-1996) (1995-1996) 300 200 100 0
Site 1 Site 2 Site 3 Site 4
No
. of indivduals per sample unit
Fig. 5. Number of individuals per sample unit for each functional feeding group at the 4 sites in Chichiawan Stream in 1985-1986 and 1995-1996. Chironomidae are excluded from the analysis.
0 10 20 30 40 50 60 70 80 90 100 (A) Functional grouping (B) Taxonomic grouping Site 3 (1985-1986) Site 1 (1995-1996) Site 4 (1985-1986) Site 2 (1995-1996) Site 1 (1985-1986) Site 2 (1985-1986) Site 3 (1995-1996) Site 4 (1995-1996) Site 1 (1985-1986) Site 3 (1985-1986) Site 1 (1995-1996) Site 2 (1995-1996) Site 4 (1985-1986) Site 2 (1985-1986) Site 3 (1995-1996) Site 4 (1995-1996) Percent similarity
Fig. 6. Percent similarities among the 4 sites based on functional feeding groups (A) and abundance of taxa (B) in Chichiawan Stream in 1985-1986 and 1995-1996.
was 10.4 °C with a range from 5.1 to 14.4 °C, and the mean water temperature at site 3 was 11.8 °C with a range from 8.4 to 14.6 °C. The increase in water temperature at site 3 was probably due to changes in land use from forest to agricultural land in the riparian zones. Some forest practices can expose the stre-ambed to increased solar radiation, resulting in higher temperatures (Allan 1995). Lin et al. (1988b) also indicated that increases in water temperature were due to forest practices in the stream reach. Swift and Messer (1971) found that water tempera-ture increased from 19 to 23 °C after forest harvest-ing on a small stream in the southern Appalachians, USA. Daytime dissolved oxygen was high at both sites 1 and 3. Because both sites 1 and 3 are located at riffles and runs, the dissolved oxygen at the 2 sites did not differ significantly. Moreover, according to the PCA diagram (Fig. 7), the 1st PCA axis was negatively associated with density, diversity, and species richness. The lower density, diversity, and species richness were probably due to higher con-ductivity at site 3. The higher concon-ductivity occurred in summer when fertilizers were being used intensively (Lin and Chang 1990). Shieh et al. (1999) also found a negative relationship between conductivity and species richness in a Colorado plains stream, USA. However, they found a positive relationship between conductivity and density. Differences in the relation-ship between conductivity and density for the 2 stud-ies might be due to the physical characteristics and food resources of the 2 streams. Chichiawan Stream is a mountain stream with higher slope, higher current velocity, and larger substrate particle size, but does not have aquatic macrophytes, as compared with the Colorado plains stream. In addition, the lower density, diversity, and number of taxa in April and August 1996 at sites 1 and 3 were related to physical disturbances. Yang and Wang (1997) indicated that heavy rains and typhoons oc-curring in April and August resulted in high flows which led to the movement of substrate and alter-ation of the stream channel.
Comparisons of taxonomic composition and abundance of aquatic insects indicated major differ-ences in community structure between the 1985-1986 and 1995-1996 studies (Figs. 2, 3). Lenat and Barbour (1994) reported that Ephemeroptera, Plecoptera, and Trichoptera taxa (EPT taxa ) are a reliable index sensitive to changes in stream water and/or substrate quality. The number of EPT taxa decreases with increasing human impacts. In the present study, the lower EPT taxa in 1995-1996 for all sampling sites suggests that human impacts on the stream reach increased during the 10-yr period
(Fig. 2). On the other hand, the most obvious changes in taxonomic composition were for Baetis spp. and Chironomidae. The relative abundances of Baetis spp. and Chironomidae were higher in 1985-1986 than in 1995-1996. Inversely, the relative abun-dance of Baetiella bispinosa was higher in 1995-1996 than in 1985-1986 (Table 2). The combined relative abundances of Baetis spp. and B. bispinosa were similar between 1995-1996 and 1985-1986, with the exception of sites 3 and 4, where the relative abundances of Baetis spp. and B. bispinosa were higher in 1985-1986 than in 1995-1996. Both Baetis spp. and B. bispinosa need coarse substrate to cling to, and an increase in finer sediments can hinder this ability (Ward 1992). This result suggests that the habitat quality degraded at sites 3 and 4 during the 10-yr period. The other obvious changes in taxo-nomic composition between the 2 sampling periods were in Rhithrogena ampla, Cincticostella fusca, and Uenoa taiwanensis. Higher relative abundances of R. ampla were found at sites 1, 2, and 3, and of U. taiwanensis at sites 1 and 4 in 1985-1986. Both R. ampla and U. taiwanensis are grazers that feed on
102 Hybo 112 103 Rhya Cinc Erio Cyph Afro Amph Cerc Kiot Arct Ueno Hima 111 Chir Sten Rhyn Baet 106 Rhit Prot Zait Anto Neop Hydr 110 Epeo NH4 Simu Baeb 109 Temp 310 309 306 108 Cond 311 308 304 104 302 303 312 D.O. Axis ll +1.0 +1.0 –1.0 –1.0 Axis l
Fig. 7. Triplot of the PCA ordination diagram for the data set of sites 1 and 3 in 1995-1996. Physicochemical variables are shown as arrows (Cond = conductivity; D.O. = dissolved oxygen; NH4 = ammonia; Temp = water temperature). The samples are labeled with numbers. The 1st number indicates the site, and the 2nd and 3rd indicate the month. For example, 102 indicates that the sample was taken at site 1 in February. The eigenvalues for the first 4 axes are 0.43, 0.15, 0.09, and 0.07, respectively. See table 2 for taxonomic abbreviations.
attached algae. Sediment loads may affect the growth of attached algae and reduce the availability of algae to grazers (Minshall 1984). The relative abundances of C. fusca, a collector-gatherer species, were much higher at sites 1, 2, and 4 in 1995-1996 than in 1985-1986. The higher relative abundance of C. fusca occurring at these sites sug-gests that the relative composition of food resources that they consume increased due to sediment load in 1995-1996. It can be postulated that the substrate quality of the stream had deteriorated at sites 3 and 4 over the 10-yr period. This result conforms with the viewpoint of Lin and Chang (1990) that the conver-sion of forest into orchards and vegetable farms at the stream reach has caused serious soil erosion, and that stream sedimentation is one of the greatest nonpoint sources of pollution in the watershed of Chichiawan Stream. Furthermore, from the results of cluster analysis, the community structure and functional organization of aquatic insects at sites 1 and 2 in 1995-1996 were similar to those at site 4 in 1985-1986 (Fig. 6). Site 4 is located downstream of the confluence between Chichiawan Stream and Yousheng Stream where the stream watershed has been developed for agricultural land use. Yang et al. (1986) indicated that site 4 was facing the most seri-ous impact of water pollution resulting from sewage effluents and agricultural activities upstream. Based on this result, therefore, the habitat quality at sites 1 and 2 in 1995-1996 degraded during the 10-yr period.
Similar results were found for functional feeding groups. The mean density of collector-filterers de-creased in 1995-1996 (Fig. 5). The negative effects of sediment loads on collecting-filtering caddisfly lar-vae (e.g., Stenopsyche marmorata, Arctopsyche spp., and Hydropsyche spp.) have been attributed to decreases in availability of substrates to which they attach and to interference with filtering mechanisms (Wallace and Merritt 1980). Similarly, decreases in the density of scrapers in 1995-1996 were probably a response to decreased food resources due to sedi-mentation (Fig. 5). Waters (1995) suggested that sediment loads might constrain the growth of at-tached algae and indirectly influence the density of scrapers. Olive et al. (1988) indicated that addition of excessive sediment due to agricultural activities usually reduces the density of organisms and the number of taxa, especially of scrapers, shredders, and predators.
In conclusion, land-use practices adjacent to Chichiawan Stream flowing through the Wulin Farm undoubtedly have stressed the local aquatic insect communities. The raw cropping of orchards and
vegetable farms on the west side of the stream reach has greatly increased concentrations of nutrients and conductivity values downstream of the stream reach. These chemical variables produced by agri-cultural activities probably led to lower density, diversity, and species richness at site 3. The stream water quality did not deteriorate during the 10-yr pe-riod based on comparisons of physicochemical data. The analyses of community structure and functional feeding groups of aquatic insects suggest that changes in stream substrates resulted from in-creased soil erosion and suspended sediment inputs to the stream, are among the greatest nonpoint sources of pollution due to agricultural activities in the watershed of Chichiawan Stream. The main change in the stream reach between the 2 sampling times was probably the degradation of habitat quality which influenced both the community structure and functional organization of aquatic insects.
Acknowledgments: This study was partly funded by the Council of Agriculture, Hsueh-Pa National Park, and the National Science Council (NSC-88-2313-B002-007). We thank Dr. K. J. Wong and Mr. L. J. Wang for assisting with field and laboratory work, Dr. H. C. Chen for providing valuable chemical data, and Mr. L. C. Jang and Dr. H. S. Taso for offering related references and data. This study would not have been possible without their assistance.
REFERENCES
Allan JD. 1995. Stream ecology: structure and function of run-ning waters. New York: Chapman & Hall.
Chen HC. 1995. Design of monitoring system and investigation of water quality in rivers at Wulin Area. Annual Research Report of Hsueh-Pa National Park, Department of Interior, Taiwan. 104 pp.
Cody RP, JK Smith. 1997. Applied statistics and the SAS pro-gramming language. 4th ed. Upper Saddle River, NJ: Prentice Hall.
Cummins KW. 1974. Structure and function of stream eco-system. BioScience 24: 631-641.
Grubaugh JW, JB Wallace. 1995. Functional structure and pro-duction of the benthic community in a Piedmont river: 1956-1957 and 1991-1992. Limnol. Oceanogr. 40: 490-501. Hilsenhoff WL. 1988. Rapid field assessment of organic pollution
with a family-level biotic index. J. N. Am. Benthol. Soc. 7: 66-68.
Hsu CB, PS Yang. 1997. Study on the assessment of water qual-ity with biological indicators of aquatic insects in the Keelung River. Chin. J. Entomol. 17: 152-162.
Johnson RK, T Wiederholm, DM Rosenberg. 1993. Freshwater biomonitoring using individual organisms, populations, and species assemblages of benthic macroinvertebrates. In DM Rosenberg and VH Resh, eds. Freshwater biomoni-toring and benthic macroinvertebrate. New York: Chapman
& Hall, pp. 40-158.
Kang SC. 1993. Ephemeroptera of Taiwan (excluding Baetidae). PhD dissertation, National Chung Hsing Univ., Taichung, Taiwan.
Kang SC, CT Yang. 1994a. Heptageniidae of Taiwan (Ephemer-optera). J. Taiwan Mus. 47: 5-36.
Kang SC, CT Yang. 1994b. Three new species of the genus Ameletus from Taiwan (Ephemeroptera: Siphlonuridae). Chin. J. Entomol. 14: 261-269.
Kawai T. 1985. An illustrated book of aquatic insects of Japan. Tokyo: Tokai Univ. Press, 409 pp.
Lenat DR. 1993. A biotic index for the southeastern United States: derivation and list of tolerance values, with criteria for assigning water-quality ratings. J. N. Am. Benthol. Soc. 12: 279-290.
Lenat DR, MT Barbour. 1994. Using benthic macroinvertebrate community structure for paid, cost-effective, water quality monitoring: rapid bioassessment. In SL Loeb, A Spacie, eds. Biological monitoring of aquatic systems. Boca Raton, FL: Lewis, pp. 187-215.
Lin YS, KH Chang. 1990. Conservation of the Formosan land-locked salmon Oncorhynchus masou formosanus in Taiwan, a historical review. In YS Lin, KH Chang, eds. Population ecology and conservation of the Formosan landlocked salmon Oncorhynchus masou formosanus in Chichiawan Stream, Taiwan. Ecological Research Report no.1, Council of Agriculture, Taiwan, pp. 26-40.
Lin YS, TS Tsao, KH Chang, PS Yang. 1988a. Ecological study on the Formosan landlocked salmon Oncorhynchus masou formosanus: 2. The relationship between population distri-bution and environmental factors in the Wulin Farm. Eco-logical Research Report no. 12, Council of Agriculture, Taiwan, 93 pp.
Lin YS, PS Yang, SH Liang, TS Tsao, LC Chuang. 1988b. Eco-logical study on the Formosan landlocked salmon Oncor-hynchus masou formosanus: 1. Preliminary study on the relationship between population distribution and environ-mental factors in the Wulin Farm. Ecological Research Re-port no. 23, Council of Agriculture, Taiwan, 50 pp. Ludwig JA, JF Reynolds. 1988. Statistical ecology: a primer on
methods and computing. New York: J Wiley.
Merritt RW, KW Cummins. 1996. An introduction to the aquatic insects of North America. 3rd ed. Dubuque, IA: Kendall/ Hunt.
Minshall GW. 1984. Aquatic insect-substratum relationships. In VH Resh, DM Rosenberg, eds. Aquatic insect ecology. New York: Praeger Scientific, pp. 385-400.
Olive JH, JL Jackson, J Bass, L Holland, T Savisky. 1988. Benthic macroinvertebrates as indices of water quality in the upper Cuyahoga River. Ohio J. Sci. 88: 91-98. Omernik JM. 1977. Nonpoint source-stream nutrient level
relationships: a national study. EPA-600/3-77-105. Washington, DC: U.S. Environmental Protection Agency. Plafkin JL, MT Barbour, KD Porter, SK Gross, RM Hughes. 1989.
Rapid bioassessment protocols for use in streams and rivers: benthic macroinvertebrates and fish. EPA/444/4-89-001. Washington, DC: U.S. Environmental Protection Agency.
Resh VH, DM Rosenberg. 1984. The ecology of aquatic insects. New York: Praeger Publ.
Rosenberg DM, VH Resh. 1993. Freshwater biomonitoring and benthic macroinvertebrates. New York: Chapman & Hall. Shieh SH, BC Kondratieff, JV Ward, DA Rice. 1999. The
rela-tionship of macroinvertebrate assemblages to water chem-istry in a polluted Colorado plains stream. Arch. Hydrobiol. 145: 405-432.
Swift HW, JB Messer. 1971. Forest cutting raises temperature on small streams in the south Appalachians. J. Soil Water Conserv. 26: 111-116.
ter Braak CJF. 1988. CANOCO-a FORTRAN program for ca-nonical correspondence analysis, principal components analysis and redundancy analysis (version 3.12). Wagen-ingen, The Netherlands: Agricultural Mathematics Group. ter Braak CJF. 1990. Update notes: CANOCO, Version 3.10.
Wageningen, The Netherlands: Agricultural Mathematics Group.
Tsao TS. 1988. The relationship between population distribution and environmental factors of Masu Salmon (Oncorhynchus masou formosanus) in Wu-Lin Farm. Masters thesis, Na-tional Taiwan Univ., Taipei, Taiwan.
Tsao TS. 1995. An ecological study of the habitat requirements of the Formosan landlocked salmon (Oncorhynchus masou formosanus). PhD dissertation, Colorado State Univ., Fort Collins, CO.
Vannote RL, GW Minshall, KW Cummins, JR Sedell, CE Cushing. 1980. The river continuum concept. Can. J. Fish. Aquat. Sci. 37: 130-137.
Wallace JB, RW Merritt. 1980. Filter-feeding ecology of aquatic insects. Ann. Rev. Entomol. 25: 103-132.
Wang CMJ. 1989. Environmental quality and fish community ecology in an agricultural mountain stream system of Taiwan. PhD dissertation, Iowa State Univ., Ames, IA. Ward JV. 1992. Aquatic insect ecology. 1. Biology and habitat.
New York: J Wiley.
Waters TF. 1995. Sediment in streams: sources, biological effects, and control. American Fisheries Society mono-graph 7. Bethesda, MD: American Fisheries Society. Wong KJ. 1987. The aquatic insect fauna and ecological studies
of the Chichiawan Stream. Masters thesis, National Taiwan Univ., Taipei, Taiwan.
Yang PS, YS Lin, KC Huang, SH Liang, SH Shieh, CS Tzeng. 1986. Investigations of aquatic insect fauna and ecology of the streams in the Wulin Farm. Ecological Research Re-port no. 001, Council of Agriculture, Taiwan, 40 pp. Yang PS, LJ Wang. 1997. The ecology of aquatic insects and
water quality monitoring of the Chichiawan Stream. Eco-logical Research Report of Hsueh-Pa National Park, De-partment of Interior, Taiwan, 42 pp.