側發式背光區域調變技術應用於版畫場色序
法之節能顯示器
碩士研究生:鄧昌毅 指導教授:謝漢萍教授
黃乙白副教授
國立交通大學電機學院 光電工程研究所
摘 要
近年來地球暖化現象帶給了環境無限的衝擊與變遷,為了保護我們的地球, 綠色能源產業因此而興起。在顯示技術上,為了能達到「能源之星計畫」對於大 於 50 吋顯示器所規範的耗能需低於 108 瓦的限制,使用 LED 當背光源的免彩色 濾光片之場色序法顯示技術已證實能夠有效地降低耗電量;此技術仍有其他優點, 如:高影像解析度、高色彩飽和度、較高的出光效率以及較低的材料成本,但是 色分離現象卻限制了此技術的發展性。 我們提出了 180Hz Stencil-FSC 法能夠有效地抑制色分離的現象,然而此方 法會發生紅色與藍色漏光的問題,使得綠色飽和度降低,因此,此篇論文提出 了”Limited Backlight Signal Ratio”(LBSR)法來決定較正確的背光訊號,使 得漏光與影像失真問題獲得改善;同時,輕薄的顯示器是目前市場的主流,為了 能夠發展出低耗能的輕薄顯示器,此篇論文也提出了使用側發式 LED 背光源的光 源分布函數(LSF-Light Spreading Function)模型,藉由結合此 LSF 模型與 LBSR 法,未來將能夠實現輕薄低耗能的高影像品質節能顯示器。根據模擬結果,找出了最佳化的 LSF 硬體參數與其背光分區數為 2x16 區, 以 CIEDE2000 色差公式來評估影像品質,其影像擬真度色差小於 3 的百分比為
評估耗電量,其帄均耗能約只有 38 瓦。最後由 46 吋 MVA-LCD 實驗結果可知,此 技術在色分離現象上有明顯的改善且能夠大大提高影像擬真度,因此,藉由此篇 論文所提出的側發式背光區域調變技術應用在版畫場色序法顯示技術上,未來將 有機會發展出薄型(小於 10mm)的高影像品質之節能顯示器。
Side-lit Eco-LCDs Using Locally Backlight Controlled
Technology in Stencil Field-Sequential-Color Method
Student: Chang-Yi Teng Advisor: Dr. Han-Ping D. Shieh Dr. Yi-Pai Huang Institute of Electro-Optical Engineering
National Chiao Tung University
Abstract
Recently, global warming phenomenon impacts and changes the environment. In order to protect the earth, the green energy industry therefore springs up. In the display technology area, to achieve the target of “energy star” which limits the power consumption of display larger than 50-inch should be less than 108 watts, the color filter-less field-sequential-color (FSC) technique by using light emitting-diode (LED) as backlight is proven to effectively reduce power consumption. This technique still has the advantages of high image resolution, high color saturation, higher optical throughput, and lower material cost. However, color breakup (CBU) phenomenon constrains the development of this technique.
Our group has proposed the 180Hz Stencil-FSC method to effectively suppress the color breakup phenomenon. Nevertheless, this method has the issue of light leakage in red and blue light resulting in the green color be de-saturated. Therefore, in this thesis, we proposed the “Limited Backlight Signal Ratio” (LBSR) method to determine proper backlight signals to improve the issues of light leakage and image
light spread function (LSF-Light Spreading Function) in this thesis. By combining the LSF model and LBSR method, we could realize the thin and high image quality eco-display in the future.
According to the simulation result, the LSF parameters are optimized and the optimum backlight division is 2x16. By utilizing the color difference formula of CIEDE2000 to evaluate the image fidelity of the proposed method, which the percentage of color difference less than 3 is 0.89 ( color difference less than 3 represents human eye cannot distinguish the color difference). Color breakup of the proposed method can reduce to 28.4% comparing with conventional RGB-driving method. We use the IEC 62087 video to evaluate the power consumption of the proposed method, which the average power consumption is only 38 watts. By verifying the proposed method on the 46-inch MVA-LCD, we can observe that the image fidelity is increased greatly and the color breakup phenomenon is improved apparently. Therefore, by the proposed side-lit eco-LCDs using locally backlight controlled technology in Stencil-FSC method, it is promising to develop the thin (less than 10mm) and high image quality eco-display in the future.
誌 謝
首先誠摯的感謝我的指導老師謝漢萍教授與黃乙白副教授,兩位老師悉心的 教導與不時的討論並指引我正確的方向使我獲益匪淺,並且提供完善的研究環境 與豐富的資源使得我在碩士兩年的求學中提升專業及英文能力。教授們對學問的 嚴謹是我輩學習的典範。 此外,要由衷感謝林芳正學長對於研究上不辭辛苦的細心指導,使得我在每 次的討論過後獲益良多,並在生活上不時的關心與照顧,我才能夠如此順利地完 成此篇論文;也要感謝友達光電諸位合作同仁,侯鴻龍副理與黃郁升同事提供我 專業上的建議與硬體上的協助,並感謝各位口試委員所提供的寶貴意見與討論, 使得本論文能夠更加的完整而嚴謹。 碩士兩年說長不長說短不短,但卻是我人生中最為可貴的回憶,與實驗室同 學們一起上課、一起出遊、一起為研究奮鬥酸甜苦辣的日子將會深深的烙印在我 的記憶中。謝謝實驗室的博班學長/姊 - 大頭、致維哥、小皮、奕智、精益、凌 嶢、國振、柏全、台翔、志明,有你們的帶領實驗室才能在每次的研討會上頻頻 獲得發表與得獎的機會;謝謝跟我一起為碩論打拼的同學們 – 立偉、董哥、馬 神、小馬、吳思頤、小fighter、子寬、濟宇、博六、該B、簡又儀,跟你們一起 渡過這兩年讓我過得很快樂也很高興遇到你們;謝謝同組的學妹張綺文,有妳的 協助與討論也使我能夠順利完成此論文,實驗室的其他學弟妹們謝謝你們讓實驗 室更增添活力,也希望未來你們能夠順利的完成發表SID以及碩論;也感謝實驗室 助理雅惠姊、潁佳、茉莉與介堯,有你們的幫助才能讓我全心的投入研究。 最後,最感謝的莫過於在背後默默支持我的家人與女友妧妧,在我處於壓力 與困境下謝謝你們提供了一個避風港以及精神上的支持,使我每次遇到瓶頸與困 惑時都能夠找到出口,有你們的支持是我最大的幸福。最後將此喜悅分享給我所Table of Contents
Abstract (Chinese) ...i
Abstract (English) ... ii
Acknowledgement
...…………...………...………... vTable of Contents ... vi
Chapter 1 ... 1
1.1 Field-Sequential-Color Liquid Crystal Displays (FSC-LCDs) ... 1
1.2 Color Breakup (CBU) Phenomenon ... 4
1.3 Motivation and Objective... 5
1.4 Organization of This Thesis ... 7
Chapter 2 ... 8
2.1 Human Vision System ... 8
2.1.1 Human Eye Structure ... 8
2.1.2 Types of Eye Movements ... 10
2.2 Color Breakup Mechanism ... 11
2.2.1 Dynamic Color Breakup ... 11
2.2.2 Static Color Breakup ... 12
2.3 Prior Color Breakup Suppression Methods ... 13
2.4 Evaluation Index of Color Breakup and Image Fidelity ... 20
2.4.1 CIE 1931 Colorimetric Observations... 20
2.4.2 CIE 1976 Uniform Color System ... 23
2.4.3 Color Difference of CIEDE2000 ... 25
2.5 Taguchi Quality Engineering Method ... 26
2.5.1... 28
2.6 Summary ... 28
Chapter 3 ... 30
3.1 65-inch Field-Sequential-Color LCD Demonstration ... 30
3.2.1 Limited Backlight Signal Ratio Decision Method ... 32
3.2.2 Side-lit Light Spread Function Simulation ... 37
3.2.3 Uniformity Requirement ... 39
3.3 Summary ... 40
Chapter 4 ... 42
4.1 Optimization by Taguchi Method ... 42
4.2 Comparison with Prior Arts ... 46
4.3 Power Evaluation of IEC 62087:2008 Video ... 50
4.4 Experimental Results ... 51 4.5 Summary ... 56
Chapter 5 ... 58
5.1 Conclusions ... 58 5.2 Future Work ... 61References ... 64
Figure Captions
Fig. 1-1 The structure of (a) conventional CCFL-LCD, and (b) FSC-LCD. ... 2 Fig. 1-2 The advantages of FSC LCD comparing with conventional LCD. ... 3 Fig. 1-3 FSC-LCD driving mechanism. ... 3 Fig. 1-4 (a) Target image, and (b) simulated color breakup image with 10 pixels shifted. ... 4 Fig. 1-5 Redundant color propagates through the first field resulting in reduction of green color saturation. ... 5 Fig. 1-6 Backlight signal image of 180Hz Stencil-FSC method. (a) 1st field backlight image, which the backlight signal decision is inappropriate to cause the redundant red and blue light in 1st field, (b) 2nd field backlight image, and (c) 3rd field backlight image. ... 5 Fig. 1-7 The color gamut comparison between CCFL and RGB LED light source [9]. 6 Fig. 1-8 Two backlight types of LCDs: (a) direct-lit backlight, and (b) side-lit backlight. ... 7 Fig. 2-1 A drawing of a cross-section through the human eye with a schematic
enlargement of the retina including rod cells and cone cells. ... 9 Fig. 2-2 A schematic drawing of rods and cones cell. ... 9 Fig. 2-3 Response of the three human cone types to light of different wavelengths. .. 10 Fig. 2-4 By Yarbus* shows eye-movement traces while a subject explores a picture of the bust of Nefertiti. *: from "Eye Movements and Vision" by A. L. Yarbus; Plenum
Press, New York; 1967. ... 10
Fig. 2-5 Smooth pursuit of an object. ... 11
Fig. 2-6 Perception mechanism of dynamic color breakup. ... 12
Fig. 2-7 Perception mechanism of static color breakup. ... 13
Fig. 2-8 Prior color breakup suppression methods of FSC-LCD. ... 14
Fig. 2-9 Simulation color breakup image of (a) 180Hz RGB, and (b) 360Hz RGBRGB. ... 15
Fig. 2-10 Simulation color breakup image of (a) 180Hz RGB, and (b) 300Hz RGBCY. ... 15
Fig. 2-11 The mechanism of motion compensation; color breakup was suppressed effectively. ... 16
Fig. 2-12 The mechanism of motion compensation; object and observer’s eye trace movement in the opposite position. ... 16
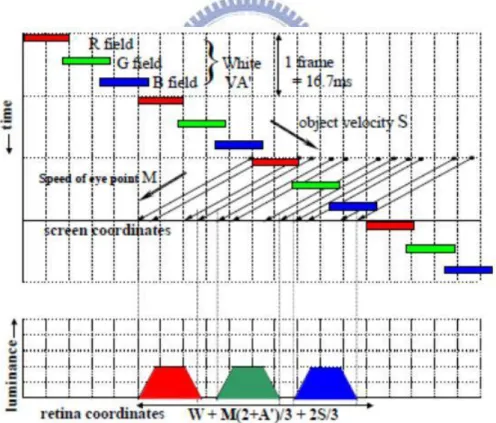
Fig. 2-13 The concept of Stencil-FSC methods: (a) 240Hz Stencil-FSC (b) 180Hz Stencil-FSC, and (c) 120Hz Two-color –field FSC. ... 18
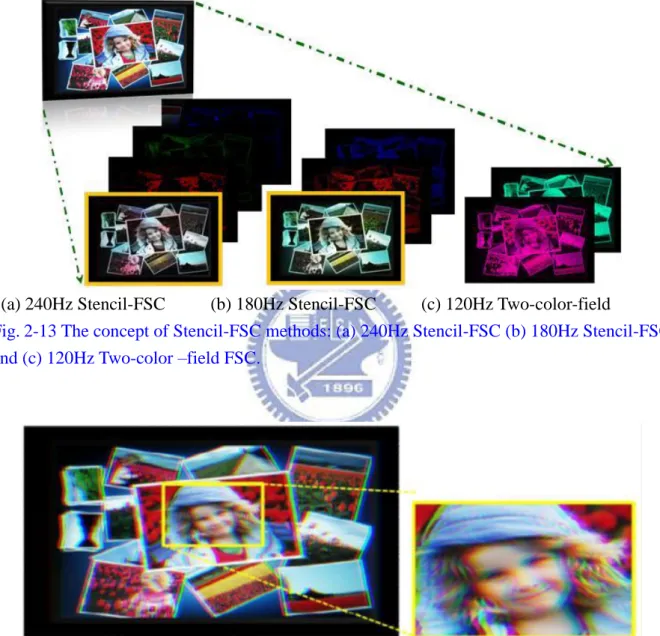
Fig. 2-14 Color breakup of image Girl by different FSC methods: (a) RGB-driving, (b) the 240Hz Stencil-FSC method, and (c) the 180Hz Stencil-FSC method. ... 19
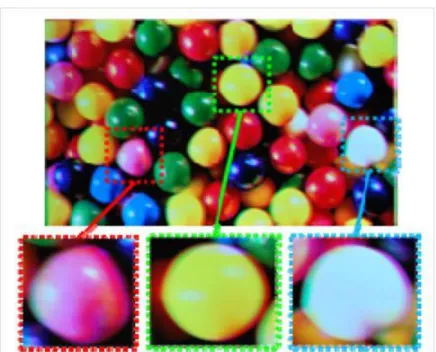
Fig. 2-15 Color breakup of image Color Ball by (a) RGB-driving, and (b) 120Hz two-color-field method. ... 20
chromaticity diagram. ... 21
Fig. 2-18 CIE 1931 (X, Y, Z) chromaticity diagram. ... 22
Fig. 2-19 MacAdam ellipses in the CIE 1931 (X, Y, Z) chromaticity diagram. ... 24
Fig. 2-20 CIELAB color space. ... 24
Fig. 2-21 (a) Original image (b) color breakup image, and (c) difference between (a) and (b). ... 26
Fig. 2-22 P – Diagram for static problems. ... 27
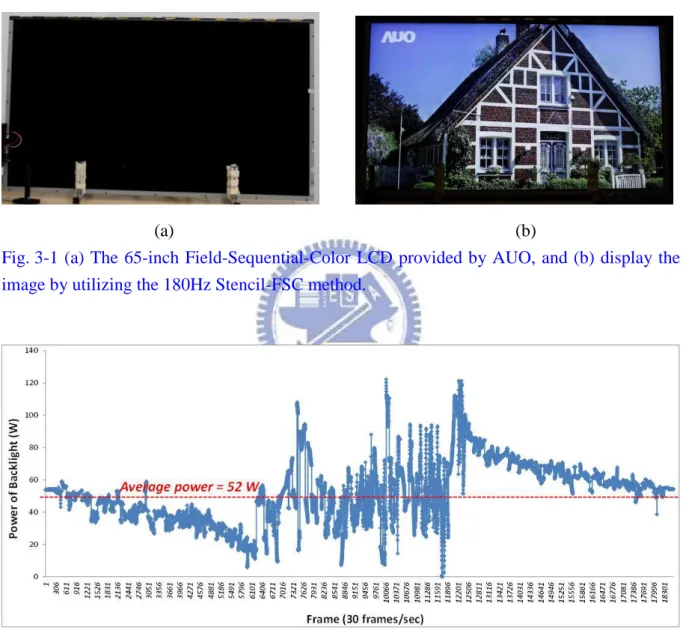
Fig. 3-1 (a) The 65-inch Field-Sequential-Color LCD provided by AUO, and (b) display the image by utilizing the 180Hz Stencil-FSC method. ... 31
Fig. 3-2 The power consumption of backlight source evaluated by the IEC 62087:2008 video. ... 31
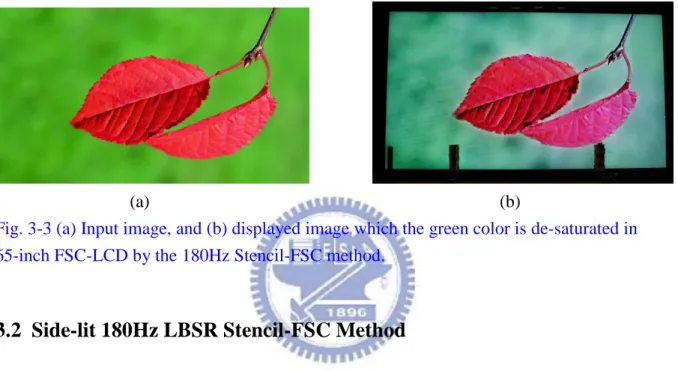
Fig. 3-3 (a) Input image, and (b) displayed image which the green color is de-saturated in 65-inch FSC-LCD by the 180Hz Stencil-FSC method. ... 32
Fig. 3-4 The concept of the 180Hz Stencil-FSC method. ... 33
Fig. 3-5 Redundant red and blue light propagate into the first field resulting in the green color was de-saturated. ... 34
Fig. 3-6 Images displayed by (a) BLR, BLG, and BLB (b) BLR, and (c) BLB in the “green-based” Stencil-FSC method. ... 36
Fig. 3-7 Images displayed by (a) BLR1st, BLG1st, and BLB1st, (b) BLR2nd, and (c) BLB3rd in the “LBSR” Stencil-FSC method. ... 37
Fig. 3-9 (a) Gaussian function with varied standard deviation σxmin and σxmax in
horizontal direction (b) half Gaussian function with varied standard deviation σy in
vertical direction (c) side-lit type LSF of the simulation, and (d) illustration of side-lit backlight spreading. ... 38 Fig. 3-10 The side-lit 180Hz LBSR Stencil-FSC method. ... 39 Fig. 3-11 Twenty-five points measurement method of uniformity. ... 40 Fig. 4-1 The twelve test images from left to right, up to down are: Woman, Pineapple,
Butterfly*, Pattern+, Dance+, Drum+, Coast, Basketball, Ocean, Wood+, Girl#, and
Car+. (+: capture from IEC document 62087:2008, Methods of measurement for the power consumption of audio, video and relative equipment, *: Taken by Jacky Lee, http://jac3158.com/blog, #: © Microsoft,
http://www.microsoft.com/surface/index.html). ... 44 Fig. 4-2 Simulation results of the optimal number of backlight divisions in the twelve test images; the number of backlight divisions vs. (a) Pixel distortion ratio (PDR) and (b) relative CBU. ... 45 Fig. 4-3 (a) Light intensity distribution of the optimal light spread function and (b) luminance uniformity by the all LED signals are turned on. ... 46 Fig. 4-4 The comparison of PDR index between the Direct-lit 180Hz Stencil-FSC method and the proposed Side-lit 180Hz LBSR Stencil-FSC method with the average of twelve test images. ... 47 Fig. 4-5 (a) From top to down is: original image Red Leaf, result image by 180Hz
difference of each method, and (d) the histogram of each method. ... 47 Fig. 4-6 (a) From top to down is: original image Girl©, result image by the 180Hz Green-based Stencil-FSC method, by the 180Hz LBSR Stencil-FSC method, and by the Side-lit LBSR Stencil-FSC method, (b) the enlarged part of each method, (c) the color difference of each method, and (d) the histogram of each method. ... 48 Fig. 4-7 The comparison of relative CBU index between the proposed Side-lit 180Hz LBSR Stencil-FSC method and prior methods with the average of twelve test images. ... 49 Fig. 4-8 Color breakup comparison of image Gallery by the (a) 180Hz RGB-driving method, (b) 360Hz RGBRGB method, (c) 360Hz RGBKKK method, (d) Side-lit 180Hz LBSR Stencil-FSC method, (e) Direct-lit 180Hz LBSR Stencil-FSC method, and (f) Direct-lit 180Hz Green-based Stencil-FSC method. ... 50 Fig. 4-9 (a) The power consumption distribution of backlight source evaluated by the IEC 62087:2008 video, and (b) the average power consumption of each method. ... 51 Fig. 4-10 The 46-inch 120Hz MVA LCD for verifying color breakup phenomenon. . 52 Fig. 4-11 The color breakup comparison of image Gate. (a) Three fields of the
RGB-driving method and (b) enlargement of its color breakup image. (c) Three fields of the Side-lit LBSR Stencil-FSC method and (d) enlargement of its color breakup image. ... 53 Fig. 4-12 The color breakup comparison of image Gallery. (a) Three fields of the RGB-driving method and (b) enlargement of its color breakup image. (c) Three fields of the Side-lit LBSR Stencil-FSC method and (d) enlargement of its color breakup image. ... 54
Fig. 4-13 The color breakup comparison of image Face. (a) Three fields of the
RGB-driving method and (b) enlargement of its color breakup image. (c) Three fields of the Side-lit LBSR Stencil-FSC method and (d) enlargement of its color breakup image. ... 55 Fig. 4-14 The color breakup comparison of image Lily. (a) Three fields of the
RGB-driving method and (b) enlargement of its color breakup image. (c) Three fields of the Side-lit LBSR Stencil-FSC method and (d) enlargement of its color breakup image. ... 56 Fig. 5-1 Comparison of image fidelity. (a) From top to down is: original image Red Leaf, result image by Green-based Stencil-FSC, by LBSR Stencil-FSC, and by Side-lit LBSR Stencil-FSC method, (b) the enlarged part of each method, (c) from top to down is: original image Girl, result image by Green-based Stencil-FSC, by LBSR Stencil-FSC, and by Side-lit LBSR Stencil-FSC method, and (d) the enlarged part of each method. ... 59 Fig. 5-2 Comparison of color breakup experimental result by (a) image Lily using the RGB-driving method, and (b) using the Side-lit LBSR Stencil-FSC method, (c) image
Gallery using the RGB-driving method, and (b) using the Side-lit LBSR Stencil-FSC
method. ... 60 Fig. 5-3 Three field-images of the green-based method: (a) 1st field-image, (b) 2nd field-image, and (c) 3rd field-image; three field-images of the proposed method: (d) 1st field-image, (e) 2nd field-image, and (f) 3rd field-image. ... 62 Fig. 5-4 Three field-images of schematic image, (a) 1st field-image, (b) 2nd field-image,
Fig. 5-5 Color breakup comparison between (a) the proposed Side-lit LBSR
Chapter 1
Introduction
Nowadays, liquid crystal displays (LCDs) are greatly applied in our display products. The development of field-sequential-color LCDs (FSC LCDs) pursues to reduce the power consumption [1]. However, color breakup (CBU) phenomenon is a key issue in FSC-LCDs. In this chapter, FSC-LCDs and color breakup issue will be introduced, and then the motivation and objective of this thesis will be given. The final section is the organization of this thesis.
1.1 Field-Sequential-Color Liquid Crystal Displays (FSC-LCDs)
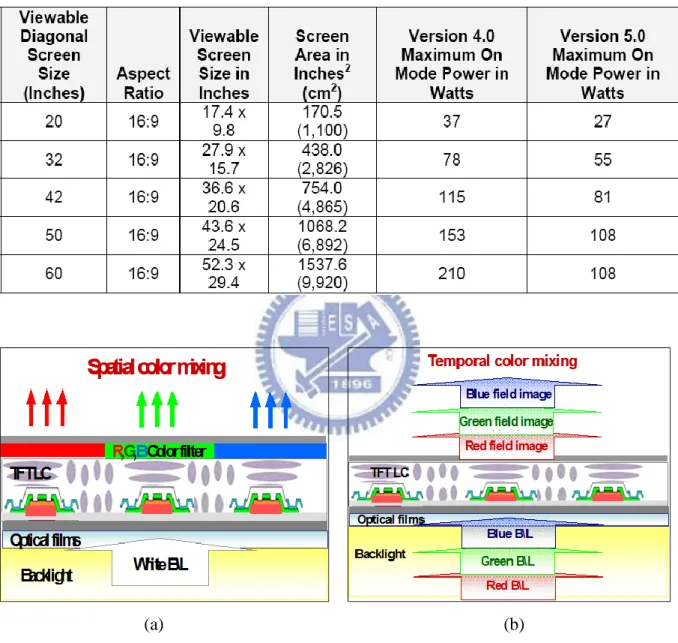
These days, the phenomenon of global warming is impacting the way of human life. Therefore, reducing the power consumption of electrical products has become an important topic in many research areas. According to the partner commitments of “Energy Star” [2] signed by U.S. Department of Energy (DOE) and Environmental Protection Administration (EPA), the power consumption requirements for TVs larger than 50 inches should be lower than 108 watts as shown in Table 1-1. Therefore, FSC-LCDs become a popular research topic in the display category.
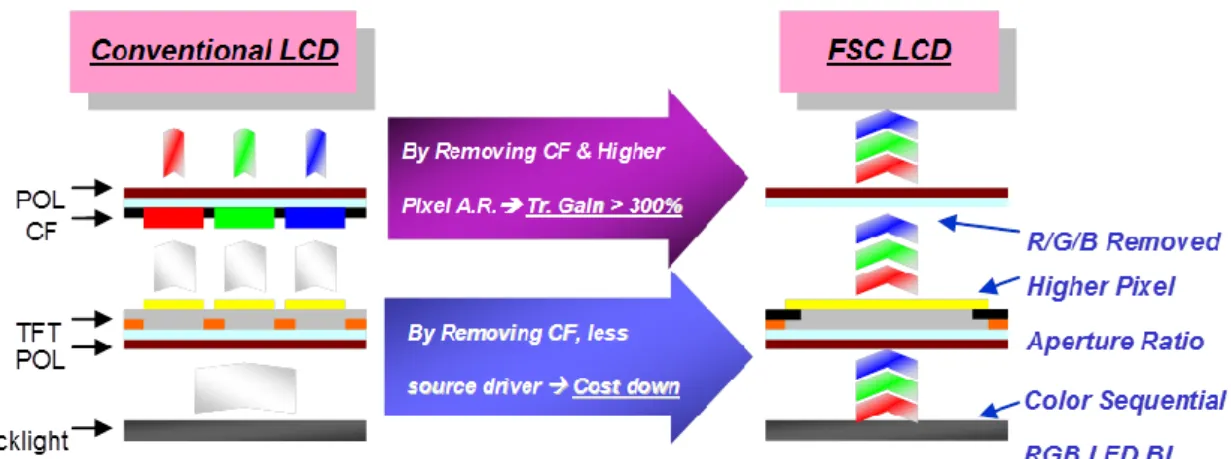
Conventional LCDs using cold cathode fluorescent lamps (CCFLs) as backlight sources are thick and high power consumption. The structure of a conventional CCFL-LCD and a field-sequential-color (FSC) LCD are shown in Fig. 1-1 (a) and (b), since the optical efficiency of color-filter type CCFL-LCD is approximately 5% ~ 10% only, which means high power consumption. Field-sequential-color (FSC) LCDs without color-filters using
advantages of a color filter-less FSC-LCD are higher optical throughput, lower material cost, wider color gamut, and three times possible higher resolution as shown in Fig. 1-2.
Table 1-1 Sample version 4.0 and 5.0 on mode power level requirements for example TV screen sizes.
(a) (b)
Fig. 1-1 The structure of (a) conventional CCFL-LCD, and (b) FSC-LCD.
The driving mechanism of FSC-LCD is illustrated inFig. 1-3. In a 60-Hz refresh time of an FSC-LCD, there is only 16.7 ms can display three primary color images in a frame time. Eq. 1-1 indicates that each field needs 5.56 ms including the TFT addressing time (tTFT), LC
displaying the R, G, and B field-images, a full-color image is created by temporal color synthesis as shown in Fig. 1-3.
Fig. 1-2 The advantages of FSC LCD comparing with conventional LCD.
Fig. 1-3 FSC-LCD driving mechanism.
𝟏 𝑵𝒇=
𝒕𝑻𝑭𝑻
𝒏 + 𝒕𝑳𝑪+ 𝒕𝑳𝑬𝑫 1-1
where n denotes the number of fields, f denotes frame frequency of 60 Hz, N denotes the frame number, and tTFT denotes TFT driving time.
1.2 Color Breakup (CBU) Phenomenon
Even though FSC-LCD has many advantages comparing with a conventional CCFL-LCD as mentioned in section 1.1, it is facing a serious visual artifact called color breakup (CBU). Color breakup appears when there exists relative velocities between human eye and display object or occurs when human eye follows an image or scans an image on a screen quickly and sporadically. In that case, three primary color field images (R, G, and B field) do not overlap perfectly on the retina and it will degrade image fidelity [8]. This phenomenon might cause discomfort in human eye as shown in Fig. 1-4.
To solve the color breakup phenomenon, some methods were proposed such as: increasing frame rate to shorten the width of separated color at the edge, inserting complementary color field to reduce the color difference between each field, or inserting multi-color field (ex: Stencil-FSC) to display high luminance and rough color in first field to decrease the luminance of separated color. Nevertheless, Stencil-FSC methods still exist several issues: a little high frame rate (240Hz Stencil-FSC), and color distortion (120Hz Stencil-FSC). The detailed mechanism color breakup suppression methods will be described in Ch2. In case the color breakup phenomenon is solved, it is high feasible to develop a low power consumption and high image quality eco-LCDs.
(a) (b)
Fig. 1-4 (a) Target image, and (b) simulated color breakup image with 10 pixels shifted.
Full
color
image
C
B
U image
Eye Movement
1.3 Motivation and Objective
Color filter-less FSC-LCDs have higher optical throughput which reduce more power consumption, and display higher color gamut using multi-colored LEDs. However, FSC-LCDs still exist a fatal issue called color breakup. This phenomenon degrades image fidelity and discomforts viewer’s eyes. Therefore, our research group has proposed the 180Hz Stencil-FSC method to effectively suppress color breakup phenomenon [10].
However, the original 180Hz Stencil-FSC method still faces lower image fidelity especially in the image containing plenty of green information as shown in Fig. 1-5. This phenomenon is happened due to the inappropriate decision of backlight signal in the algorithm as shown in Fig. 1-6. Therefore, a novel backlight signal determination method which is called Limited Backlight Signal Ratio (LBSR) determination method is proposed to improve the image fidelity for all kinds of images in this thesis.
Fig. 1-5 Redundant color propagates through the first field resulting in reduction of green color saturation.
In current display industry, CCFL is usually utilized as a backlight source in commercial display products because it is a cheap and mature technology. However, in recent years, utilizing LEDs as a backlight source is more and more popular because it is mercury-free, longer life time, lower power consumption, and wider color gamut than those of CCFLs as shown in Fig. 1-7.
Fig. 1-7 The color gamut comparison between CCFL and RGB LED light source [9].
Moreover, the direct-lit backlight source is utilized in most current LCDs which are thick and heavy. Therefore, the development of side-lit backlight panel is a trend for thinner and lighter LCDs in current consumers’ requirement. Fig. 1-8 obviously shows the difference thickness between direct-lit and side-lit backlight types of LCD monitors. Therefore, in this thesis, a light spread function (LSF) model of side-lit LED backlight is proposed to integrate in the proposed new backlight signal determination method in the algorithm to achieve thinner and lighter panels.
(a) (b)
Fig. 1-8 Two backlight types of LCDs: (a) direct-lit backlight, and (b) side-lit backlight.
1.4 Organization of This Thesis
This thesis is organized as follows. In Chapter 2, at first, the human vision system is introduced and the detailed mechanism of different kinds of color breakup phenomenon is presented. Next, prior arts of color breakup suppression methods are introduced. Furthermore, the Stencil-FSC methods proposed by our research group is detailed described, and then the evaluation index of image fidelity and color breakup by the color difference CIEDE2000 are also introduced. Finally, the Taguchi method is utilized to optimized backlight divisions and hardware parameters. In Chapter 3, the concept of the LBSR method and the simulation model of side-lit LED backlight are detailed described. In Chapter 4, the hardware parameters like the sigma values of light spread function model and the number of backlight divisions in the proposed method will be optimized to improve image fidelity and suppress color breakup effectively. The experimental images will be presented and the evaluation index will be compared with prior color breakup suppression methods. Finally, the conclusion and future work will be given in Chapter 5.
Chapter 2
Principles
Color filter-less FSC-LCDs have the advantages of higher optical throughput, lower material cost, wider color gamut, and three times possible higher resolution. However, color breakup phenomenon occurred by the existence of relative velocities between human eye and screen object which degrades the image clarity and discomforts human eye. Therefore, research in color breakup mechanisms and suppression methods will be discussed. Color breakup phenomenon will be quantified by the evaluation index of modified CIEDE2000, and then talk about the analysis tool of optimization by the Taguchi method.
2.1 Human Vision System
2.1.1 Human Eye Structure
Color breakup phenomenon has relation with the mechanism of human eye. Fig. 2-1 [11] shows the cross-section structure of human eyeball and a schematic enlargement of the retina. The reflected light from image is transmitted and refracted by the lens, eventually projected onto the retina. The retina is light sensitive nerve tissue in the eye that converts images from the eye's optical system into electrical impulses that are sent along the optic nerve to the brain. In the human eye, there are many more rod cells in the retina than there are cone cells as shown in Fig. 2-2 [12]. Rod cells are sensitive to low levels of illumination (called scotopic vision); the response is slow and is not involved in color vision. On the contrary, cones cells are sensitive for high levels of illumination (called photopic vision) with faster response and color vision. Cone cells are composed of S-cones, M-cones, and L-cones which are responded by short-wavelength,
middle-wavelength, and long-wavelength respectively as shown in Fig. 2-3 [13]. That is why human perceive vivid colors.
Fig. 2-1 A drawing of a cross-section through the human eye with a schematic enlargement of the retina including rod cells and cone cells.
Fig. 2-3 Response of the three human cone types to light of different wavelengths.
2.1.2 Types of Eye Movements
There are two types of eye movements which are saccade and smooth pursuit [14]-[19]. Fig. 2-4 shows the eye-movement traces by saccading an object [20]. Saccade is eye-movements trace on an object which the velocities and directions of eyes are voluntary. We make about 3 saccadic eye movements a second and more than 150,000 saccadic eye movements a day. Fig. 2-5 shows smooth pursuit diagram [21], when human eye tracks a moving object with same velocity, the object can be caught by human eye clearly.
Fig. 2-4 By Yarbus* shows eye-movement traces while a subject explores a picture of the bust of Nefertiti. *: from "Eye Movements and Vision" by A. L. Yarbus; Plenum Press, New York; 1967.
Fig. 2-5 Smooth pursuit of an object.
2.2 Color Breakup Mechanism
Color breakup (CBU) phenomenon is occurred when there exists relative velocity between human eye and the screen object. This phenomenon causes discomfort in human eye and degrades image quality. Therefore, understanding color breakup mechanism is essential to make methods to suppress the annoying phenomenon. As discussed above, color breakup is dependent on the types of eyes movement which are saccade and smooth pursuit. Therefore, color breakup phenomenon can be classified into two types: dynamic color breakup and static color breakup according to moving feature of images and eyes movement.
2.2.1 Dynamic Color Breakup
The dynamic color breakup phenomenon is mostly occurred at edges of moving objects on FSC-LCDs. Fig. 2-6 shows the perception mechanism of dynamic color breakup [22]. The horizontal axis is the position in a FSC-LCD, and the vertical axis is time. The colors which consist of white (in here are R, G, and B) are displayed temporally in a field time, and the next time displayed in different position. By eye integration, the three primary-colors are
Fig. 2-6 Perception mechanism of dynamic color breakup.
2.2.2 Static Color Breakup
Static color breakup occurs when human eye glancing a stationary image. Fig. 2-7 shows the perception mechanism of static color breakup [22]. The still white image which consists of three primary-colors is displayed in a FSC-LCD. When human eyes glances the image to obtain details, the R, G, and B sub-field image are projected on to retina separately, and color breakup is perceived at the edge of still image. This effect is much easier to be seen rather than dynamic CBU. Most observers have discomfort feeling caused by this static color breakup.
Fig. 2-7 Perception mechanism of static color breakup.
2.3 Prior Color Breakup Suppression Methods
Color breakup phenomenon is a fatal drawback of FSC-LCDs; this phenomenon causes discomfort in human eyes and degrades image quality. Therefore, color breakup suppression has been a major research in the FSC technique. Many color breakup suppression methods were proposed in different ways which can be categorized into inserting mono-color field, motion compensation, and inserting multi-color field as shown in Fig. 2-8.
Fig. 2-8 Prior color breakup suppression methods of FSC-LCD.
In the inserting mono-color field part, the first one is to increase the field rate to 360Hz (such as RGBRGB or RGBKKK) [23] [24] or higher, the width of separated rainbow-like colors occurred at the edge of an image can be reduced on retina while eyes movement as simulated images in Fig. 2-9. This method are usually be utilized in the DLP projector with color wheel and its digital micro-mirror device (DMD). The second one is to insert complementary color field to original three primary fields (RGBCY), this can reduce the color difference between each field and prevent from appearance of the sensitive color at the edge of images as shown in Fig. 2-10. However, increasing high field rate might be not feasible in current LC response time.
(a) 180Hz RGB (b) 360Hz RGBRGB
Fig. 2-9 Simulation color breakup image of (a) 180Hz RGB, and (b) 360Hz RGBRGB.
(a) 180Hz RGB (b) 300Hz RGBCY
Fig. 2-10 Simulation color breakup image of (a) 180Hz RGB, and (b) 300Hz RGBCY.
Motion compensation method was proposed to solve the dynamic color breakup phenomenon effectively. Fig. 2-11 shows the mechanism of motion compensation [24]. The method is to display each field with a proper shift according to the moving velocity of input image, after human eye integration color breakup can be suppressed effectively. However, if some objects have a chance to cross the observer’s tracking object in an opposite direction as shown in Fig. 2-12, the perceived momentary image of the crossing object gets worse color breakup than conventional RGB-driving method.
Fig. 2-11 The mechanism of motion compensation; color breakup was suppressed effectively.
Fig. 2-12 The mechanism of motion compensation; object and observer’s eye trace movement in the opposite position.
The color breakup suppression methods as mentioned above can be effectively solved the color breakup phenomenon, but those are hard to implement on hardware due to the LC
response time is not fast enough to be implemented in current commercial display products. In order to implement FSC method on hardware, the field rate must be further reduced to lower rate. Therefore, our team proposed Stencil-FSC methods which the field rate is lower than 240Hz and with multi-color single field to suppress color breakup effectively [25] [26] [27]. Fig. 2-13 shows the Stencil-FSC methods with different field images proposed by our group. The concept of 240Hz Stencil-FSC method is to display majority information of input image with high luminance and rough color in the first field. The other two fields were display the detail of the remaining information with lower luminance. Therefore, the perceived luminance of the separated color at the edge of image was decreased and almost imperceptible. Comparing to the color breakup phenomenon of RGB-driving method as shown in Fig. 2-14(a), the color breakup phenomenon of 240Hz Stencil-FSC method was shown in Fig. 2-14(b).
Because of 240Hz field rate is still a little high to be hard implemented in large size FSC-LCDs. Therefore, our team proposed the 180Hz Stencil-FSC method to further improve this issue. The concept of the 180Hz Stencil-FSC method is due to human eye is most sensitive to green color, hence all green information plus some parts of red and blue information are displayed in the first field. The remaining red and blue information are displayed in the second and third field. Therefore, when color breakup phenomenon is perceived, the separated rainbow-like edge is almost without green information, color breakup phenomenon is almost imperceptible as shown in Fig. 2-14 (c). In current 180Hz Stencil-FSC can be implemented in the OCB mode of LC in large size display.
In order to implement Stencil-FSC in commercial LC mode like TN, VA, MVA, IPS ...etc., our team proposed 120Hz two-color-field method. The concept of 120Hz two-color-field method is due to human eye is less sensitive to blue color, hence red and a part
phenomenon is also suppressed with less image distortion. The comparison of color breakup phenomenon between RGB-driving method and 120Hz two-color-field method are shown in Fig. 2-15 (a) and Fig. 2-15 (b).
(a) 240Hz Stencil-FSC (b) 180Hz Stencil-FSC (c) 120Hz Two-color-field
Fig. 2-13 The concept of Stencil-FSC methods: (a) 240Hz Stencil-FSC (b) 180Hz Stencil-FSC, and (c) 120Hz Two-color –field FSC.
(b) Color breakup image of 240Hz Stencil-FSC method with target image Girl
(c) Color breakup image of the 180Hz Stencil-FSC method with target image Girl
Fig. 2-14 Color breakup of image Girl by different FSC methods: (a) RGB-driving, (b) the 240Hz Stencil-FSC method, and (c) the 180Hz Stencil-FSC method.
(a) Color breakup image of two-color-field method with target image Color Ball
Fig. 2-15 Color breakup of image Color Ball by (a) RGB-driving, and (b) 120Hz two-color-field method.
2.4 Evaluation Index of Color Breakup and Image Fidelity
2.4.1 CIE 1931 Colorimetric Observations
Considering the trichromatic color space, it is possible to match an arbitrary color by mixing the red, green and blue primary colors. Fig. 2-16 shows the setup for color-matching experiments [28]. An arbitrary light of the color under investigation illuminates the lower half of the white screen which produces a stimulus to the human eye through the black shadow. Red, green and blue lights illuminate the upper half of the white screen. The intensities of the red, green and blue lights are adjusted to match the color of the lower light. According to the trichromatic color space, it is possible to find a set of R, G and B to fit the color to be matched. In 1931 the CIE used three primary colors with wavelengths 700, 546.1 and 435.8 nm to match all visible monochromatic lights. As shown in Fig. 2-17 (a), the CIE 1931(R, G, B) chromaticity diagram can be obtained, shown in Fig. 2-17 (b).
Fig. 2-16 Experimental setup for color-matching experiments.
(a) (b)
Fig. 2-17 (a) Tristimulus values for different wavelengths, and (b) CIE 1931 (R, G, B) chromaticity diagram.
Due to the linear summation of different color stimuli, a spectrum with many different wavelengths can be divided into monochromatic lights and be viewed as the color mixing of each monochromatic component. Hence, any color can be represented by the horseshoe-shaped region, formed by the monochromatic light locus and the connection between 380 and 780 nm. In color-matching experiments as shown in Fig. 2-16, one cannot obtain the matched color no matter how one adjust the (R, G, B) intensities. However, it is
entirely satisfactory [29]. To improve on this, the CIE 1931 (X, Y, Z) system as shown in Fig. 2-18 was proposed using the Eq. 2-1.Ttherefore, all color can be described by positive values. One important feature of the CIE 1931 (X, Y, Z) color system is that the Y value is set as the luminance of the stimulus, in terms of lm sr-1 or cdm-2. To obtain the CIE 1931 (X, Y, Z) color coordinates from a spectrum, the linear summation of each wavelength is used as shown in Eq. 2-2.
Fig. 2-18 CIE 1931 (X, Y, Z) chromaticity diagram.
𝒙 =𝟎.𝟒𝟗𝟎𝟎𝟎𝒓+𝟎.𝟑𝟏𝟎𝟎𝟎𝒈+𝟎.𝟐𝟎𝟎𝟎𝟎𝒃 𝟎.𝟔𝟔𝟔𝟗𝟕𝒓+𝟏.𝟏𝟑𝟐𝟒𝟎𝒈+𝟏.𝟐𝟎𝟎𝟔𝟑𝒃 𝒚 = 𝟎.𝟏𝟕𝟔𝟗𝟕𝒓+𝟎.𝟖𝟏𝟐𝟒𝟎𝒈+𝟎.𝟎𝟏𝟎𝟔𝟑𝒃 𝟎.𝟔𝟔𝟔𝟗𝟕𝒓+𝟏.𝟏𝟑𝟐𝟒𝟎𝒈+𝟏.𝟐𝟎𝟎𝟔𝟑𝒃 𝒛 =𝟎.𝟎𝟎𝟎𝟎𝟎𝒓+𝟎.𝟎𝟏𝟎𝟎𝟎𝒈+𝟎.𝟗𝟗𝟎𝟎𝟎𝒃 𝟎.𝟔𝟔𝟔𝟗𝟕𝒓+𝟏.𝟏𝟑𝟐𝟒𝟎𝒈+𝟏.𝟐𝟎𝟎𝟔𝟑𝒃 2-1 𝑿 = 𝒌 ∫ 𝑷(𝝀)𝒙̅(𝝀)𝒅(𝝀)𝝀 𝒀 = 𝒌 ∫ 𝑷(𝝀)𝒚̅(𝝀)𝒅(𝝀)𝝀 𝒁 = 𝒌 ∫ 𝑷(𝝀)𝒛̅(𝝀)𝒅(𝝀)𝝀
𝒙 =𝑿+𝒀+𝒁𝑿
𝒚 = 𝒀
𝑿+𝒀+𝒁 2-2
where k=683 lm W-1, which represents the transformation from radiometry units (W) to photometry units (lm), and P(λ) is the spectral distribution of the stimulus in terms of W sr-1 m-2.
2.4.2 CIE 1976 Uniform Color System
Although the CIE 1931 (X, Y, Z) color system can describe a color exactly, there is a problem when dealing with color difference and tolerance [30][31]. Fig. 2-19 shows the famous MacAdam ellipses in the CIE 1931 (X, Y, Z) chromaticity diagram [32]. Color differences cannot be discerned by the human eye within the ellipses in this figure. To better illustrate the color difference between two stimuli, it is necessary to have a uniform color system. In 1976 CIE provided CIELAB and CIELUV color systems to further describe uniform color space which are utilized in industrial applications. Eq. 2-3 derives the coordinate transform from the CIE 1931 (X, Y, Z) to the 1976 (L*, a*, b*) color system. In the equation, Xn, Yn, and Zn are the three tristimulus values of reference white. L* represents
lightness, a* approximate redness-greenness, and b* approximate yellowness-blueness. Therefore, the color difference is more uniform given by the formula of ΔE*ab. The CIELAB
provided a uniform chromaticity diagram as shown in Fig. 2-20, so that most of color difference formulas were established based on the CIELAB color space.
Fig. 2-19 MacAdam ellipses in the CIE 1931 (X, Y, Z) chromaticity diagram.
Fig. 2-20 CIELAB color space.
𝑳∗ = { 𝟏𝟏𝟔 (𝒀 𝒀𝒏) 𝟏 𝟑 − 𝟏𝟔; 𝒇𝒐𝒓 𝒀 𝒀𝒏 > 0.00885𝟔 𝟗𝟎𝟑. 𝟑 𝒀 𝒀𝒏; 𝒇𝒐𝒓 𝒀 𝒀𝒏 ≤ 𝟎. 𝟎𝟎𝟖𝟖𝟓𝟔 𝒂∗ = 𝟓𝟎𝟎 *𝒇 (𝑿 𝑿𝒏) − 𝒇 ( 𝒀 𝒀𝒏)+ ; 𝒃∗ = 𝟐𝟎𝟎 *𝒇 (𝒀 𝒀𝒏) − 𝒇 ( 𝒁 𝒁𝒏)+ ;
Where 𝒇 (𝒀𝒀 𝒏) = { 𝒀 𝒀𝒏 𝟏 𝟑⁄ 𝒇𝒐𝒓 𝒀𝒀 𝒏 > 0.008856 𝟏 𝟑( 𝟐𝟗 𝟔) 𝟐 𝒀 𝒀𝒏+ 𝟏𝟔 𝟏𝟏𝟔 𝒇𝒐𝒓 𝒀 𝒀𝒏≤ 𝟎. 𝟎𝟎𝟖𝟖𝟓𝟔 𝜟𝑬∗ 𝒂𝒃= √(∆𝑳∗)𝟐+ (∆𝒂∗)𝟐+ (∆𝒃∗)𝟐 2-3
2.4.3 Color Difference of CIEDE2000
Based on the color difference of 1976 CIELAB, CIE modified the formula to describe all color difference ranges and proposed the CIEDE2000 [33]-[36]. To revise the issue of color uniformity, the formula as shown in Eq. 2-4 is considered the weighting function of lightness (SL), chroma (SC), and hue (SH). The kL, kC, and kH values are the parametric factors adjusted
according to different viewing parameters, for the lightness, chroma, and hue components, individually. RT function is intended to improve the performance of the color difference
equation for describing chromatic differences in the blue region.
𝜟𝑬𝟎𝟎 = √(∆𝑳 ∗ 𝑲𝑳𝑺𝑳) 𝟐 + (∆𝑪𝒂𝒃∗ 𝑲𝑪𝑺𝑪) 𝟐 + (∆𝑯𝒂𝒃∗ 𝑲𝑯𝑺𝑯) 𝟐 + 𝑹𝑻(∆𝑪𝒂𝒃 ∗ 𝑲𝑪𝑺𝑪) ( ∆𝑯𝒂𝒃∗ 𝑲𝑯𝑺𝑯) 2-4 𝑺𝑳 = 𝟏, 𝑺𝑪 = 𝟏 + 𝟎. 𝟎𝟒𝟓𝑪𝒂𝒃∗ , 𝒂𝒏𝒅 𝑺 𝑯 = 𝟏 + 𝟎. 𝟎𝟎𝟏𝟓𝑪𝒂𝒃∗ 2-5 Where ∆𝐿∗, ∆𝐶 𝑎𝑏∗ , ∆𝐻𝑎𝑏∗ : 𝐷𝑖𝑓𝑓𝑒𝑟𝑒𝑛𝑐𝑒𝑠 𝑜𝑓 𝑙𝑢𝑚𝑖𝑛𝑎𝑛𝑐𝑒, 𝑐𝑟𝑜𝑚𝑎, 𝑎𝑛𝑑 𝑢𝑒 𝐾𝐿, 𝐾𝐶, 𝐾𝐻: 𝑃𝑎𝑟𝑎𝑚𝑒𝑡𝑟𝑖𝑐 𝑓𝑎𝑐𝑡𝑜𝑟𝑠 𝑜𝑓 𝑙𝑢𝑚𝑖𝑛𝑎𝑛𝑐𝑒, 𝑐𝑟𝑜𝑚𝑎, 𝑎𝑛𝑑 𝑢𝑒 𝑆𝐿, 𝑆𝐶, 𝑆𝐻: 𝑊𝑒𝑖𝑔𝑡𝑖𝑛𝑔 𝑓𝑢𝑛𝑐𝑡𝑖𝑜𝑛 𝑜𝑓 𝑙𝑢𝑚𝑖𝑛𝑎𝑛𝑐𝑒, 𝑐𝑟𝑜𝑚𝑎, 𝑎𝑛𝑑 𝑢𝑒 𝑅𝑇: 𝑅𝑜𝑡𝑎𝑡𝑖𝑜𝑛 𝑓𝑢𝑛𝑐𝑡𝑖𝑜𝑛
In the thesis, color breakup phenomenon is quantified by the CIEDE2000. Color breakup phenomenon was perceived when the edge of field images separated because of relative
difference as shown in Fig. 2-21 (c), the color breakup phenomenon was looked like motion blur only; the color breakup was hardly perceived by human eye in the situation. Therefore, in this thesis, we modify the color difference formula of CIEDE2000 to extract the luminance term (∆𝐿
∗
𝐾𝐿𝑆𝐿)
2
in Eq. 2-4 to be independent of chroma term and hue term as shown in Eq. 2-6. By utilizing the modified CIEDE2000, the luminance difference can less effect the color breakup phenomenon to be an objective index.
Modified 𝜟𝑬𝟎𝟎 = |∆𝑳 ∗ 𝑲𝑳𝑺𝑳| ∗ √( ∆𝑪𝒂𝒃∗ 𝑲𝑪𝑺𝑪) 𝟐 + (∆𝑯𝒂𝒃∗ 𝑲𝑯𝑺𝑯) 𝟐 + 𝑹𝑻(∆𝑪𝒂𝒃 ∗ 𝑲𝑪𝑺𝑪) ( ∆𝑯𝒂𝒃∗ 𝑲𝑯𝑺𝑯) 2-6 (a) (b) (c)
Fig. 2-21 (a) Original image (b) color breakup image, and (c) difference between (a) and (b).
2.5 Taguchi Quality Engineering Method
Dr. Genichi Taguchi has developed a method based on orthogonal arrays (OA) experiments which gives much reduced variance for the experiment with optimum settings of control parameters. Thus the combination of Design of Experiments with optimization of control parameters to get best results is achieved in the Taguchi Method. Orthogonal Arrays provide a set of reduced experiments with well balanced. The Signal-to-Noise (SN) ratios in the Taguchi Method, which are log functions for optimization, help in data analysis and prediction of optimum results.
The Taguchi Method treats optimization problems in two categories: static problems and dynamic problems [37]. To optimize a process which has several control factors is directly
decided the target of the output. The optimization involves determining the best control factor levels makes the output is at the target value. Such a problem is called as a static problem. If the process to be optimized has a signal input that directly decides the output, the optimization involves determining the best control factor levels makes the input signal / output ratio is closest to the desired relationship. Such a problem is called as a dynamic problem. In this thesis, the statics problems are utilized for the control factors is directly decided the target of the output.
Statics problems can be best explained by using a P-Diagram which is shown in Fig. 2-22. The noise exists in the process which has no effect on the output. The main target of the Taguchi Method is to minimize variations in output even though noise exists in the process.
Fig. 2-22 P – Diagram for static problems.
There are three Signal-to-Noise ratios for optimization in static problems. First is smaller-the-better which is defined in Eq. 2-7. The chosen ideal value of SN ratio for all undesirable characteristics is zero. When an ideal value is finite and its maximum or minimum value is defined then the difference between measured data and ideal value is
𝑺𝑵 = −𝟏𝟎 𝒍𝒐𝒈 (𝟏𝒏∑𝒏 𝒚𝒊𝟐
𝒊=𝟏 ) 2-7
Second is larger-the-better which is defined in Eq. 2-8, which has been converted to smaller-the-better by taking the reciprocals of measured data and then taking the S/N ratio as in the smaller-the-better case.
𝑺𝑵 = −𝟏𝟎 𝒍𝒐𝒈 (𝟏𝒏∑ 𝟏
𝒚𝒊𝟐 𝒏
𝒊=𝟏 ) 2-8
Third is nominal-the-best which is defined in Eq. 2-9. When a specified value is most desired, which means neither a smaller nor a larger value is desirable.
𝑺𝑵 = 𝟏𝟎 𝒍𝒐𝒈 (𝒚𝑺𝟐𝟐−𝟏𝒏) 2-9
where S is the standard deviation of experiment
2.6 Summary
The artifact of FSC-LCDs called color breakup is perceived by the relative velocity between human eye and screen object, this phenomenon degrades image clarity and discomforts human eye. Some methods have proposed to suppress color breakup effectively. However, these methods have drawbacks to be hardly implemented. The 180Hz Stencil-FSC method with low field rate could achieve on large size FSC-LCDs using OCB mode LC and can suppress color breakup effectively. However, the 180Hz Stencil-FSC method de-saturated green color due to the redundant red and blue light propagated in the first field. Therefore, the Limited Backlight Signal Ratio (LBSR) determination method is proposed to improve the image fidelity by combining the model of side-lit light spread function in the algorithm to make panel thinner and lighter. By utilizing the Taguchi Method to decide the proper
parameters of light intensity distribution in light spread function which satisfied uniformity requirement. Finally, quantifying the image fidelity and color breakup suppression by the formula of modified CIEDE2000.
Chapter 3
Side-lit LBSR 180Hz Stencil-FSC Method
Field-Sequential-Color LCDs with local dimming technology have developed to reduce power consumption. The 180Hz Stencil-FSC method proposed by our group can suppress color breakup effectively. However, if the images contain plenty of green information, red and blue light might be propagated into the first field resulting in the green color was de-saturated, the image fidelity was degraded. Therefore, to overcome this issue, we proposed a novel backlight signal determination method called “Limited Backlight Signal Ratio” (LBSR) to decide suitable backlight signals to avoid redundant red and blue light propagating in the first field. Moreover, thin and light panel is attracting consumers, by utilizing side-lit LED as backlight source can be developed in thinner panel. Therefore, we proposed the simulation of side-lit light spread function in this thesis, and combining with the LBSR method. As a result, it is promising to develop a high image quality, low power consumption, and extreme thin Eco-LCDs.
3.1 65-inch Field-Sequential-Color LCD Demonstration
The 65-inch Field-Sequential-Color LCD has been developed by AU Optronics Corp. (AUO), Hsinchu Taiwan as shown in Fig. 3-1. The LC mode of the panel is VA mode, the resolution is 1920 by 1080, and the backlight division is 32 by 24 with RGB LED as backlight source. In Fig. 3-1 (a), when the backlight is turned off, the 71 Watts shown in power-meter were produced by the fan and drivers. The 180Hz Stencil-FSC method has successfully applied in the 65-inch FSC-LCD, as shown in Fig. 3-1 (b). The power of backlight is evaluated by the International Electrotechnical Commission’s (IEC) 62087:2008 video as shown in Fig. 3-2. The video is 10 minutes long and the frame rate is 30 frames per second, so
there are total around 18000 frames in the video to be calculated the power consumption of each frame. By calculating all the frames, the power consumption of backlight source is only 52W in average. From the demonstration of 65-inch FSC-LCD with the 180Hz Stencil-FSC method, it is promising to develop low power consumption LCDs.
(a) (b)
Fig. 3-1 (a) The 65-inch Field-Sequential-Color LCD provided by AUO, and (b) display the image by utilizing the 180Hz Stencil-FSC method.
Fig. 3-2 The power consumption of backlight source evaluated by the IEC 62087:2008 video.
low when displaying image contains plenty of green information by utilizing the 180Hz Stencil-FSC method as shown in Fig. 3-3 (b). Therefore, in the following sections, we will introduce the proposed novel backlight determination method to solve the issue of redundant light and the simulation of light distribution of side-lit light spread function to develop the low power and extreme thin eco-LCD.
(a) (b)
Fig. 3-3 (a) Input image, and (b) displayed image which the green color is de-saturated in 65-inch FSC-LCD by the 180Hz Stencil-FSC method.
3.2 Side-lit 180Hz LBSR Stencil-FSC Method
3.2.1 Limited Backlight Signal Ratio Decision Method
As mentioned above, the concept of the 180Hz Stencil-FSC method as shown in Fig. 3-4 is because of human eye is most sensitive to green color, the red and blue signals are therefore redistributed into the green field to create a “green-based field-image” in the first field. When the separated colors do not contain green information, the color breakup phenomenon is reduced. The method is to determine the red, green, and blue backlight signals (BLR, BLG, and
BLB), then calculate the compensated LC signals (TR, TG, and TB) respectively. Combining
the red, green, and blue backlight signals (BLR, BLG, and BLB) with the green LC signal (TG)
in the first field to generate green-based field-image. The second field is to combine the red backlight signal (BLR) with corresponding red LC signal (TR’) which is equal to TG minus TR
to generate the remnant red information. The third field is to combine the blue backlight signal (BLB) with corresponding blue LC signal (TB’) which is equal to TG minus TB to
generate the remnant blue information. By sequentially displaying these three field images in a 180Hz frame rate, the colorful image is produced.
Fig. 3-4 The concept of the 180Hz Stencil-FSC method.
However, if the image contains plenty of green information, this method will display too much red and blue color to de-saturate the green color. It is due to after determining the backlight signals; the compensated LC signals TR, TG, and TB will be calculated. When TR’ or
TB’ are less than zero, this means the redundant red or blue light are propagated into the first
field, thus this caused the green colors are not pure, so the image distortion is perceived as shown in Fig. 3-5.
Fig. 3-5 Redundant red and blue light propagate into the first field resulting in the green color was de-saturated.
Therefore, to solve this issue we proposed a novel backlight signal determination method called “Limited Backlight Signals Ratio” (LBSR) decision method to determine suitable backlight signals to avoid the redundant red and blue color light propagating into the first field and clipping phenomenon in other fields.
By using the local color-backlight-dimming technology [38], the backlight signal and compensated LC signal can be recalculated by Eq. 3-1, where Ii is the intensity of input image,
BLifull is the luminance of full-on backlight, and Tifull is the transmittance of each R, G, and B
sub-pixels. To prevent the redundant light from displaying in the first field, the green backlight signal is determined by the maximum (TGfull) of each backlight division. The
compensated LC signals are calculated by the Eq. 3-2 and Eq. 3-3, which guarantee that all green information can be displayed in the first field with less compensated LC signal.
𝑰𝒊𝒇𝒖𝒍𝒍 = 𝑰𝒊 → 𝑩𝑳𝒊𝒇𝒖𝒍𝒍× 𝑻𝒊𝒇𝒖𝒍𝒍 = 𝑩𝑳𝒊× 𝑻𝒊 𝒊 = 𝑹, 𝑮, 𝑩 3-1
Here 𝐵𝐿𝑓𝑢𝑙𝑙𝑖 =1, and the signals of green backlight was assumed to be
𝑩𝑳𝑮𝟏𝒔𝒕 = 𝒎𝒂𝒙(𝑻 𝑮
𝒇𝒖𝒍𝒍)
𝑻𝑮= 𝑩𝑳𝑮𝒇𝒖𝒍𝒍
𝑩𝑳𝑮𝟏𝒔𝒕 × 𝑻𝑮
𝒇𝒖𝒍𝒍 = 𝑻𝑮𝒇𝒖𝒍𝒍
𝑩𝑳𝑮𝟏𝒔𝒕 3-3
where BLG1st is the green backlight signal in each backlight division, andTG is the compensated
signal of green sub-pixel.
As mentioned above, when the second or third field LC transmittance TR’ or TB’ are less
than zero, the redundant red or blue light are propagated into the first field to de-saturated green color. In order to prevent redundancy defects, the “Limited Backlight Signals Ratio” decision method can be derived by the relationships in Eq. 3-4 and Eq. 3-5. According to the relations, TR’ is equal to the calculated TR minus TG, TB’ is equal to the calculated TB minus
TG, if the values are larger or equal to zero, the red and blue light will not display too much in
the first field. Here TR is equal to TRfull BLR1st, TG is equal to TGfull BLG1st, and TB is equal to TBfull BLB1st. 𝟎 ≤ 𝑻𝑹′ = 𝑻 𝑹− 𝑻𝑮 𝑩𝑳𝑹𝟏 𝒔𝒕 ≤𝑻𝑹𝒇𝒖𝒍𝒍 𝑻𝑮𝒇𝒖𝒍𝒍× 𝑩𝑳𝑮 𝟏𝒔𝒕 3-4 𝟎 ≤ 𝑻𝑩′ = 𝑻 𝑩− 𝑻𝑮 𝑩𝑳𝑩𝟏 𝒔𝒕 ≤𝑻𝑩𝒇𝒖𝒍𝒍 𝑻𝑮𝒇𝒖𝒍𝒍× 𝑩𝑳𝑮 𝟏𝒔𝒕 3-5
where 𝐵𝐿1𝑅𝑠𝑡 and 𝐵𝐿1𝐵𝑠𝑡 are the red and blue backlight signals in each backlight division.
By appropriately determining the backlight signals BLR1st, BLG1st, and BLB1st according
to the information of input image, the redundant red and blue color light can be reduced greatly in the first field-image. To further prevent the clipping phenomenon in the second and third field-image, the red and blue backlight signals of second and third field are defined as Eq. 3-6 and Eq. 3-7 respectively. Then the compensated LC signals of second and third field can be obtained by Eq. 3-8 and Eq. 3-9. The reason of choosing the maximum transmittance
smaller than one which mean the clipping phenomenon do not happen. The images of determined backlight signal in the “green-based” Stencil-FSC method and the “LBSR” Stencil-FSC method are shown in Fig. 3-6 and Fig. 3-7 respectively. The original “green-based” Stencil-FSC method in the first field shows too much red and blue colors, the green color is de-saturated. The proposed “LBSR” Stencil-FSC method provide suitable backlight signal value which can effectively prevent redundant colors in the first field, so we can get a high fidelity image with less image distortion.
𝑩𝑳𝑹𝟐𝒏𝒅 = 𝒎𝒂𝒙(𝑻 𝑹 𝒇𝒖𝒍𝒍− 𝑩𝑳 𝑹 𝟏𝒔𝒕× 𝑻 𝑮) 3-6 𝑩𝑳𝑩𝟑𝒓𝒅 = 𝒎𝒂𝒙(𝑻𝑩𝒇𝒖𝒍𝒍− 𝑩𝑳𝑩𝟏𝒔𝒕 × 𝑻𝑮) 3-7 𝑻𝑹𝟐𝒏𝒅 = 𝑻𝑹𝒇𝒖𝒍𝒍−𝑩𝑳𝑹𝟏𝒔𝒕×𝑻𝑮 𝑩𝑳𝑹𝟐𝒏𝒅 3-8 𝑻𝑩𝟑𝒓𝒅 = 𝑻𝑩𝒇𝒖𝒍𝒍−𝑩𝑳𝑩𝟏𝒔𝒕×𝑻𝑮 𝑩𝑳𝑩𝟑𝒓𝒅 3-9 (a) (b) (c)
Fig. 3-6 Images displayed by (a) BLR, BLG, and BLB (b) BLR, and (c) BLB in the “green-based”
(a) (b) (c)
Fig. 3-7 Images displayed by (a) BLR1st, BLG1st, and BLB1st, (b) BLR2nd, and (c) BLB3rd in the
“LBSR” Stencil-FSC method.
3.2.2 Side-lit Light Spread Function Simulation
Backlights can be divided into two main types of optical design for the illumination of the LCD-panel: direct-lit and side-lit as the schematic diagram shown in Fig. 3-8 [39]. Current 180Hz Stencil-FSC LCD utilizes direct-lit backlight as light source which are placed directly behind the LCD screen at a typical distance of around 30mm. This distance defines the depth of the backlight. Side-lit backlights are a commodity for notebook computers. Main advantage is the very thin form factor. All the light sources are placed at one or more sides. Furthermore for commercial TV panels, a slim panel is attractive to consumers. Therefore, we proposed the model of side-lit light spread function in the 180Hz Stencil-FSC method to develop thin eco-LCDs.
(a) (b)
Fig. 3-8 The schematic diagram of (a) direct-lit, and (b) side-lit backlight.
Fig. 3-9 (a), and then multiplies the half Gaussian function with standard deviation σy in
vertical direction in Eq. 3-11 to decrease the light intensity distribution from the light source as shown in Fig. 3-9 (b), where x represents the width of panel and y represents the height of panel. The result of LSF of the side-lit type backlight is given as shown in Fig. 3-9 (c) and the illustration of side-lit backlight spreading as shown in Fig. 3-9 (d). Consequently, combining the proposed LBSR decision method and the LSF model of side-lit backlight, the algorithm is shown in Fig. 3-10. By using this method, it is potential to make the panel thin and low power consumption. 𝑮𝒉𝒐𝒓𝒊𝒛𝒐𝒏𝒕𝒂𝒍(𝒙, 𝒚) = ∑ 𝒆 −(𝒙𝟐+𝒚𝟐 𝟐𝝈𝒙𝟐 ) 𝝈𝒙=𝝈𝒙𝒎𝒂𝒙 𝝈𝒙=𝝈𝒙𝒎𝒊𝒏 3-10 𝑮𝒗𝒆𝒓𝒕𝒊𝒄𝒂𝒍(𝒙, 𝒚) = 𝒆 −(𝒙𝟐+𝒚𝟐 𝟐𝝈𝒚𝟐 ) 3-11
Fig. 3-9 (a) Gaussian function with varied standard deviation σxmin and σxmax in horizontal
direction (b) half Gaussian function with varied standard deviation σy in vertical direction (c)
Fig. 3-10 The side-lit 180Hz LBSR Stencil-FSC method.
3.2.3
Uniformity Requirement
Considering the numbers of LED used in current commercial 46-inch side-lit type LCDs are around 100 to 200 piece. So we assume the total numbers of LED used in the simulation are 128 pieces on top and down. According to the Eq. 3-10 and Eq. 3-11, the hardware parameters σxmin, σxmax, and σxmax need to be optimized, and be modulated to change the light
intensity distribution of a LSF. By utilizing the twenty-five points measurement method as shown in Fig. 3-11, the parameters of side-lit light intensity distribution are chosen to be satisfied the uniformity larger than 80% for a panel requirement as defined in Eq. 3-12. The twenty-five points measurement method is used to select the proper parameters instead of conventional nine points measurement is because of the former is more precise than the latter in measuring the uniformity of luminance.
Table 3-1 lists the chosen parameters of the LSF with 5 levels which can be satisfied uniformity larger than 80%.
Fig. 3-11 Twenty-five points measurement method of uniformity.
𝑼𝒏𝒊𝒇𝒐𝒓𝒎𝒊𝒕𝒚 =*𝑴𝒊𝒏.(𝑳𝒖𝒎.(𝒊))|𝒊=𝟏~𝟐𝟓+
*𝑴𝒂𝒙.(𝑳𝒖𝒎.(𝒊))|𝒊=𝟏~𝟐𝟓+× 𝟏𝟎𝟎% ≥ 𝟖𝟎% 3-12
Table 3-1 The parameters of side-lit type LSF with 5 levels of each factor.
3.3 Summary
The 65-inch FSC-LCD with the 180Hz Stencil-FSC method has been developed by AU Optronics Corp. (AUO), but it has the drawback of panel thickness and image fidelity. Therefore, we proposed the LBSR decision method to effectively prevent redundant red and blue color light propagated into the first field to de-saturated green color. Combining LBSR decision method with the light distribution of side-lit light spread function in the algorithm, the twenty-five points measurement method of uniformity was utilized to select the proper parameters to satisfy the luminance uniformity larger than 80% for panel requirement. Moreover, the selected parameters of side-lit LSF and backlight division should be further optimized. Therefore, in the following chapter the optimization of hardware parameters will
Level
Factor
1
2
3
4
5
σXmin
1.6% 3% 5% 7% 9%σXmax
1.1*σXmin 1.3*σXmin 1.5*σXmin 1.7*σXmin 1.9*σXminσY
20% 25% 30% 35% 40%Chapter 4
Optimization, Simulation and Experimental
Results
From the selected hardware parameters of light intensity distribution of side-lit light spread function, we must further optimize the hardware parameters to find what set of standard deviation σxmin, σxmax, σy, and backlight divisions can get better image fidelity and
color breakup suppression. By utilizing the orthogonal arrays of Taguchi Method, we can find the best experimental result according to the signal-to-noise ratio (SN ratio). Finally, we verify the experimental results on a 46-inch MVA LCD and the comparison of image fidelity and color breakup suppression is presented.
4.1 Optimization by Taguchi Method
By the chosen parameters of side-lit light spread function which are satisfied the luminance uniformity larger than 80% in section 3.2.3, we need to further decide which set of parameters in different backlight divisions has the largest SN ratio, which means the parameters can get higher image fidelity or better color breakup suppression. The L50(21x511) of Taguchi Method’ orthogonal arrays are utilized to analyze the optimum hardware parameters as shown in Table 4-1. In this table, it can decide the optimum parameters by only fifty experiments, which greatly reduce the time of simulation. There are three kinds of factors: σxmin, σxmax, and σy, each one has five levels to design the light intensity distribution of
light spread function. We put the three factors in row 5, 6, and 7 separately to do fifty experiments which each experiment has different level according by Taguchi Method. By analyzing the average SN ratio of the fifty experiments in different backlight divisions, we
can decide the best set of parameters in different backlight divisions.
Table 4-1 The L50(21x511) orthogonal arrays of Taguchi Method
In the optimization, the minimum backlight divisions are set to be 2x1 and maximum are 2x64 as shown in Table 4-2. We take twelve images with different color saturation and image detail in the optimization as shown in Fig. 4-1. The color difference of the modified CIEDE2000 (∆𝐸00) (in Eq. 2-6) is calculated to evaluate the image fidelity and color breakup suppression. The pixel distortion ratio (PDR) value is the index of image fidelity, which is defined as the distortion pixel numbers divided by the total pixel numbers as shown in Eq. 4-1. The lower PDR value represents the higher image fidelity. The relative color breakup (CBU) is the index of color breakup suppression, which is defined as the color difference of the proposed method divided by the conventional RGB-driving method in each backlight divisions as shown in Eq. 4-2. The lower relative CBU value represents the less color breakup. % 100 3 ΔE00 ls total pixe number of ) ber( pixel num distortion PDR 4-1 1 2 3 4 5 6 7 8 9 10 11 12 13 14 15 16 17 18 19 20 21 22 23 24 25 26 27 28 29 30 31 32 33 34 35 36 37 38 39 40 41 42 43 44 45 46 47 48 49 50 1 1 1 1 1 1 1 1 1 1 1 1 1 1 1 1 1 1 1 1 1 1 1 1 1 1 2 2 2 2 2 2 2 2 2 2 2 2 2 2 2 2 2 2 2 2 2 2 2 2 2 2 1 1 1 1 1 2 2 2 2 2 3 3 3 3 3 4 4 4 4 4 5 5 5 5 5 1 1 1 1 1 2 2 2 2 2 3 3 3 3 3 4 4 4 4 4 5 5 5 5 5 3 1 2 3 4 5 1 2 3 4 5 1 2 3 4 5 1 2 3 4 5 1 2 3 4 5 1 2 3 4 5 1 2 3 4 5 1 2 3 4 5 1 2 3 4 5 1 2 3 4 5 4 1 2 3 4 5 2 3 4 5 1 3 4 5 1 2 4 5 1 2 3 5 1 2 3 4 1 2 3 4 5 2 3 4 5 1 3 5 2 4 1 4 5 1 2 3 5 1 2 3 4 5 1 2 3 4 5 3 4 5 1 2 5 1 2 3 4 2 3 4 5 1 4 5 1 2 3 4 5 1 2 3 1 2 3 4 5 4 1 3 5 2 5 1 2 3 4 2 3 4 5 1 6 1 2 3 4 5 4 5 1 2 3 2 3 4 5 1 5 1 2 3 4 3 4 5 1 2 5 1 2 3 4 3 4 5 1 2 1 2 3 4 5 4 5 1 2 3 2 3 4 5 1 7 1 2 3 4 5 5 1 2 3 4 4 5 1 2 3 3 4 5 1 2 2 3 4 5 1 5 1 2 3 4 3 4 5 1 2 2 3 4 5 1 1 2 3 4 5 5 1 2 3 4 8 1 2 3 4 5 1 2 3 4 5 4 5 1 2 3 5 1 2 3 4 4 5 1 2 3 3 4 5 1 2 2 3 4 5 1 5 1 2 3 4 2 3 4 5 1 3 4 5 1 2 9 1 2 3 4 5 2 3 4 5 1 1 2 3 4 5 3 4 5 1 2 3 4 5 1 2 2 3 4 5 1 4 5 1 2 3 5 1 2 3 4 5 1 2 3 4 4 5 1 2 3 10 1 2 3 4 5 3 4 5 1 2 3 4 5 1 2 1 2 3 4 5 2 3 4 5 1 5 1 2 3 4 5 1 2 3 4 4 5 1 2 3 2 3 4 5 1 4 5 1 2 3 11 1 2 3 4 5 4 5 1 2 3 5 1 2 3 4 4 5 1 2 3 1 2 3 4 5 2 3 4 5 1 5 1 2 3 4 2 3 4 5 1 1 4 5 1 2 3 4 5 1 2 12 1 2 3 4 5 5 1 2 3 4 2 3 4 5 1 2 3 4 5 1 5 1 2 3 4 3 4 5 1 2 4 5 1 2 3 4 5 1 2 3 3 4 5 1 2 1 2 3 4 5 Expt. No. L50 (2 1x5 11)

![Fig. 1-7 The color gamut comparison between CCFL and RGB LED light source [9].](https://thumb-ap.123doks.com/thumbv2/9libinfo/8205928.169749/20.892.314.653.358.740/fig-color-gamut-comparison-ccfl-rgb-light-source.webp)