國立交通大學
運輸與物流管理學系
碩 士 論 文
大眾運輸補貼計畫之評估:以巴拿馬為例
Evaluation of Transit Subsidy Plans Using
Analytic Hierarchy Process: A Case of
Panama
指導教授: 邱裕鈞 博士
研 究 生: 施霓諾 0153632
大眾運輸補貼計畫之評估:以巴拿馬為例
Evaluation of Transit Subsidy Plans Using
Analytic Hierarchy Process: A Case of
Panama
研 究 生: 施霓諾 Student: Ninoshka Salado
指導教授: 邱裕鈞 博士 Advisor: Dr. Yu-Chiun Chiou
國立交通大學
運輸與物流管理學系
碩 士 論 文
A Thesis
Submitted to Department of Transportation and Logistics
Management
College of Management
National Chiao Tung University
in partial Fulfillment of the Requirements
for the Degree of
Master
In
Transportation and Logistics
June 2014
Taipei, Taiwan, Republic of China
i
大眾運輸補貼計畫之評估:以巴拿馬為例
研 究 生: 施霓諾 指導教授:邱裕鈞 博士
國立交通大學
運輸與物流管理學系碩士班
摘要
公共運輸補貼經費通常佔政府支出預算中相當龐大的比例,尤其許多經費係來 自政府稅收,其是否有效運用,更令人關切。因此,如何有效運用補貼經費,以達到 最大效益,實為一重要課題。基此,本研究旨在研提用以評選補貼分配方案的評估架 構,並以全國人口集中的巴拿馬都會區為例,進行分析。該都會區正在規劃建置一條 捷運線,若沒有適當的公車及捷運補貼,恐怕無法降低捷運及公車票價,進而吸引民 眾使用,導致捷運投資之浪費。基此,主管當局也正思考在研擬一個補貼計畫,以促 進大眾運輸系統之整合與發展。 本研究利用層級分析法(AHP)進行補貼計畫之評選。本評估架構包括補貼成本 效益、補貼公平性、服務效果、服務品質、環境永續性、政府財務永續性、業者財務 永續性等七大標的,並包括一至二個的準則。至於權重之決定係透過訪談巴拿馬運輸 及經濟相關專家學者,並經計算而得。結果顯示。政府財務永續性權重最高。至於補 貼計畫則以方案三為最佳,其次為方案二,而方案一最差。而方案三是提供營運補貼, 並提供學生單一費率的優待票,並提供捷運與公車間之轉乘優惠。 關鍵詞:大眾運輸補貼、層級分析法、補貼計畫。ii
Evaluation of Transit Subsidy Plans Using Analytic
Hierarchy Process: A Case of Panama
Student: Ninoshka Salado Advisor: Dr. Yu-Chiun Chiou
Department of Transportation and Logistics Management
National Chiao Tung University
Abstract
Transit subsidy is a common policy, used by many governments to support any increase of transport cost and therefore provide some direct benefit to users. In transportation, subsidies, are granted for many reasons and take an important part of government expenditure. This study is conducted to evaluate three different subsidy plans, to implement in the metropolitan area of Panama; where all the economic activity of this country is concentrated. The subsidy plans proposed by the authorities are aimed to provide financial assistance to the operators, develop new technologies and integrate the new systems (Metro and public bus); to benefit both the operators and users of public transportation systems.
The subsidy schemes proposed for Panama were evaluated using the Analytic Hierarchy Process (AHP). This method consists of a hierarchical representation, in which the decision problem is decomposed into different levels according to their common characteristics. Each level is evaluated by experts in transportation and economy of Panama. The experts were required to conduct a pair-wise comparison of the elements and provide the weights to determine the ranking of each alternative. The scheme 1, composed by a fuel tax rebate, a flat fare scheme, an operating subsidy for metro operations and a fare subsidy; was placed as the worst option. The second best option was, scheme 2, formed by a concessionary fare subsidy, capital subsidy for both systems (to invest in fleet and new technologies) and operating subsidy for metro operations. The best alternative according to the opinion of the experts was scheme
iii
3, which offered a conditional operating subsidy, a flat fare subsidy, an operating subsidy for metro operations and a discount for transfers in both systems.
iv
Acknowledgment
Foremost, I would like to extend my sincere gratitude to my advisor Dr. Yu-Chiun Chiou, for his guidance and support during the development of this study. His advices guided me during all the study and allowed me to write and finish my thesis.
I would also like to thanks my professors and classmates, from National Chiao Tung University, for their support and remarks along this journey.
To my friends and family, who from the other side of the world helped me to accomplish my dreams and supported me during this moment, many thanks. I would also like to thanks a special person, Abdiel Salazar, for his support during the two years we have been apart, your love gave me strength.
iv
Table of contents
Chinese Abstract ... i English Abstract ... ii Acknowledgment ... iv List of tables ... viList of figures ... vii
1. Introduction ... 1
1.1 Background and Motivations ... 1
1.2 Research Purpose ... 2 1.3 Research Scope ... 3 1.3.1 Transportation System ... 3 1.3.2 Geography Scope ... 3 1.3.3 Time Scope ... 4 1.3.4 Research Object ... 4 1.4 Research Development ... 4 2. Literature Review ... 6
2.1 Justification Arguments for Transit Subsidies ... 6
2.1.1 Allocative Efficiency ... 7
2.1.2 Social Distribution ... 8
2.1.3 Negative Transport Externalities ... 8
2.2 Classification of Transit Subsidies ... 9
2.2.1 Demand Side and Supply Side Subsidy ... 9
2.2.2 Subsidy Distribution ... 10
2.2.3 Subsidy Funding ... 10
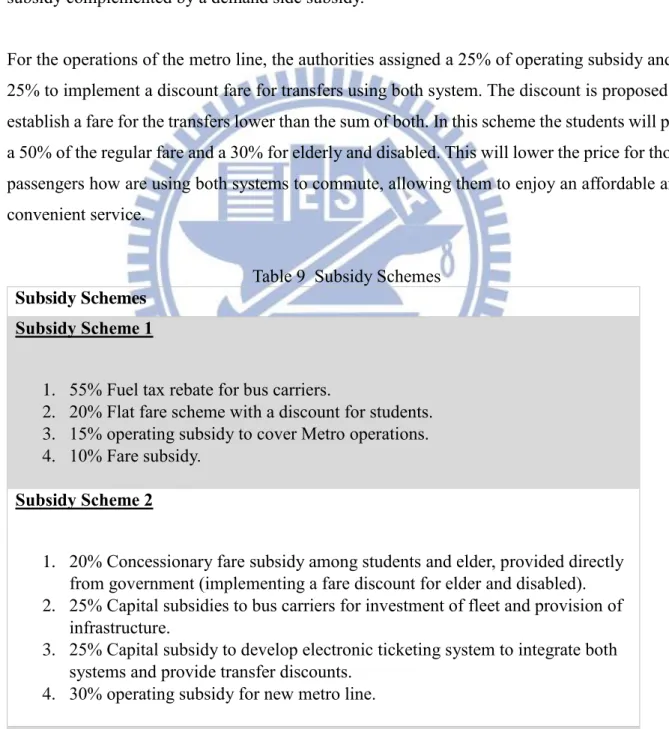
2.3 Subsidy Schemes ... 13
v
3. Research Method ... 20
3.1 Multi-Criteria Decision Methods: AHP ... 20
3.2 Scenario description: Transit Subsidies in Panama ... 22
3.2.1 Users Patterns ... 24
3.3 Determination of the Objectives, Criteria and Alternatives: The Analytic Hierarchy Structure ... 25
3.3.1 Objectives-Criteria Selection ... 26
3.3.2 Generating Feasible Subsidy Plans for Panama ... 30
3.4 Data Collection: Determining weights using pair-wise comparison ... 33
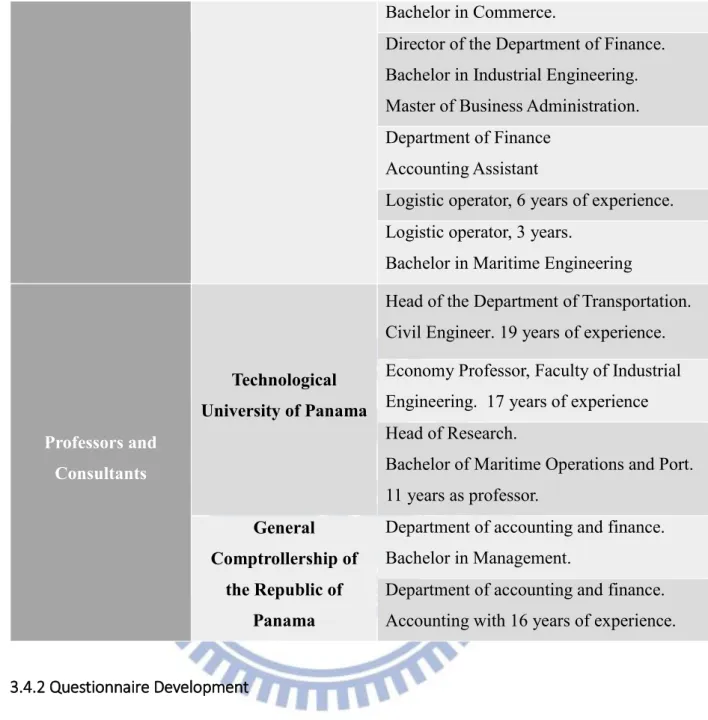
3.4.1 Experts Selection ... 33
3.4.2 Questionnaire Development ... 35
4. Results and Discussion ... 38
4.1 Government Judgments ... 38
4.2 Professors and Consultants Judgments ... 43
4.3 Operator Judgments ... 47
4.4 Combined Results ... 52
5. Conclusion and Suggestions ... 57
5.1 Managerial Implications ... 59
5.2 Limitations and Recommendations for Future Research ... 60
Bibliography ... 62
vi
List of tables
Table 1 Justification of Transit Subsidies ... 8
Table 2 Classification of Transit Subsidies ... 12
Table 3 Subsidy Schemes: Cases ... 15
Table 4 Evaluation Criteria ... 19
Table 5 Nine-Point Evaluation Scale ... 21
Table 6 Transit Subsidies in Panama 2009-2013 (Million USD) ... 23
Table 7 Distribution of Mobility by Income Groups ... 25
Table 8 Criteria and Sub-criteria ... 29
Table 9 Subsidy Schemes ... 32
Table 10 Discussion Group Information ... 34
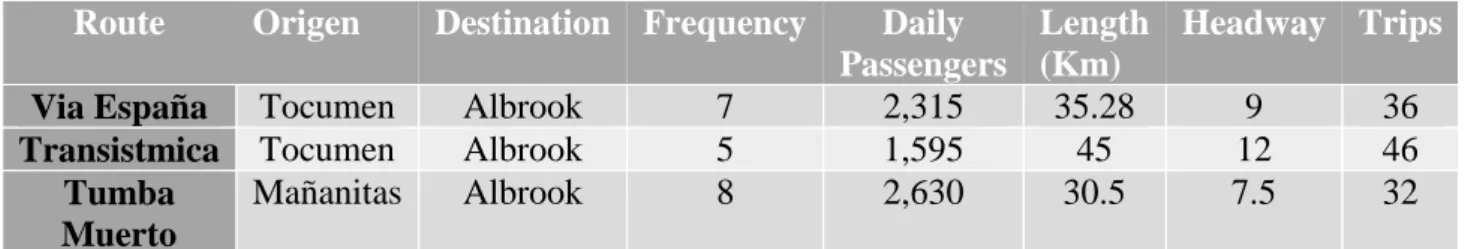
Table 11 Characteristics of the routes ... 35
Table 12 Questionnaire Data ... 36
Table 13. Comparison of results, Criteria ... 53
vii
List of figures
Figure 1 Panama Metropolitan Area ... 3
Figure 2 Research Development... 5
Figure 3 Subsidy Distribution ... 22
Figure 4 Analytic Hierarchy Structure: Sustainable Subsidy Schemes for Panama ... 26
Figure 5 Goal-Objective Assessment: Government ... 39
Figure 6 Objectives-Criteria Assessment: Government ... 40
Figure 7 Criteria-Schemes Assessment: Government ... 41
Figure 8 Alternative Preference: Government ... 42
Figure 9 Government Judgments ... 43
Figure 10 Goal-Objective Assessment: Professors and Consultants ... 44
Figure 11 Objective-Criteria Assessment: Professors and Consultants ... 45
Figure 12 Criteria-Schemes Assessment: Professors and Consultants ... 46
Figure 13 Alternative Preference: Professors and Consultants ... 46
Figure 14 Professors and Consultants Judgments ... 47
Figure 15 Goal-Objective Assessment: Operator ... 48
Figure 16 Objective-Criteria Assessment: Operator ... 49
Figure 17 Criteria-Scheme Assessment: Operator ... 50
Figure 18 Alternative Preference: Operator ... 51
Figure 19 Operator Judgments ... 51
Figure 20 Goal-Objectives Assessment: Combined results ... 52
Figure 21 Objective-Criteria: Combined results ... 53
Figure 22 Schemes-Criteria: Combined results ... 55
Figure 23 Alternative Preference: Combined results ... 55
1
1. Introduction
1.1 Background and Motivations
A subsidy can be defined as a result of government action that confers and advantage on consumers or producers in order to supplement their income or lower their cost (Tscharaktschiew and Hirte, 2012). Subsidies in transportation are granted for many reasons and take an important part of government expenditure, due to the fact that in some cases are financed by state tax. Distribution, social equity, allocation of resources and transport externalities are some of the reasons that justify this economic help; but these are also some of the problems subsidy faces. The implementation of transit subsidies required proper evaluation for the efficient and effective performance of this policy. In many countries this policy is implemented to integrate the different transportation advances and improve their operations, others to provide low cost service for low-income households. Regardless of the purpose, it is important that suitable subsidy schemes that benefit both the operators and users of public transportation are proposed.
Transit subsidies in Panama were given for the first time in 1968, its main purpose was to eliminate the existent monopoly that the transportation industry faced at that moment. In this case the authorities were trying to focus on the welfare of low-income citizens, by lowering operating cost, fuel cost and the implementation of renewed vehicle fleet. The strategy was successfully implemented, unfortunately it failed into accomplish the proposed objectives. Misuse of state assets and mismanagement lead to the future collapse of the urban public transportation system of Panama. In 1993, the government approve more incentives for the bus operators, tax exemption in bus and parts cost. However, the service provided do not justify the benefits granted. To understand the real factor that determined the policy failure, first we must see inside the system, which was operated by independent operators who saw transportation as a business and were not concerned about the quality of service provided. Safety, service quality and proper regulation were some of the problems of public transport service. In 2011, a new system was introduced to solve the problems of the public transit service quality. The Metrobus was the key to upgraded and provide a more convenient service.
2
The implementation of this new transport system, caused the revision of the current subsidy established by the authorities. One of the main objectives of this system was to continue providing a low cost service. However the cost of this new and modern system was higher than the previous service. To regulate this situation, authorities proposed the implementation of a subsidy based on passenger per trips and an operating subsidy to cover fuel taxes. With only three years of its implementation (2011), the plan has received many complaints from the operators; who are presenting financial difficulties and are operating at lost. The principal objective, which was the improvement of service quality has not been achieved; instead, to reduce operating cost, bus operators have resorted to overcrowding, low frequency and decrease of passenger comfort, providing poor service. This prove that the current subsidy plans, are not achieving the objectives. With the need to provide new subsidies for the metro line, authorities are concerned about the efficiency and effectiveness of this policies. Future schemes proposed, must contemplate social distribution, integration among the systems and the proper allocation of the state budget, in order to obtain the best results of the subsidy schemes.
1.2 Research Purpose
This study is conducted to evaluate feasible subsidy plans for the metropolitan area of Panama. With over 532 thousand employees, this area is where all the economic activity of Panama is concentrated. In the last four years the metropolitan area has presented many changes in its transport infrastructure and systems. The implementation of a new urban public transport systems to work along with the new metro line are some of the projects developed by the authorities. To obtain a full integration of the systems and reduction of some of the most common transportation problems that this city faces, this study proposed the development of different subsidy plans that will not only contemplate the benefit to the operators, but also the users welfare. The evaluation conducted will propose the best alternative to distribute the government budget and to give some guidance for the policy makers to determine if the subsidy plans are effectively and efficiently used or there are other alternative that could be implemented.
The research propose and contribution are given as follows: 1. Evaluate the subsidy plans implemented in Panama.
2. Propose, feasible subsidy plans that promote the integration of fare between modes and the distribution between the elderly, handicaps and review the former distribution.
3
3. Provide, information about the different benefits of each plan proposed and the repercussion of their implementation.
4. Provide, suggestions of the implementation of transit subsidies for futures plans.
1.3 Research Scope
1.3.1 Transportation System
Transit subsidies can be granted to different types of transportation modes. The subsidy plans proposed in this study will be directed only to urban public transport (MRT and bus), since these are two main transport systems in Panama.
1.3.2 Geography Scope
The study is conducted in the metropolitan area of Panama, important center of the economic activity of the region. This area is located in the providence on Panama and is distributed in four districts: Panama City; capital and largest city of the country, San Miguelito, La Chorrera and Arraijan (see figure 1). The total population is 1.5 million of inhabitants, which represents 48% of the total population of the country, distributed in an area of 2,561 km2. 2 million of trips occur every day as a result of the 532 thousand employees distributed in the area. The principal transport modes used are public bus 50.3%, private car 16.9%, walking 19.9%, and taxi 12.9%.
Figure 1 Panama Metropolitan Area Source: Panama National Survey Department
4 1.3.3 Time Scope
The data used to evaluate the different subsidy plans for Panama was collected in a five years period from 2008 to 2013. The information was provided by the Ministry of Economy, National Institute of Statistics and Census and Finance and the Transit and Transportation Authority of Panama.
1.3.4 Research Object
In transportation there are different types of subsidies based on the objectives. This study deals with: demand side and supply side subsidies for operators and users. Subsidies provided to manage congestion or other type of transport externalities are excluded from the study. It is important to mention that the study do not contemplate any other strategy that can be uses along with the subsidies, such as deregulation or fare structure change.
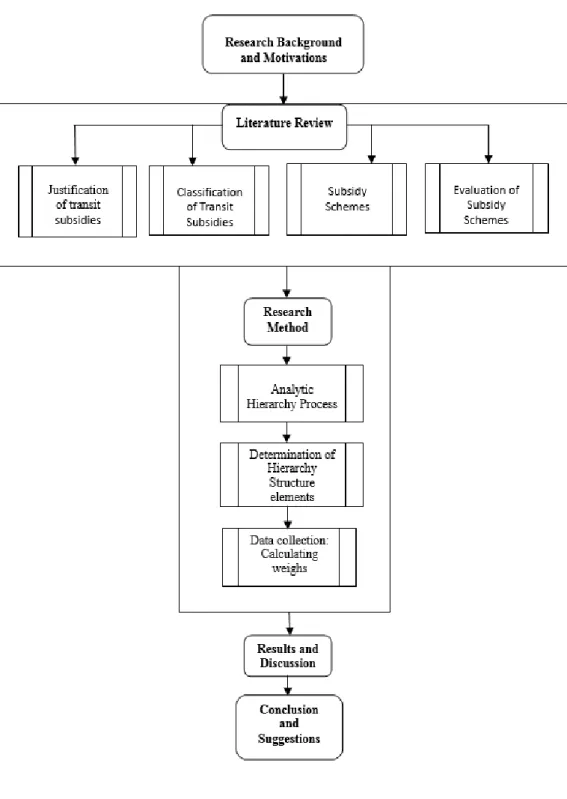
1.4 Research Development
The research is divided into five chapters. Chapter 1, contains a description of the motivations of our study and a brief introduction of the scenario of Panama. Chapter 2, provides a review of relevant literature, about the type of subsidies and cases study of their implementation. Chapter 3, presents a definition of the Analytic Hierarchy Process; the method used to evaluate the different subsidy plans. This Chapter provides a description of the elements of the AHP such as; objectives, criteria and alternatives. The discussion of the results is presented in Chapter 4. The last part of the study is Chapter 5, which contains the conclusions and suggestion of the study. Figure 2 represents the research development.
5
6
2. Literature Review
2.1 Justification Arguments for Transit Subsidies
In transit economics, there are many objectives that can be achieved by using different transport policies. One of the most used instruments are transit subsidies, implemented in many countries to support transport cost, infrastructure and maximizing social welfare. Literature related to this subject offers a wide variety of definitions for this activity. In a report elaborated by the European Environment Agency (2007) two approaches were identified based on welfare economy and fiscal policy. The first, defines transit subsidies as all transport cost that are not covered by users, including all kinds of externalities, infrastructure cost or different regulations. The second approach, defines “subsidies” as only those economic advantages that are granted from public budgets that do not provide a direct service in return, e.g. grants and tax deductions (Best, 2007). In resent publications of the OECD (2005) a subsidy was described as a result of government action that confers an advantage on consumers or producers in order to supplement their income or lower their costs (Tscharaktschiew and Hirte, 2012). In Nijkamp (2002) subsidies are defined as a payment that does not required a direct exchange of goods or services of equal market value in return; it is used to accomplish a specific social objective or has a specific effect. All the definitions compiled converge in the same idea; transit subsidies are provided as an incentive to transportation users and operators with the use of different economic strategies (fare structure, concessionary fare, operating subsidies; etc.) in order to accomplish several objectives (economic, social and environmental).
It is important to recognize the reason why a subsidy is granted in the first place. This will allow the authorities to identify the benefits and possible effects of their implementation. Studies conducted on subsidies have revealed that there are many different reasons that justify transit subsidies. A major reason is to provide a form of in-kind income redistribution to persons of lesser means who ride buses. Subsides are also used to manage road congestion on unpriced roads. Bus subsidy has also been espoused for energy conservation reasons, and can be supported on the basis that public transport has an option value (Tisato, 1998). There are several different rationale for subsidizing transit generally classified as allocative efficiency, social distribution and negative transport externalities. In circumstances where policy makers believe that several of this objectives may be achieved through increasing public transport modal share,
7
the subsidy may be targeted at developing demand by identifying marginal segments of use (Gwilliam, 2008). In the following part of this study we will define the different rationale for subsidizing.
2.1.1 Allocative Efficiency
There are three different approaches for the argument of allocative efficiency of transport subsidies. The first approach is based on welfare maximization and utility pricing. The starting point thus tended to be a presumption that welfare would be maximized with prices set equal to marginal cost (economic rule in price setting for an efficient allocation of resources). Hence, if average costs are falling the presumption would be that optimal prices would not cover total cost and subsidy would be necessary in order to maximize welfare (Gwilliam, 2008). The study conducted in Nijkamp (2002) provided a clear demonstration of this situation, in the case that price is set equal to the marginal cost, public operators will incur in loss, because marginal cost is less than average cost. Price discrimination is possible, but may not be practical. It is clear that funds must be raised from somewhere to keep these operators in business.
The second efficiency argument is based on the existence of user economies of scale, the “Mohring effect”; first describe by Herbert Mohring in 1972. Its describes that when the cost of waiting time is included as an input to the production of trips, public transport services are subject to economies of scale. This means that as public frequencies increase, waiting time decrease, demand increases, and frequency increases again. In other words the Mohring effect explains that the access cost or waiting time incurred by passengers decreases when public transport provision is increased (Behrendt et al., 2010).
The last approach is the argument relating to the theory of the second-best, based on the increase in private car use and patronage. In the study conducted by Gwilliam (2008) is explained that as private automobile ownership and use grew in the sixties and seventies, transit systems, which had traditionally been commercially viable began to suffer patronage loss and consequent decline of service. This led to consideration of the efficiency implications of this trend, and based on the theory of the second best, generated the argument for subsidy to compensate for miss-pricing of a complementary or competing good. The reason described in Gómez‐Lobo et al. (2009) is that the users of these alternative mode (private car) do not pay the full cost they
8
impose on society, in terms of infrastructure use, pollution, congestion, road safety risk and other environmental externalities. They are thus being subsidized. Therefore, by subsidizing public transport, competition between these alternative modes is placed on a level playing field and improves resource allocation.
2.1.2 Social Distribution
The second argument we are going to discuss is related to the social purpose of subsidies, based on the redistribution of income to certain less privileged groups. Transit subsidy transfers real income in the form of transit service rather than cash. Some groups in society, which are largely dependent on this service, will benefit from this subsidy (Nijkamp, 2002). This is the case of some parts of Europe, such as the Netherlands, and Brussels who has implemented free transport for students (Cees van Goeverden, 2006).
2.1.3 Negative Transport Externalities
In many countries transport use give rise to significant problems, which are expected to grow even worse in the future if no counteracting measures are taken (Mayeres, 2000). These problems often defined as negative transport externalities; such as congestion, accidents as well as local and global air pollution, can be alleviated by urban public transport use. Subsidizing public transport may thus be a second-best policy tool for addressing these problems (Behrendt et al., 2010).
Table 1 contains the main description of the justifications of transit subsidies and the studies related to that matter for a better understanding of the literature.
Table 1 Justification of Transit Subsidies
Justifications Description Studies
Allocative Efficiency
Welfare maximization and utility pricing.
Existence of user economies of scale, the “Mohring effect”.
The theory of the second-best, based on the increase in private car use and patronage.
(Nijkamp, 2002), (Gwilliam, 2008), (Behrendt et al., 2010)
9
Social Distribution
Social purpose of the subsidies, based on redistribution of income among groups, such as those on low incomes, the elderly, or disable.
(Cees van
Goeverden, 2006).
Negative Transport Externalities
Transport use give rise to significant problems, which are expected to grow even worse in the future if no counteracting measures are taken.
(Behrendt et al., 2010), (Mayeres, 2000).
2.2 Classification of Transit Subsidies
Type and classification of subsidies differ from many studies. In Best (2007) subsidies are classified by “incidence” and by “mode”. The term “incidence” refers to who or what initially receives the subsidy. Meanwhile, Pounds (1980) stated that subsidies are generally classified according to whether they are provided to assist in general operation of a transport undertaking (operating subsidy), or to pay for replacement or extension of the infrastructure involved (capital subsidy). Both of this studies are based on the recipient. Moreover, Gómez‐Lobo et al. (2009) provides a more extended classification of subsidies. The research explains that subsidies can be classified along many dimensions according to who receives the financial transfers, the targeting mechanism used to distribute benefits and how they are funded. This information allow us to conclude that transport subsidies can be classified according to the following questions: Who is the beneficiary of the financial aid? Who bears the cost of financing the transport subsidies? What is the strategy used to target and distribute the subsidies? And what are the different funding sources? The following part of our study will provide the answer of these questions, using two main subsidy categories: Supply and demand side subsidy, both categories based on the principal recipient.
2.2.1 Demand Side and Supply Side Subsidy
Based on the main recipient or beneficiary of the grant we can identify two categories of subsidy, as it was mention before (Gómez‐Lobo et al., 2009). The first category identified as demand side subsidies, are those provided directly to public transport users. These grant are targeted to benefit the users by group, providing direct financial support.
10
Supply side subsidies, are those financial aids channeled to transport suppliers (operators). This category is divided into capital and operating subsidies. Capital subsidies are those delivered to support cost of infrastructure or equipment purchase, meanwhile operating subsidies are directed to cover expenses related to the operation (revenue losses and reduce fare). These types of subsidies are based on the direct and indirect beneficiaries of these grants, it is important for the policy maker to identify to whom target the subsidy. In both cases, the objective is to lower the cost of service to final users either by lowering the proportion of cost that must be funded from fares (supply side subsidies) or by lowering the monetary outlays of users (demand side subsidies) (Gómez‐Lobo et al., 2009).
2.2.2 Subsidy Distribution
Subsidies can also be classified according to the method used to target beneficiaries. The description of some of this method can be encounter in Gómez‐Lobo et al. (2009). For example, demand side subsidies can be mean tested, if some type of welfare instrument is used to gauge the socioeconomic condition of potential beneficiaries. Or they can be given to certain categorical groups, such as students or the elderly. Another method may be to use certain self-selection mechanisms. Along the same lines, geographical targeting could also be used, targeting benefits and services to areas where the less well-off households are overrepresented.
Supply side subsidy are usually given to operators who usually do not discriminate between different types of users, therefore are less target than demand side subsidies. A solution to this problem could be the implementation of conditioned operating subsidies based on the performance or specific services. Distribution of subsidies among the population or modes are commonly used by policy makers to obtain the most beneficial subsidy scheme.
2.2.3 Subsidy Funding
The last classification is based on the methods used to finance subsidies. In most countries, support for public transport has traditionally been financed from general taxation. The federal or local authorities collect the revenues from various taxes, individual and corporative taxes being the biggest sources. One of this funding methods described by both studies is
cross-11
subsidy. This type of subsidy occurs when revenues in excess of cost for one group are used to finance deficits incurred for other groups (Nijkamp, 2002).
Table 2 provide examples of supply side and demand side subsidies based on the previous classification. The Following part will provide a description of each subsidy.
• Subsidies to cover operating cost
Public transport operators receive a direct transfer from the government to maintain low fares. Funded by general taxes, this type of supply side subsidy can be conditional or unconditional. In a conditional subsidy the levels of subsidy will depend on the patronage and performance of the transportation system. The performance measures most commonly used in the allocation process of these subsidies are: ridership, efficiency (cost per some service unit), local support and service expansion (Marshment, 1998). This is taken as a measure to motivate operators to maintain or improve their service quality. On the contrary, an unconditional subsidy is given to operators, with scant performance conditions in which deficit is covered by governmental aid.
• Capital Subsidies
Capital subsidy can by direct or indirect. This supply side subsidy can be provided has an assistance with land acquisition for operators, vehicle replacement and fleet expansion. A report conducted by Marshment (1998) implies that capital subsidies have the purpose of increase capacity.
• Fuel tax rebate
Operators receive a rebate on tax paid for fuel from the government. The measure is taken as a form of operating subsidy to reduce the price of fuel, since it represents a significant portion of the total operating cost. This subsidy is not conditioned on specific performance targets (Gómez‐Lobo et al., 2009).
• Concessionary fares
Directed to certain groups of people such as children, pensioners, disables, and occasionally even unemployed people, are usually entitled to discount, in some cases zero, fares on most forms of public transport. Provided to enhance social distribution, reduce exclusion and improve accessibility of transportation systems to low income users.
12
Offering concessionary fares to certain groups of passengers is likely to result in additional trips being made. “The trip generation factor” used to measure the ratio of the number of trips made at concessionary fares with the number of trips which would be made by the dame people if they were charged full adult fares, explains that generation factors for bus travels vary between 1.2 to 1.9 for flat fare and 1.2 to 1.5 for half fare schemes (TRL, 2004). However, in some cases the implementation of these schemes may lead to a large increase in public expenditure. The impact on the operator vary according to the change of behavior of the users using the new discount (Baker and White, 2010).
• Infrastructure Grant
Subsidy commonly used in systems implementation and expansion of transportation projects. Is provided directly from government budget without users having to pay for this investment through fares. This subsidy is applied for rail or metro projects and road infrastructure.
Table 2 Classification of Transit Subsidies
Transit subsidy Definition Study
Subsidies to cover operating
cost
Supply side subsidy, founded by general taxes. This type of subsidy can be provided with a condition such as: ridership, efficiency, subsidy per revenue mile, cost per revenue mile and subsidy per passenger.
(Gómez‐Lobo et al., 2009), (Marshment, 1998), (Pounds, 1980).
Capital Subsidies
This supply side subsidy can be provided has an assistance for land acquisition for operators, vehicle replacement and fleet expansion.
(Gómez‐Lobo et al., 2009), (Bergstrom, 2000).
Fuel tax rebate
Operating subsidy to reduce the price of fuel. This subsidy is not conditioned on specific performance targets.
(Gómez‐Lobo et al,. 2009)
Concessionary fare
Demand side subsidy directed to a specific groups for a social purpose. It can affect: trip generation, equity, affordability, and an increase in public expenditure and revenue forgone for operators.
(Cees van Goeverden, 2006), (TRL, 2004), (Jackson, 1975), Baker and White, 2010).
13
Infrastructure subsidies
Used in systems implementation and expansion of transportation projects. Provided directly from government budget without users having to pay for this investment through fares. Involves large expenditure on state budget.
(Muñoz and de Grange, 2010), (Tisato, 1998).
2.3 Subsidy Schemes
Subsidy schemes are the different programs undertaken by the authorities for the effective allocation of subsidies, in both demand and supply side. These programs are widely used in many developed and developing countries and vary depending on the objective of each scenario. Subsidy schemes can be given as a direct transfer to users, such is the case of some parts of United States where transit agencies offers travel passes at a discount to employers to encourage staff to commute by different modes other than the car (Potter, 2003). Other programs are directed to cover public transport operating cost. In Taiwan bus carriers from deficit routes receive a direct subsidy and tax exemption from fuel and license plate, to help them resist their financial difficulties and reduce operating cost; all part of a program called the five-year enhancement of mass transportation program (Lan, 2005). However, schemes differ not only in their recipients, but also in the way they are financed as it was explained before. An example of this is the flat fare or zonal fare structure presented in most American transit systems, where a type of cross-subsidization is presented in which, passengers pay the same fare regardless of distance. An study conducted by Pucher (1981) of different bus systems in San Diego, Oakland and Los Angeles found that longer trips were less profitable and only covered a percentage of operating cost through fares; causing an intervention from the government to cover the deficit.
With the use of these programs, authorities proposed to provide a high quality service to attract more private vehicle users and address environmental and traffic congestion problems (Wang et al., 2006). In most of the cases these programs are implemented because of the social benefit of providing affordable transport service to lees privileged groups; concessionary fares schemes generate an increase in quality of life and reduction in social exclusion amongst the poorer pass-holders (Rye and Mykura, 2009). This type of subsidy scheme is commonly used in many European cities and countries, where a discount of 46% or 100% (free travel) in fare is given to older passengers and children. The concessions are introduced as a social policy requirement
14
by the government to private operators; carriers receive a reimbursement for revenue lost and the additional cost incurred for the increase in ridership (Rye and Mykura, 2009).
The literature reviewed of several studies provided information about the implementation of the subsidy schemes in different countries. The findings and characteristics of this studies are listed below in Table 3. Schemes such as; operating subsidies, flat rate, concessionary travel, conditional operating subsidies and fuel tax rebate, were implemented in different countries. Some of them had successful results and others such as the scheme implemented in Argentina, which failed in accomplish the objectives imposed, been more effective the implementation of a different plan.
15
Table 3 Subsidy Schemes: Cases
Study Scheme Findings Positive/Negative Impacts
(Lan, 2005), (N. Estupinan, 2009).
Operating Subsidies
Taiwan:
• The Five-year Enhancement of Mass Transportation Program, offers a tax/fee exemption. The direct subsidy, has improved the operators’ financial crises and has provided the essential money to keep the deficit routes in service.
• The periodical operational appraisal has ensured the transport service quality.
• Improve quality of service. • Some of this subsidies are not
conditioned on performance standards.
• Raise cost.
(Cervero, 1981), (Nassi and Costa,
2012), (Hidalgo, 2003).
Flat Fare
Bogota:
• The flat fare scheme of the TransMilenio is used to cover capital investment, operation and maintenance of bus fleet and ticketing system.
• No direct subsidy from the government.
• The cost of the fare is higher than the average cost of traditionally public transport.
• Improve equity, ridership and affordability.
• Without direct intervention from the government could increase the cost of fare.
(Metz, 2003), (Rye and Mykura,
2009)
Concessionary travel
London:
• A concessionary travel scheme offers, free off-peak travel for elderly and disable residents on buses, the Underground, light Railway and London rail services.
• Enhance mobility.
• Increase public transport use. • Cost difficult to limit.
16
• Reimbursement based on compensation for revenue lost as a results of their participation in the scheme.
(Puentes, 2004)
Operating subsidy
The United States:
• System is funded by local operating subsidy, however, revenues are not enough to support operating cost.
• The system is presenting financial problems due to a misallocation of resources and political jurisdiction. This situation could lead to a rise in fare.
• Appropriate regulation must be implemented. • Resource allocation. (Gómez‐Lobo et al., 2009) Conditional operating subsidy Argentina:
• Based on the number of passengers transported, the gross revenues of the firm and kilometers supplied.
• The levels of subsidy depend on the number of passengers transported and the kilometers supplied, providing some incentive for performance improvements.
• Improve level of service. • Provide some incentive.
(N. Estupinan, 2009)
Fuel tax rebate
UK:
• Bus operators receive a rebate on tax paid for fuel by public transport vehicles.
• Refunds about 80% of taxes paid on fuel.
• Not conditioned on specific performance targets. • Suggested to fuel cost
variation.
17
2.3.1 Evaluation and Implementation of Subsidy Schemes
Public transport is strongly dependent of subsidy to cover for the differences between passengers fare revenues and operating cost (Tscharaktschiew and Hirte, 2012). Subsidies are used due to its multiple benefits, been some of them reduce fares and increase frequency. Lower fares make public transport affordable and usable for low-income users, as well as passenger segments with special needs (handicapped and older people) (Tscheulin et al., 2014). The implementation of subsidies help increase public transport patronage (Cervero, 1984), in response to the mode shift, it also works as a second-best policy to reduce negative transport externalities, such as CO2 emission and energy consumption. However, in some cases it
experience a negative impact in the systems performance and productivity (Bruno De Borher, 2006). In fact several studies conclude that system operating costs increase as the percentage of total system revenues provided from subsidies increases (Karlaftis, 1998). Therefore to achieve the objectives of its implementation is important to consider these impacts when designing the different plans.
One of the first element to consider when designing a policy, are the objectives or goals of the policy (Tuominen and Himanen, 2007). The goals and objectives will determine, what the policy is trying to achieve. The implementation could fail if the objectives are not properly stablished. Therefore, is important to identify the main objectives of each stakeholder involved. For example in the case of the authorities: increasing ridership, set low prices, encouraging social inclusion and minimizing public subsidies or financial compensation. Operators, on the other hand will try to prefer a policy that would allow them to cover operating cost and maximize profit and building an attractive transport system. For the passenger is all about the cost and the comfort that they can get from the service EMA (2008). Transit subsidy schemes often contemplates elements related to these objectives: social, economic, financial and environmental impacts. These elements most be included in the design of the different schemes. In transportation this objectives are contemplated in the goal sustainability; defined by The World Commission on Environment and Development as the manner in which physical, social, economic and environmental needs of a community are met without compromising the ability of future generations to meer their own needs (Yeh et al., 2009).
Subsidies and sustainability holds more relation in an economic point of view. Many public transport systems around the world suffer from low productivity, high costs, and therefore a
18
large amount of government subsidies is needed. Public transport offers many social and environmental benefits but, it is crucial to increase productivity and reduce costs, to improve financial sustainability. Improving the financial sustainability of public transport would help realize the potential environmental and social benefits of public transport, since it would make expanded public transport service more affordable, both for the governments who provide it and for the passengers who use it (Buehler and Pucher, 2011). Therefore, elements such as environment impacts, social distribution and economic development must be in balance when subsidies schemes are designed. Each element is directly or indirectly affected by the other. The benefits and impacts of these elements can be measured using indicator. In the study conducted by Gómez‐Lobo et al. (2009), different kind of criteria is selected to evaluate the affordabilty of the subsidies to obtain the best results. It is determine that criteria such as: distributive impac, productive efficiency of operators, funsing mechanism, administrative cost and transparency of the policy; should be include in the process of evaluation and desing. These elemenst consider the cost of the policy, the effect on the operators, how are they financed, if they achieve their social purpose and the transparency in the use of state funds. In the case of the operating subsidies, (Karlaftis, 1998) used three types of indicators to analize the effect of operating subsidies on transit performance. These subsidies where divided in three cathegories: effectivenes, efficiency and overall performance. The effectivenes measures how well the system meets the objectives. As Clements (1999) mention, subsidies have to be effective and achieve their objectives at minimum cost in term of their fiscal burden and efficiency losses. Efficiency, on the other hand measures the productive ability of a transit system by either the amount of output produced per unit input or the level of input necessary to produce a given amount of output. Overall performance employs financial measures to reflect the performance of transit systems. These indicators are included to evaluate effect of subsidies on elements such as; ridership, cost, subsidy level and financial performance of recipient systems (McCarthy, 1997).
Sustainability indicators are divided into, environmental indicators, economic indicators and equity (Woldeamanuel, 2012). Environmental Sustainability is one of the most important elemenst in sustainable development, measures how transit services produce any reduction of environmental impacts. The environmental indicators measure the benefits of a mode of travel in terms of its contribution to environmental protection (Woldeamanuel, 2012). Economic sustainability is concerned about the affordability, the financial equity and the resilient to economic fluctuations of transportation (O'Hara et al., 2011). This indicators measure the
19
economic impact of users when a policy is implemented. Social sustainability concerns with the basic needs and a good quality of life for all members of the community (Woldeamanuel, 2012). Social sustainability include elements such as social integration and equity, health and safety and the ability of meet the basic needs of people (O'Hara et al., 2011). Table 4 presents a brief description of the proposed indicators for transport sustainability.
Table 4 Evaluation Criteria
Study Criteria Explanation
(Gómez‐Lobo et al., 2009)
Distributive impac, productive efficiency of operators, funsing
mechanism, administrative cost and transparency of the policy
These elemenst consider the cost of the policy, the effect on the operators, how are they financed, if they achieve their social purpose and the
transparency in the use of state funds
(Matt G Karlaftis, 1998), (McCarthy, 1997)
Effectivenes, efficiency and overall financial
performance
Effectivenes measures how well the system meets the objectives. Efficiency
measures the productive ability of a transit system. Overall performance employs financial measures to reflect the
performance of transit systems
(O'Hara et al., 2011), (Woldeamanuel, 2012)
(Wang et al., 2009)
Greenhouse gas emissions Pollution
Environmental indicators measures how transit services produce any reduction of environmental impacts. (O'Hara et al., 2011), (Woldeamanuel, 2012), (Pucher, 1981), (Robin Carruthers, 2005) Affordability Finance equity Transport cost Consumer expenditure
This indicators measure the economic impact of users when a policy is implemented.
(Litman, 2009) (Litman, 2013)
Social interaction Social equity Accessibility
Social sustainability include elements such as social integration and equity, health and safety and the ability of meet the basic needs of people.
20
3. Research Method
3.1 Multi-Criteria Decision Methods: AHP
The proposed methodology in this research is the Analytic Hierarchy Process (AHP) a multi-criteria technique used to assist in decision making problems. The AHP considers both qualitative and quantitative approaches to research and combines them into a single empirical inquiry (Li, 2001), allowing the decision makers include their experience, knowledge and intuition. This method has been used as a decision-making tool in various fields such as, economics, regional and urban planning, energy and environmental policy development and many others.
The AHP consist of a hierarchical representation of a system, in which the decision problem is decomposed into different levels according to their common characteristics. The upper level of the hierarchy structure represents the focus of the problem “The Goal”; the intermediate levels correspond to the criteria and sub-criteria, while the lowest level contains the “decision alternatives” (M. Berrittella, 2007). The main objective of this method is to determine the relative importance of each element by conducting a pairwise comparison. These comparisons are designed to reflect the relative strength of preferences and can be derived either from actual measurements or from a specified scale.
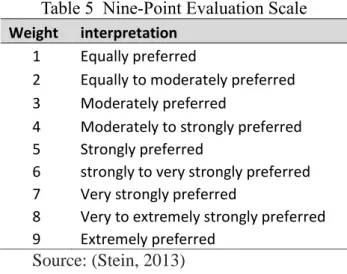
The pairwise comparison judgments in the AHP are evaluated using the Nine-point evaluation scale (Table 5), developed by Saaty (1977). The values of the scale represents the intensities of the judgments and it allows to convert the qualitative values into numerical and form the judgment matrix; used to compute the priorities of the elements. Each value is assigned based on the opinion of experts or decision makers involved in the matter.
21
Table 5 Nine-Point Evaluation Scale
Weight interpretation
1 Equally preferred
2 Equally to moderately preferred 3 Moderately preferred
4 Moderately to strongly preferred 5 Strongly preferred
6 strongly to very strongly preferred 7 Very strongly preferred
8 Very to extremely strongly preferred 9 Extremely preferred
Source: (Stein, 2013)
The pair-wise comparison matrix is formulated as it can be seen in Figure 4, where aij represents
the pairwise comparison rating between the elements i and element j of a level with respect to the upper level. After the pair-wise comparison matrix is developed, the priorities of the elements can be estimated (Sadeghi and Ameli, 2012) by finding the principal eigenvector w of the matrix A, represented as:
𝐴𝑊 = 𝜆 max 𝑊 (1)
When the vector W is normalized, it becomes the vector of priorities of elements of one level with respect to the upper level, where λ max is the largest eigenvalue of the matrix A. This process will allow us to obtain the relative weight of the elements (Saaty, 2012).
It is noted that the AHP is a subjective methodology, which relies on the opinion of the experts, therefore this method allows inconsistency in their answers. To validate every response is necessary to conduct the consistency test, which consist on calculating the consistency ratio. The consistency ratio (CR) is used to measure the consistency in the pair-wise comparison. Saaty (1994) developed values of CR for different matrices sizes: the CR value is 0.05 for
3-22
by-3 matrix; 0.08 for a 4-by-4 matrix; and 0.1 for larger matrices. If the consistency level falls into the acceptable range the weight results are valid (Li, 2001).
The AHP was chosen among many methodologies mainly for its ability to consider subjective judgments as well as quantitative information to enter into the evaluation process simultaneously and provides decision-makers with better communication (S. Shang, 2004). This method allows to determine results in a simple manner using pair-wise comparison. In other words, the participation of the stakeholders is an important part of the process. The AHP offers a simple method to obtain results applying a simple a simple pair-wise comparison.
3.2 Scenario description: Transit Subsidies in Panama
The transportation system of Panama receive two types of transit subsidies distributed among the metropolitan area of the providence of Panama as follows: Panama City 46.9 %, San Miguelito 16.7 %, Arraijan 12.5%, La Chorrera 9.5 % and other areas 14.4 %. The main authorities grant an operating subsidy to support the price of the fuel, same subsidy provided to previous operators.
Figure 3 Subsidy Distribution
Source: Ministry of Economy and Finance Panama
The other subsidy is a demand side subsidy granted to maintain the low cost of fare. This subsidy was introduce in 2011, when the implementation of a new system threatened to increase
47% 17% 13% 10% 14%
Subsidy Distribution
Panama City San Miguelito Arraijan La Chorrera Other23
the cost of service. The new fare was set at USD 0.49 for passengers and USD 0.25 for students, which for the authorities represented a high cost to impose on users. Therefore, authorities decided to establish a subsidy to cover 50% (0.24 per passenger and 0.15 for students) of the total fare cost. With the implementation of this subsidy the cost of fare remained in USD 0.25 for regular users and USD 0.10 for the students. This demand side subsidy is calculated bases on the passengers per trip. Table 6 contains the subsidy annual expenditure from 2009 to the first months of 2013.
Table 6 Transit Subsidies in Panama 2009-2013 (Million USD)
Recipient Years
2009 2010 2011 2012 2013
Fuel Subsidy (Diesel) 58.9 82.1 98.8 96.4 4.9
Fare Subsidy 8.0 34.1 23.4
Source: Ministry of Economy and Finance Panama
Transit subsidies in Panama are granted to prevent social exclusion of low-income households. The implementation of new transport systems required an important investment of government assets. The Ministry of Economy and Finance reveled, that for 2014 USD 50 million of the government fund are going to be directed to support the operation of the new metro line, USD 20 million of which are going to be used as fare subsidy. The main concern of the authorities is to provide an affordable transport system that would guaranty an effective distribution of resources among income classes. However, the low cost imposed on the fare is not enough to cover the operating cost of providing the service, affecting quality of service. In the last year, operators reported financial difficulties and problems with the distribution of the subsidies provided. A report released by the transit and transportation authority of Panama; authority in charge of the distribution of the subsidy, revealed that in 2011 transport services became 12.2% more expensive than the previous year causing an increase in operating cost.
On the other part, authorities are concerned about the integration of the two modes and the distribution of the subsidies. To improve this, one of the ideas is to implement new technologies for the collection of the fare, in which an integration of the two modes could be achieved by using a single card, improving the convenience of the systems and will allow to implement discounts for users using the both systems. The collection system for the fare is available for public bus and present some problems with the recharge and the availability of distribution points.
24
To improve distribution of subsidies between the two modes and cover operating cost, the transport authorities of Panama have decided to develop new subsidy plans that would not only represent a direct benefit for user, but will also help operators to overcome their financial problems and encourage them to improve current service levels. The new plans must proposed the integration of both systems, provide distribution between less privileged groups and provide financial aid to transport operator.
Below we have listed the main problems that the government wish to eliminate with the implementation of new subsidy plans:
Eliminate operator financial difficulties
Improve allocation of the subsidies between modes Promote the implementation of new technologies
Improve integration and convenience of the two systems Propose plans for the new systems that required subsidies.
3.2.1 Users Patterns
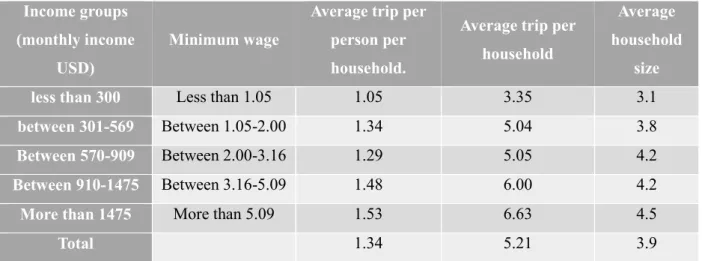
The metropolitan area of Panama, receives a total of 1,715,122 daily trips, of which 35.4% are work-related trips, 39.3% study-related trips and 25.3% are made for leisure purposes. The trips are distributed among the principal modes of the city, a 50.3% (874,164 daily trips) of which are made by public bus, while a 16.9% are made by private automobile. The average number of daily trips per household in the metropolitan area is 5.21, and 4.15 motor trips. If this amount of travel is weighted by the number of household members, which is 3.9 in Panama, the average number of trips per person is 1.34, and the number of motorized trips is 1.05. A relatively low factor compared to cities such as; Chile (1.73), Lima (2.1) or Sao Paulo (1.88), which proves that the inhabitants of Panama, performed more mandatory trips due to the low level of mobility. The average number of total trips per individual is 2.17, and the average number of motorized trips is 2.05, 10 which is expected since an individual should do (in theory 10 trips) at least two trips: outbound and return. Table 7 contains the distribution of the mobility based on income groups. The groups are divided in 4 types of income.
25
Table 7 Distribution of Mobility by Income Groups Income groups
(monthly income USD)
Minimum wage
Average trip per person per household.
Average trip per household
Average household
size
less than 300 Less than 1.05 1.05 3.35 3.1
between 301-569 Between 1.05-2.00 1.34 5.04 3.8
Between 570-909 Between 2.00-3.16 1.29 5.05 4.2
Between 910-1475 Between 3.16-5.09 1.48 6.00 4.2
More than 1475 More than 5.09 1.53 6.63 4.5
Total 1.34 5.21 3.9
Source: The World Bank (2007)
Mobility in Panama has a strong correlation with household income. The recent economic growth of the last few years, has caused a significant increase of motorized travel. It is estimated that over 400,000 private vehicles are currently circulating, a relatively high figure for the region. The vehicle per capita of the providence of Panama, grew from 130 vehicles per 1000 inhabitants in 1992 to 208 vehicles per 1000 inhabitants in 2005; an increase of 3.7% annually, greater than the population growth. However, only 28% of households in the metropolitan area have one vehicle or more, and the average car per house is 1.4. Moreover, only 11.5% of 10 households in the low income group own one vehicle or more, while 62.5% of households in the highest income group own at least one vehicle. These statistics shows that, low income households have less access to a private car than, high income households. This first group also represents the main users of public transportation; which is the main mode to commute to work.
3.3 Determination of the Objectives, Criteria and Alternatives: The Analytic Hierarchy Structure
This study applies a three-level analytic hierarchy process to decompose the main problem into: the Goal; that reflect what is desired to achieve, the following level are decomposed by objectives intended to address the problem and evaluate each alternatives placed in the last level as a solution to the problem. The proposed goal for this study is to evaluate sustainable subsidy plans for Panama. Sustainable development has taken an important part in transportation planning in the past few year. Sustainability is a concept that incorporates three important dimensions: environmental, economic and social. This term is constantly employed in decision
26
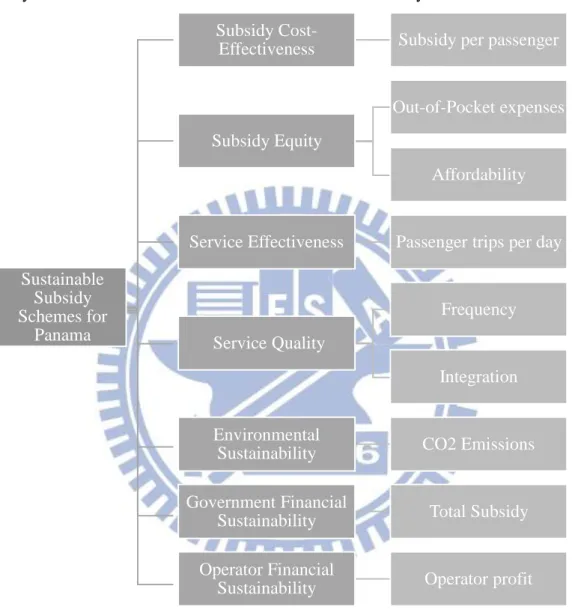
making process; the reason is that by including sustainability in policy planning, we are considering the indirect and long-term impacts, focusing on the social welfare impacts and environment effects. Sustainability is a goal that allow us to include not only social, economic and environmental impacts; but also to consider financial sustainability in the design of the subsidy schemes for Panama. The three levels of the hierarchy structure are show in Figure 4.
Figure 4 Analytic Hierarchy Structure: Sustainable Subsidy Schemes for Panama
3.3.1 Objectives-Criteria Selection
The second level of the structure represents the objectives and sub-criteria used to evaluate the different subsidy schemes. The objectives were selected based on the impacts and attributes that could present any change or improvement with the implementation of the schemes and also with the help of experts on the field of transportation and economy. Every objective is based on the premise of sustainability. The criteria used to evaluate the schemes are based on sustainable
Sustainable Subsidy Schemes for
Panama
Subsidy
Cost-Effectiveness Subsidy per passenger
Subsidy Equity
Out-of-Pocket expenses
Affordability
Service Effectiveness Passenger trips per day
Service Quality
Frequency
Integration
Environmental
Sustainability CO2 Emissions
Government Financial
Sustainability Total Subsidy
Operator Financial
27
indicators, which provide qualitative and quantitative test that serves to indicate the results of a given action. For the evaluation of the subsidies, criteria such as: Administration cost, systems financial performance, overall impacts and implications are included in the evaluation. As it was mentioned by Litman (2008) indicators of cost, equity (social) and environmental impacts must be included to provide a more comprehensive and balanced analysis. A total of 7 objectives and 9 criteria were proposed as follows (Table 8):
Economic sustainability is used to evalute the performance of a given action in a business point of view. This mean how are the monetary resources being utilized? and how are being expended?. Subsidy cost-effectiveness reflect the value of the benefits obtained for dollar invested. Policy makers, should focus on expending funds in an effective maner. The proposed sub-criteria tu measure this objective is subsidy per passenger, which reflects the allocation of subsidies per each passenger. Another important performance measure is Service effectiveness, which conteplates the gap between service consumption and service outputs. Is the measure of outcome compared to unit of input in terms of service (Eboli, 2012). As such, these measures are a critical indicator of the success of a transit system and should be heavily relied upon when evaluating a particular system, in this case in terms of passenger trip per day measure of the extent to which passengers consume the outputs (Barata et al., 2012). Subsidy Equity relates to avoiding exclusion or reduction of trips undertaken by citizens from certain socioeconomic groups or geographical locations and concerns about the affordability of the service provided (CIE 2006). Consumption of transportation is directly affected by travelling expense (Litman 2013); in other words the fare that users paid for public transport service. For the evaluation of equity tow indicators were selected: Out-of-pocked expenses and affordability. The user expenditure represents an indicator of importance of public transport modes in relation to one another, to other modes, and within total expenditure (TRL ,2004). Affordability is estimated as the percentage of monthly income or expendinture used on transport by poor families (Echenique, 2007). The affordability index is commonly used to exprese monthly income expenses by trips per moth. In a report developed for the World Bank to determine the affordability in developing countries, this index was used based on a fixed amount of 60 trips and the percentage of income per capita of the lowest income groups (Carruthers, 2005)
Social sustainability concerns the impacts caused on users or the system, when a policy is implemented and their overall satisfaction. This concep usually contemplates elements such as equity, affordability, service quality; etc. Service Quality, reflect the quality of service
28
experienced by users (Litman, 2009). One of the most distinctive aspects used to measure service quality is frequency. Service frequency measures how often transit service is provided. It is considered an important factor in the mode choice behaviour of passengers, and the attribute with the highest weight on the overall transit service quality (Eboli, 2012). Another quality performance criteria included in the evaluation is the modal integration. This subcirteria is utilize to measure how easy is to transfer within different transit systmes (Litman, 2013).
Environmental Sustainability is one of the most important elemenst in sustainable development, measures how transit services produce any reduction of environmental impacts. The environmental indicators measure the benefits of a mode of travel in terms of its contribution to environmental protection (Woldeamanuel, 2012). Generally and depending on the occupancy rates public transport produces much lower CO2 emissions than private car
(Behrendt et al., 2010). While petrol and diesel fuelled cars emit 130.9 g and 124.2 g of CO2
per passenger kilometer, the CO2 emissions from bus and coach journeys per passenger
kilometer are 89.1 (Behrendt et al., 2010). CO2 emissions is the indicators proposed to evaluate
environmental impacts of subsidy schemes. This indicator can be measure by kg of CO2 per
passenger kilometer. The importance of this criteria is evaluate the ability of reduce CO2
emissions and to improve the environmental performance (Bernardini et al., 2011).
Financial sustainability is usually omitted in sustainability evaluation, however as (Buehler and Pucher, 2011) mention improving this element would help realize the potential environmental and social benefits of public transport, since it would make expanded public transport service more affordable, both for the governments who provide it and for the passengers who use it. This objective include both extremes government and operators. The authorities which to allocate transit subsidies to improve current inefficiencies and cover operating subsidies, and operators try to obtain support to cover their expenses. Governmental Financial Sustainability expresses the total government expenditure on subsidy to transport systems. The appropriate distribution of state funds to achieve transit improvement (Glauthier 1976). The selected criteria is the total subsidy assigned. Operator Financial Sustainability. This indicator was included to measure the effect that a given policy may have on the productive efficiency of operator. In (Gómez‐Lobo et al., 2009) is explained that capital subsidies increase technical change while operating subsidies reduce technical change. On the other hand, operating subsidies promote the use of more labor and fuel than would be optimal, and that capital subsidies do not wholly compensate for this effect. When receiving subsidies some firms
29
do not minimize the cost as a result of the incentives, which is reflected in its profits. All of these factors can be captured by considering the profit of the operators.
Table 8 Criteria and Sub-criteria
Objectives Criteria Description Study
Subsidy Cost Effectiveness
Subsidy per passenger
The comsuption of public transportation services in relation to the resources expended. Benefits obtained for dollar invested. (Board, 2003) Subsidy Equity Out-of-pocket expenses Affordability
Distribution of the cost and benefits of subsidies among income classes. Impacts caused on users or the system.
(Pucher, 1981) (Woldeamanuel, 2012), (Robin Carruthers, 2005) Service Quality Frequency
Integration
Reflect the quality of service experienced by users. (Litman, 2009) (Litman, 2013) Service Effectiveness Passenger
trips per day Critical indicator of the success of a transit system. (Board, 2003), (Barata et al., 2012) Environmental Sustainability CO2 Emissions
Benefit of each modes of travel in terms of its contribution to environmental protection. Transit services produce any reduction of environmental impacts. (Woldeamanuel, 2012) (Wang et al., 2009) Governmental Financial Sustainability Total subsidy
Appropriate dsitribution of state funds to achieve transit
improvement. total government expenditure
(Glauthier, 1976)