Synthesis of Fluorescent Carbohydrate-Protected
Au Nanodots for Detection of Concanavalin A and
Escherichia coli
Chih-Ching Huang,†Chao-Tsen Chen,‡Yen-Chun Shiang,‡Zong-Hong Lin,‡and Huan-Tsung Chang*,‡
Institute of Bioscience and Biotechnology, National Taiwan Ocean University, Keelung, Taiwan, and Department of Chemistry, National Taiwan University, Taipei, Taiwan
This study describes a novel, simple, and convenient method for the preparation of water-soluble biofunctional Au nanodots (Au NDs) for the detection of Concanavalin A (Con A) andEscherichia coli (E. coli). First, 2.9 nm Au nanoparticles (Au NPs) were prepared through reduc-tion of HAuCl4· 3H2O with tetrakis(hydroxymethyl)phos-phonium chloride (THPC), which acts as both a reducing and capping agent. Addition of 11-mercapto-3,6,9-trioxaundecyl-r-D-mannopyranoside (Man-SH) onto the surfaces of the as-prepared Au NPs yielded the fluorescent mannose-protected Au nanodots (Man-Au NDs) with the size and quantum yield (QY) of 1.8 ((0.3) nm and 8.6%, respectively. This QY is higher than those of the best currently available water-soluble, alkanethiol-protected Au nanoclusters. Our fluorescent Man-Au NDs are easily purified and by multivalent interactions are capable of sensing, under optimal conditions, Con A with high sensitivity (LOD ) 75 pM) and remarkable selectivity over other proteins and lectins. To the best of our knowledge, this approach provided the lowest LOD value for Con A when compared to the other nanomaterials-based detecting method. Furthermore, we have also developed a new method for fluorescence detection ofE. coli using these water-soluble Man-Au NDs. Incubation with E. coli revealed that the Man-Au NDs bind to the bacteria, yielding brightly fluorescent cell clusters. The relation-ship between the fluorescence signal and the E. coli concentration was linear from 1.00× 10⁶to 5.00× 10⁷cells/mL (R2) 0.96), with the LOD of E. coli being 7.20× 10⁵cells/mL.
Semiconductive and metallic nanomaterials exhibiting quan-tized properties have become the focus of new applications in optoelectronics, catalysis, and medical diagnostics.1With unique optical properties, sizes similar to those of biopolymers, and large surface areas, nanoparticles (NPs) and quantum dots (QDs) conjugated with biomolecules have attracted great interest for cell
imaging and the sensing of molecules of interest in biological samples.1Carbohydrate-modified metallic NPs, magnetic NPs and QDs have been used to explore carbohydrate-protein interac-tions,2 which, on cell surfaces, play key roles in many cellular processes, including cell growth regulation, differentiation, im-mune response, cellular trafficking, adhesion, cancer cell metasta-sis, and inflammation by bacteria and viruses.3,4 Proteins pos-sessing carbohydrate-binding domains are known as lectins.4
Carbohydrate-protein interactions are generally weak, but they can be compensated for by the presentation of multiple ligands to their respective binding proteins.3One approach is to assemble many carbohydrate units onto the surfaces of NPs; the resulting polyvalent interactions between the multiple ligands and proteins can be collectively much stronger than that of the corresponding monovalent interaction.2The shift in the surface plasmon absorption band and the consequent color change associated with the aggregation of carbohydrate-stabilized metallic NPs has led to the development of colorimetric assays for selectively sensing lectins.5Carbohydrate-QD conjugates have also been developed to study protein-carbohydrate interactions.6 Concerns have been raised, however, regarding the toxicity of QDs; several studies have suggested that the cytotoxicity of QDs
* To whom correspondence should be addressed. Professor Huan-Tsung Chang, Department of Chemistry, National Taiwan University, 1, Section 4, Roosevelt Road, Taipei 106, Taiwan. Phone and fax: 011-886-2-33661171. E-mail: changht@ntu.edu.tw.
†
National Taiwan Ocean University.
‡National Taiwan University.
(1) (a) Salgueirin˜o-Maceira, V.; Correa-Duarte, M. A. Adv. Mater. 2007, 19, 4131–4144. (b) Haick, H. J. Phys. D: Appl. Phys. 2007, 40, 7173–7186. (c) Huang, X.; Jain, P. K.; El-Sayed, I. H.; El-Sayed, M. A. Nanomedicine 2007, 2, 681–693. (d) Medintz, I. L.; Uyeda, H. T.; Goldman, E. R.; Mattoussi, H. Nat. Mater.2005, 4, 435–446. (e) Jamiesona, T.; Bakhshia, R.; Petrova, D.; Pococka, R.; Imani, M.; Seifalian, A. M. Biomaterials 2007, 28, 4717– 4732.
(2) (a) de la Fuente, J. M.; Penade´s, S. Biochim. Biophys. Acta 2006, 1760, 636–651. (b) El-Boubbou, K.; Gruden, C.; Huang, X. J. Am. Chem. Soc. 2007, 129, 13392–13393.
(3) (a) Jelinek, R.; Kolusheva, S. Chem. Rev. 2004, 104, 5987–6015. (b) de la Fuente, J. M.; Penade´s, S. Glycoconjugate J. 2004, 21, 149–163. (c) Dwek, R. A. Chem. Rev. 1996, 96, 683–720. (d) Simanek, E. E.; McGarvey, G. J.; Jablonowski, J. A.; Wong, C.-H. Chem. Rev. 1998, 98, 833–862. (4) Lis, H.; Sharon, N. Chem. Rev. 1998, 98, 637–674.
(5) (a) Schofield, C. L.; Haines, A. H.; Field, R. A.; Russell, D. A. Langmuir 2006, 22, 6707–6711. (b) Otsuka, H.; Akiyama, Y.; Nagasaki, Y.; Kataoka, K. J. Am. Chem. Soc. 2001, 123, 8226–8230. (c) Takae, S.; Akiyama, Y.; Otsuka, H.; Nakamura, T.; Nagasaki, Y.; Kataoka, K. Biomacromolecules 2005, 6, 818–824. (d) Hone, D. C.; Haines, A. H.; Russell, D. A. Langmuir 2003, 19, 7141–7144.
(6) (a) Chen, Y.; Ji, T.; Rosenzweig, Z. Nano Lett. 2003, 3, 581–584. (b) Sun, X.-L.; Cui, W.; Haller, C.; Chaikof, E. L. ChemBioChem 2004, 5, 1593– 1596. (c) Babu, P.; Sinha, S.; Surolia, A. Bioconjugate Chem. 2007, 18, 146–151.
Anal. Chem. 2009, 81, 875–882
10.1021/ac8010654 CCC: $40.752009 American Chemical Society Analytical Chemistry, Vol. 81, No. 3, February 1, 2009 875
Downloaded by NATIONAL TAIWAN UNIV on July 30, 2009
might be mediated by their release of Cd2+.7Thus, there is a demand for the development of nontoxic fluorescent NPs to replace potentially toxic QDs in bioassays. Although multivalent forms of carbohydrate-functionalized fluorescent polymers have been employed to successfully detect lectins and to label bacteria, there are problems associated with their water solubility and complicated syntheses in organic phases.8Here, we report a universal, simple, and convenient method for the preparation of water-soluble, luminescent, R-D-mannose-conjugated Au nanodots (Man-Au NDs) and demonstrate their applications to detection of concanavalin A (Con A) and
Escherichia coli (E. coli) through multivalent cooperative interactions between Man-Au NDs and proteins (Scheme 1).
EXPERIMENTAL SECTION
Chemicals. Mannose, glucose, galactose, lactose,
tetrakis(hy-droxymethyl)phosphonium chloride (THPC), and all of the metal salts used in this study were purchased from Aldrich (Milwaukee, WI). All proteins and lectins were obtained from Sigma (St. Louis, MO). Sodium tetraborate and hydrogen tetrachloroaurate(III) trihydrate were obtained from Acros (Geel, Belgium). All of the other salts and buffers were purchased from Aldrich. 11-Mercapto-3,6,9-trioxaundecyl-R-D-mannopyranoside was synthesized and purified according to previously reported procedures.9
Synthesis of Au NPs. The Au NPs were synthesized through
reduction of HAuCl4· 3H2O with THPC.10,11A THPC solution (1 mL), which had been prepared by mixing 80% THPC solution (12
µL) with water (1 mL), was added to a solution formed by mixing
1 M NaOH (0.5 mL; Aldrich) with water (45 mL). The mixture was stirred for 5 min, followed by the rapid addition of 1 wt % HAuCl4· 3H2O (1.34 mL). The color of the solution turned brown over the course of 1 min. The solution was stirred for
15 min and then stored at 4°C prior to further use. The average size of the as-prepared Au NPs was determined using transmis-sion electron microscope (Tecnai 20 G2 S-Twin TEM, Philips/ FEI, Hillsboro, Oregon) to be 2.9 (±0.5) nm. The particle concentration of the as-prepared Au NP solution was deter-mined to be 0.94 µM by using the equation (n ) 3m/4πr3s), assuming the presence of ideal spherical particles, in which n is the amount of gold particles per milliliter, m is the molar mass of gold in the substance [g/mL], r is the particle radius [cm], and s is the specific gravity of colloidal gold [19.3 g/cm3].12The m and r values were determined by conducting inductively coupled plasma mass spectroscopy (ICP-MS) and TEM measurements, respectively. This formula gives the number of Au NP per milliliter. This concentration was then converted into number of gold particles per liter and divided by Avogadro’s number (6.023 × 10²³) to get the final molar concentration of gold nanoparticles.
Preparation of Fluorescent Man-Au NDs. The Man-Au NDs
were prepared from the as-prepared Au NPs (0.47 µM) using Man-SH (40 mM). The as-prepared Au NP solution (5.0 mL), DI water (3.375 mL), trisodium tetraborate (50 mM, pH 9.2, 1.0 mL), and Man-SH (0.625 mL, 40 mM) were added sequentially into a 10 mL volumetric flask. The mixture was left to react for 72 h in the dark at room temperature. The resulting Man-Au NDs exhibited fluorescence. We further prepared different sizes of Man-Au NDs by varying the molar ratios of Man-SH to Au NPs (the concentra-tions of Man-SH were over the range 0-20 mM, while that of Au NPs was 0.46 µM). We purified the fluorescent Man-Au NDs by conducting centrifugal filtration (13 500g) for 40 min through a filter having a cutoff of 10 kDa (membrane nominal pore size∼1 nm). We then washed the pellets with 5 mM sodium phosphate (pH 7.0) several times. Most of the Man-SH, precursors, and possibly Au (I)-thiolate in the solution were removed. We then measured the fluorescence of the removed solution, showing a very weak fluorescence when excited at 375 nm. By comparison of the absorbance of the original Man-Au NDs solution at 375 (7) Hardman, R. Environ. Health Persp. 2006, 114, 165–172.
(8) (a) Disney, M. D.; Zheng, J.; Swager, T. M.; Seeberger, P. H. J. Am. Chem. Soc.2004, 126, 13343–13346. (b) Xue, C.; Jog, S. P.; Murthy, P.; Liu, H.
Biomacromolecules2006, 7, 2470–2474.
(9) Tsai, C.-S.; Yu, T.-B.; Chen, C.-T. Chem. Commun. 2005, 4273–4275. (10) Huang, C.-C.; Yang, Z.; Lee, K.-H.; Chang, H.-T. Angew. Chem., Int. Ed.
2007, 46, 6824–6828.
(11) Duff, D. G.; Baiker, A.; Edwards, P. P. Langmuir 1993, 9, 2301–2309.
(12) Ackerman, G. A.; Yang, J.; Wolken, K. W. J. Histochem. Cytochem. 1983, 31, 433–440.
Scheme 1. Schematic Representation of the Preparation of Fluorescent Man-Au NDs for the Detection of Con A and E. coli
Downloaded by NATIONAL TAIWAN UNIV on July 30, 2009
nm to that of the resuspended solution,∼95% of the Man-Au NDs was deemed to have been collected (data not shown). On the other hand, the suspended solution fluoresced more strongly, which reveals that the fluorescence signal is truly from the particles. The corresponding particle concentration in the resuspended solution was estimated to be 1.5 µM, provided that the Man-Au NDs had a uniform diameter of 1.8 (±0.3) nm, which was estimated from a count of 100 Man-Au NDs particles in a transmission electron microscopy (TEM) image. The purified Man-Au ND sample was stable for at least 2 months when stored at 4°C in the dark. Energy-dispersive X-ray spectroscopy (EDS) analysis using a 0.7 nm diameter electron probe was employed to determine the chemical identities of the Man-Au NDs. The measurement was conducted by illuminating an electron beam on a whole ND. The absorption and fluorescence spectra of the as-prepared Man-Au ND solutions were measured using a Cintra 10e UV-vis spectrometer (GBC, Victoria, Australia) and a Cary Eclipse fluorescence spectrophotometer (Varian, CA), respectively.
Turn-On Fluorescence Assays of Con A. A series of
mixtures (1.0 mL) of Con A (0-10.0 nM) and Man-Au NDs (1.0 nM) in a buffer solution (10 mM sodium phosphate, 0.1 mM MnCl2, and 0.1 mM CaCl2; pH 7.0) were equilibrated at room temperature for 60 min. Subsequently, the mixtures were centrifuged (RCF 20 000g, 20 min) and the supernatants were removed. The precipitates were resuspended in a buffer (pH 7.0, 100 µL) containing 10 mM sodium phosphate, 0.1 mM MnCl2, 0.1 mM CaCl2, and 100 mM mannose, and then they were left to stand for another 60 min. All solutions were then transferred into 0.4 mL quartz cuvettes; their fluorescence spectra were measured by operating the fluorescence spectro-photometer at an excitation wavelength of 375 nm.
Bacterial Growth and Assays. E. coli K12 wild-type strains
(ATCC 25404) were grown in sterile Luria-Bertani (LB) media [containing bacto-tryptone (2.5 g), bacto-yeast extract (1.25 g), and NaCl (2.5 g) in 250 mL of deionized water adjusted to pH to 7.0 with 5.0 M NaOH]. A single colony of each strain was lifted from agar plates and inoculated in LB media (10 mL), and the culture was grown overnight until the value of A600reached 1.0. A portion of each of the cell mixtures (1 mL) was centrifuged
(10 000g, 20 min, 4°C) and washed twice with PBS buffer (100 mM Na2HPO4, 1.75 mM KH2PO4, 140 mM NaCl, and 2.70 mM KCl; adjusted to pH 7.4 using HCl; 1 mL). The washed cells were resuspended in PBS buffer (1.0 mL) containing CaCl2(0.1 mM) and MnCl2(0.1 mM). Cells diluted to (1.00×10⁶)-(2.50
×108) cells/mL were incubated with the Man-Au NDs (25 nM) for 60 min under gentle shaking, centrifuged (10 000g, 20 min), and washed twice with PBS buffer; the final cell pellets were resuspended in PBS buffer containing 100 mM mannose.
RESULTS AND DISCUSSION
Preparation of Man-AuNDs. We prepared Man-Au NDs from
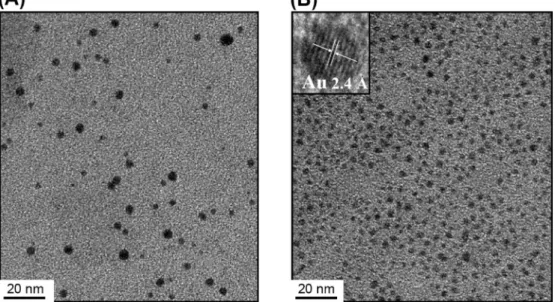
2.9 (±0.5) nm Au NPs (Figure 1A) in an aqueous phase at room temperature using Man-SH. First, we prepared the Au NPs through reduction of HAuCl4· 3H2O with THPC, which acts as both a reducing and capping agent (Figure 1). Addition of Man-SH onto the surfaces of the as-prepared Au NPs yielded the fluorescent Au NDs. TEM revealed that the as-prepared Man-Au NDs were spherical, having diameters of 1.8 (±0.3) nm (Figure 1B); i.e., the diameters of the spherical particles decreased upon being capped with Man-SH. This phenomenon is presumably due to the formation of the very strongly covalent, distinctly directional Au-S bonds and the preference for dissociation into very small Au and Au-thiolate clusters (on the basis of fragmentation energies), as opposed to breaking the Au-S bonds and detaching the Au clusters from the thiolate radical.13The inset in Figure 1B (high-resolution transmission electron microscope (HRTEM) image) suggests that the lattice fringes of the as-prepared Man-Au NDs are consistent with metallic gold having a discerned lattice spacing of 2.4 Å, which corresponds to the d-spacing of the (111) crystal plane of fcc Au.14EDS measurements were conducted to confirm the presence of the Man-SH molecules at the surface of the Au NDs. The EDS spectrum of the Man-Au NDs shown in Figure S1 in the Supporting Information indicates the presence of Au from the Au NDs and also C, O, and S from the Man-SH (13) (a) Kru¨ger, D.; Fuchs, H.; Rousseau, R.; Marx, D.; Parrinello, M. J. Chem. Phys.2001, 115, 4776–4786. (b) Konoˆpka, M.; Rousseau, R.; Sˇtich, I.; Marx, D. J. Am. Chem. Soc. 2004, 126, 12103–12111.
(14) Buffat, P.-A.; Flu¨eli, M.; Spycher, R.; Stadelmann, P.; Borel, J.-P. Faraday Discuss.1991, 92, 173–187.
Figure 1. TEM images of the (A) Au NPs and (B) Man-Au NDs. The inset to part B is an HRTEM image of a Man-Au ND.
Downloaded by NATIONAL TAIWAN UNIV on July 30, 2009
molecules. The Cu peaks are due to the copper grid used in the sample preparation. The large sulfur peak evident in the EDS spectrum confirms an existence of a significant amount of Man-SH molecule at the surface of the Au NDs; the ratio of S/Au was determined to be 0.79±0.4 (n ) 5) from S K and Au L lines.
Optical Properties and Stability of Man-AuNDs. Although
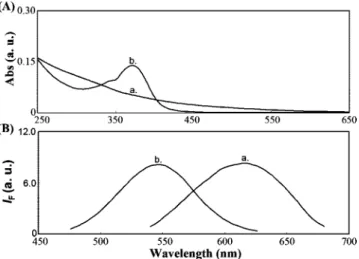
the Man-Au NDs exhibited an absorption band centered at a wavelength (λmaxabs) of 375 nm (extinction coefficient: 2.32×10⁶ M-1 cm-1), no apparent absorption band appeared for the original Au NPs having a mean diameter of 2.9±0.5 nm (Figure 2A). On the basis of the well-established spectral assignment for the Au(I) thiolate complexes, we infer that the absorption of Man-Au NDs at 375 nm originates from metal-centered and/or ligand-metal charge transfer (LMCT; S f Au) transitions.15The fluorescence bands of the original Au NPs and Man-Au NDs were centered at wavelengths of 618 and 545 nm, respectively (Figure 2B). We note that the fluorescence intensity of the Man-Au NDs was∼240 000-fold higher than that of the original Au NPs. To ensure that those bands were indeed fluorescence signals, we measured the spectra of Man-Au ND solutions at various concen-trations. We observed a linear relationship between the signal intensity and the concentration over the range 0.015-100 nM (R2 ) 0.99) and a limit of detection (LOD) of 10 pM (data not shown). We purified the fluorescent Man-Au NDs by conduct-ing centrifugal filtration (13 500g) for 40 min through a filter having a cutoff of 10 kDa. When compared with that of the original Man-Au NDs solution, the fluorescence of the removed solution at 375 nm was negligible. As a reference, we did not observe any fluorescence of Man-SH (2.5 mM) in 5 mM sodium tetraborate (data not show). The results reveal that the fluorescence is truly from the particles. The quantum yield (QY) of the as-prepared Man-Au NDs was 8.6%, determined through comparison with 10-6M quinine (QY ) 53%) shown
in Figure S2 in the Supporting Information. This QY is higher than those (QY≈ 0.001-5%) of the best currently available water-soluble, alkanethiol-protected Au nanoclusters and our previously prepared 11-mercaptoundecanoic acid (11-MUA)-protected Au NDs (11-MUA-Au NDs).10,16-18This QY is also comparable to those of Au NDs that are encapsulated and stabilized by such polymers as polyamidoamine (PAMAM) dendrimers and poly-ethylenimine (PEI);19there are, however, problems associated with the general water solubility, difficult bioconjugation, and chemical- and photoinstability of such polymer-protected Au NDs. The fluorescence brightness of our prepared Man-Au ND is stronger than that of polymer stabilized Au NDs, suggesting that our Man-Au ND is more suitable for cell imaging.
At different Man-RSH/Au NPs molar ratios, we obtained differently sized (2.9-1.5 nm) of Man-Au NDs that fluoresced at various wavelengths (618-525 nm), while they all absorbed light at 375 nm (see Supporting Information, Figure S3). The TEM image (Figure S3 in the Supporting Information) reveals that there were no Au NDs present in the solution at the concentration of Man-RSH higher than 20 mM; Au NPs were all dissociated into Au-thiolate complexes. As a result, the as-prepared solution did not absorb light at 375 nm and fluoresce. The sizes of these Au NDs decreased upon increasing the concentration of Man-RSH, resulting from producing significant fragmentation energies; i.e., Au NPs tend to dissociate into smaller Au clusters and Au-thiolate complexes once the Man-RSH molecules adsorbed onto their surfaces.20 The results further support that the Man-Au NDs fluoresced when excited at 375 nm.
We further studied the behavior of the Man-Au NDs through measurements of their fluorescence lifetime. By fitting to a biexponential fluorescence decay, we obtained lifetimes t1and t2 for the Man-Au NDs of 159 and 834 ns, respectively (see the Supporting Information, Figure S4). There are several explana-tions of the photoluminescence properties of Au clusters. The interband (d-band electrons to the sp-conduction band) and the relaxed radiative recombination across the HOMO-LUMO gap
(15) (a) Forward, J. M.; Bohmann, D., Jr.; Staples, R. J. Inorg. Chem. 1995, 34, 6330–6336. (b) Yam, V. W.-W.; Lo, K. K.-W. Chem. Soc. Rev. 1999, 28, 323–334. (c) Yam, V. W.-W.; Cheng, E. C.-C.; Zhou, Z.-Y. Angew. Chem., Int. Ed.2000, 39, 1683–1685. (d) Yam, V. W.-W.; Cheng, E. C.-C.; Cheung, K.-K. Angew. Chem., Int. Ed. 1999, 38, 197–199.
(16) (a) Wyrwas, R. B.; Alvarez, M. M.; Khoury, J. T.; Price, R. C.; Schaaff, T. G.; Whetten, R. L. Eur. Phys. J. D 2007, 43, 91–95. (b) Negishi, Y.; Nobusada, K.; Tsukuda, T. J. Am. Chem. Soc. 2005, 127, 5261–5270. (c) Link, S.; Beeby, A.; FitzGerald, S.; El-Sayed, M. A.; Schaaff, T. G.; Whetten, R. L. J. Phys. Chem. B2002, 106, 3410–3415. (d) Negishi, Y.; Tsukuda, T. Chem.
Phys. Lett.2004, 383, 161–165. (e) Price, R. C.; Whetten, R. L. J. Am. Chem.
Soc.2005, 127, 13750–13751. (f) Schaaff, T. G.; Shafigullin, M. N.; Khoury, J. T.; Vezmar, I.; Whetten, R. L. J. Phys. Chem. B 2001, 105, 8785–8796. (17) (a) Wang, G.; Huang, T.; Murray, R. W.; Menard, L.; Nuzzo, R. G. J. Am. Chem. Soc.2005, 127, 812–813. (b) Huang, T.; Murray, R. W. J. Phys. Chem.
B2001, 105, 12498–12502. (c) Wang, G.; Guo, R.; Kalyuzhny, G.; Choi, J.-P.; Murray, R. W. J. Phys. Chem. B 2006, 110, 20282–20289. (d) Yang, Y.; Chen, S. Nano Lett. 2003, 3, 75–79. (e) Link, S.; El-Sayed, M. A.; Schaaff, T. G.; Whetten, R. L. Chem. Phys. Lett. 2002, 356, 240–246. (f) Bigioni, T. P.; Dag, O¨ .; Whetten, R. L. J. Phys. Chem. B 2000, 104, 6983–6986. (g) Liu, X.; Li, C.; Xu, J.; Lv, J.; Zhu, M.; Guo, Y.; Cui, S.; Liu, H.; Wang, S.; Li, Y. J. Phys. Chem. C 2008, 112, 10778–10783.
(18) Huang, C.-C.; Chiang, C.-K.; Lin, Z.-H.; Lee, K.-H.; Chang, H.-T. Anal. Chem. 2008, 80, 1497–1504.
(19) (a) Zheng, J.; Zhang, C.; Dickson, R. M. Phys. Rev. Lett. 2004, 93, 077402. (b) Zheng, J.; Nicovich, P. R.; Dickson, R. M. Annu. Rev. Phys. Chem. 2007, 58, 409–431. (c) Tran, M. L.; Zvyagin, A. V.; Plakhotnik, T. Chem. Commun. 2006, 2400–2401. (d) Shi, X.; Ganser, T. R.; Sun, K.; Balogh, L. P., Jr.
Nanotechnology2006, 17, 1072–1078. (e) Triulzi, R. C.; Micic, M.; Giordani, S.; Serry, M.; Chiou, W.-A.; LeBlanc, R. M. Chem. Commun. 2006, 5068– 5070. (f) Duan, H.; Nie, S. J. Am. Chem. Soc. 2007, 129, 2412–2413. (20) (a) Kru¨ger, D.; Fuchs, H.; Rousseau, R.; Marx, D.; Parrinello, M. J. Chem.
Phys.2001, 115, 4776–4786. (b) Konoˆpka, M.; Rousseau, R.; Sˇtich, I.; Marx, D. J. Am. Chem. Soc. 2004, 126, 12103–12111.
Figure 2. (A) UV-vis absorbance and (B) normalized fluorescence
spectra of (a) Au NPs and (b) Man-Au NDs. The fluorescence intensities are plotted in arbitrary units (au); excitation wavelength: 375 nm. In part B, the ratio of the concentrations of the Au NPs and Man-Au NDs was 240 000: 1.
Downloaded by NATIONAL TAIWAN UNIV on July 30, 2009
within the sp-conduction band, singlet (fluorescence) and triplet (phosphorescence) excited-state of the molecular-type cluster, often show the monotonic absorbance decline from 200 to 800 nm and exhibit fluorescence >650 nm.16,17 Recently, more observation of the insensitivity of luminescence wavelengths to the core sizes can explain the luminescence contributions from surface characteristics.15-17As particle size decreases, the surface to-volume ratio increases and a larger fraction of the nanoparticle core atoms becomes involved in forming bonds with the core-capping ligands. On the basis of the well-established spectral assignment for the Au(I) thiolate complexes, we infer that the absorption of Man-Au NDs at 375 nm originates from metal-centered and/or ligand-metal charge transfer (LMCT; S f Au) transitions.15In addition, our fluorescent Man-Au NDs had large Stokes-shifted fluorescence (1.03 eV) with long lifetimes (t1/t2) of 159/834 ns, which is general characteristics of thiol-Au(I) complexes that display ligand-metal charge transfer and metal(I)-metal(I) interactions.15,21Thus, we suspect that the fluorescence of our RS-Au NDs was mainly originated from Au ND/polynuclear Au(I)-thiol (core/shell) complexes.16d,22 The shell of polynuclear Au(I)-thiol suggests that the emission arises from a low-lying triplet state (phosphorescence), populated via intersystem crossing from the lowest singlet state.16dWe further compared the emission peaks of our the luminescent Man-Au NDs with those of reported monolayer-protected gold clusters.16,17The emission peak of Man-Au NDs (λ ) 545 nm) was located at an energy higher than those of the Au28(glutathione)16clusters and dodecanethiolate-protected Au38clusters (<1.5 nm).16c,17fThe blue shift in the emission maxima with the reduction of the cluster sizes is known in terms of the increase in the energy gaps between the quantized levels, d-type core electron to unfilled sp conduction orbitals (interband transitions), ascribed to the smaller core sizes as well as the higher coverage of thiolates and capped molecules like phosphine.17In contrast, the λ value for Man-Au NDs (1.8 nm) was inconsistent with those clusters, presumably due to the existence of the outermost layer of Au(I)thiolate complexes.16d,21,22 In comparison, the lifetimes for our previous prepared 11-MUA-Au NDs were 48 and 340 ns, respectively.10,18The longer lifetimes of the Man-Au NDs are consistent with their stronger fluorescence and smaller size in comparison to those of the 11-MUA-Au NDs. Because the fluorescent Man-Au NDs possess long fluorescence lifetimes, they have great potential for sensing molecules of interest using time-resolved fluorescence. From a practical point
of view, it is important to test the stability of the as-prepared Man-Au NDs solution under physiological conditions. The Man-Man-Au NDs were stable when resuspended in sodium phosphate solutions (pH 7.4) containing NaCl at the concentrations up to 1.5 M (see the Supporting Information, Figure S5). Figure S5 in the Supporting Information indicates that the fluorescence intensity of the Man-Au NDs increased upon increasing the pH from 3.0 to 11.0. Slight aggregation of the Man-Au NDs and hydrolysis of the mannose units are the main reasons for the low fluorescence intensities at low pH.
“Turn-Off” Sensor for Detection of Con A. We used the
fluorescent Man-Au NDs to test the detection of Con A, a member of the lectin family that selectively binds to R-mannopyranosyl and R-glucopyranosyl residues.23 Con A exists predominantly as a tetramer of four identical subunits (each∼26 000 Da) at neutral and alkaline pH.23We added different amounts of Con A into a sodium phosphate buffer (10 mM, pH 7.0) containing the Man-Au NDs (10 nM), MnCl2(0.1 mM), and CaCl2(0.1 mM).23dTo minimize precipitation and collisions causing fluorescence quenching, the mixed solution with various concentrations of Con A (0-50 nM) were incubated for 60 min and then centrifuged (RCF 20 000g, 20 min) prior to fluorescence measurement. In this case, the recorded fluorescence intensi-ties of the supernatants were inversely proportional to the concentrations of Con A (Figure 3A). When the concentration of Con A was greater than 25 nM, after centrifugation we observed (by the naked eye) green pellets of a Con A-Man-Au ND complex under UV lamp illumination, supporting the notion of Con A-induced aggregation of the Man-Au NDs. As a result of (21) Vogler, A.; Kunkely, H. Coord. Chem. Rev. 2001, 219-221, 489–507. (22) (a) Whetten, R. L.; Price, R. C. Science 2007, 318, 407–408. (b) Schaaff,
T. G.; Whetten, R. L. J. Phys. Chem. B 2000, 104, 2630–2641. (c) Walter, M.; Akola, J.; Lopez-Acevedo, O.; Jadzinsky, P. D.; Calero, G.; Ackerson, C. J.; Whetten, R. L.; Gro¨nbeck, H.; Ha¨kkinen, H. Proc. Natl. Acad. Sci. U.S.A.2008, 105, 9157–9162. (d) Jadzinsky, P. D.; Calero, G.; Ackerson, C. J.; Bushnell, D. A.; Kornberg, R. D. Science 2007, 318, 430–433. (e) Gro¨nbeck, H.; Walter, M.; Ha¨kkinen, H. J. Am. Chem. Soc. 2006, 128, 10268–10275. (f) Heaven, M. W.; Dass, A.; White, P. S.; Holt, K. M.; Murray, R. W. J. Am. Chem. Soc. 2008, 130, 3754–3755. (g) Akola, J.; Walter, M.; Whetten, R. L.; Ha¨kkinen, H.; Gro¨nbeck, H. J. Am. Chem. Soc. 2008, 130, 3756–3757.
(23) (a) Wang, J. L.; Cunningham, B. A.; Edelman, G. M. Proc. Natl. Acad. Sci. U.S.A.1971, 68, 1130–1134. (b) Senear, D. F.; Teller, D. C. Biochemistry 1981, 20, 3076–3083. (c) Cairo, C. W.; Gestwicki, J. E.; Kanai, M.; Kiessling, L. L. J. Am. Chem. Soc. 2002, 124, 1615–1619 (d) Mn2+and Ca2+must be
present for saccharide binding of Con A.
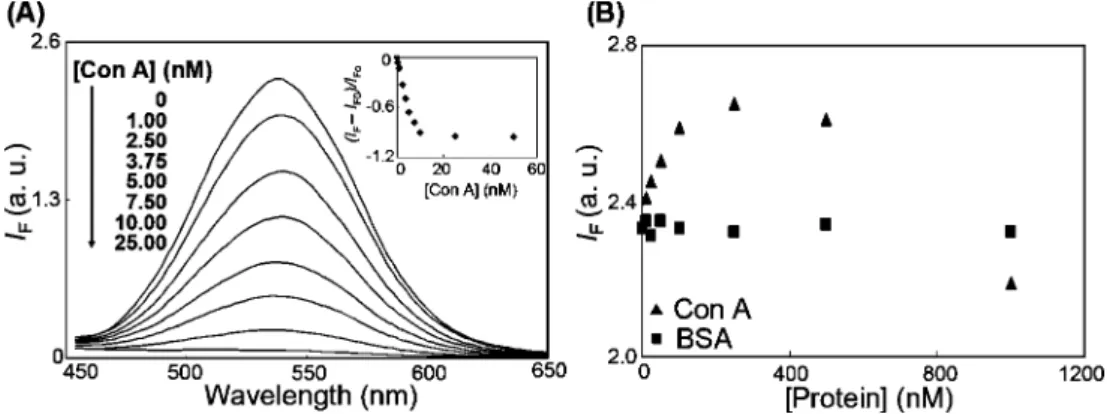
Figure 3. (A) Validation of the use of Man-Au NDs as probes for the detection of Con A. (B) Plots of the fluorescence intensity of Man-Au NDs
at 545 nm versus the concentrations Con A and BSA. Inset to part A: Plot of the relative fluorescence [(IF- IF0)/IF0] of the supernatant of the mixture of Con A/Man-Au NDs.
Downloaded by NATIONAL TAIWAN UNIV on July 30, 2009
aggregation of the Man-Au NDs, the fluorescence intensities of the supernatants decreased upon increasing the concentration of Con A. We obtained a linear relationship for [(IF - IF0)/IF0] against the concentration of Con A over the range 1.0-10.0 nM (R2) 0.95), where I
F0and IFare the fluorescence intensities of the Man-Au NDs in the absence and presence of Con A, respectively. The limit of detection (LOD) for Con A was 0.7 nM, based on a signal-to-noise ratio (S/N) of 3; which is comparable to the best reported result.24
We obtained a biphasic curve of the fluorescence intensities of the Man-Au NDs solutions at 545 nm against the concentrations of Con A over the range 0-1000 nM (Figure 3B) without centrifugation. At low Con A concentrations (<250 nM), Man-Au NDs-lectin aggregates were formed through specific interactions between the carbohydrate units and the multivalent lectins. The fluorescence intensity of the Man-Au NDs increased initially upon increasing the concentration of Con A over the range 0-250 nM. Con A minimized the interaction of the Man-Au NDs with quenchers present in solution, thereby increasing their fluores-cence.18When the concentration of Con A was sufficiently high (>250 nM) to induce a greater degree of interparticle cross-linking, precipitation occurred, resulting in a decrease in fluorescence.6cA control experiment revealed no obvious change in the fluorescence intensity of the Man-Au NDs in the presence of bovine serum albumin (BSA) (Figure 3B). Even at low Con A concentrations, however, the linearity of the fluorescence intensity of the Man-Au NDs was poor because of precipitation and collisions causing fluorescence quenching.6
Selectivity and Inhibition Assays. To test the specificity of
this assay toward Con A, we incubated aliquots of the Man-Au ND solutions (10 nM) separately with Con A, some possible interfering proteins (BSA, trypsin inhibitor, β-lactalbumin, carbonic anhydrase, catalase, lysozyme, trypsinogen, conalbumin, myoglo-bin, insulin, transferrin, and ribonuclease A), and other lectins (DBA from Dolichos biflorus, BS-I from Bandeiraea simplicifolia, MAA from Maackia amurensis, WGA from Triticum vulgaris, LcH from Lens culinaris, SNA from Sambucus nigra, ECA from
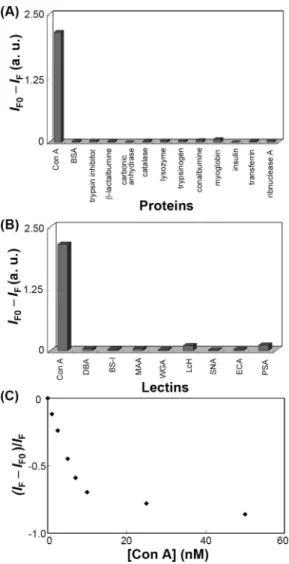
Erythrina cristagalli, and PSA from Pisum sativum). Apart from LcH and PSA, which are mannose-binding lectins, the changes in the fluorescence of the Man-Au ND solutions in the presence of the interfering proteins and the tested lectins were all negligible relative to that in the presence of Con A (parts A and B of Figure 4). Relative to LcH and PSA, Con A caused a larger fluorescence change, mainly because of its four binding sites, larger molecular weight (102 kDa), and higher binding affinity toward the Man-Au NDs. The Man-Man-Au NDs sensor allowed us to detect Con A at concentrations as low as 1.0 nM in the presence of a 10 000-fold higher concentration (i.e., 10 µM) of BSA (Figure 4C). Thus, this highly specific sensor has great potential for use in detecting Con A in complex real samples.
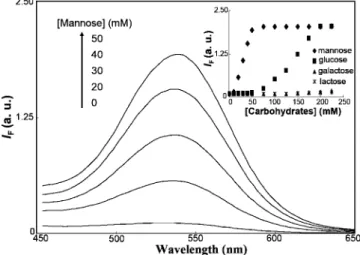
Next, we developed binding inhibition assays based on decreasing the binding efficiency between Con A (100 nM) and the Man-Au NDs (10 nM) separately in the presence of the carbohydrates mannose, glucose, galactose, and lactose (each at concentrations in the range 0-225 mM). We observed increased fluorescence of the Man-Au NDs in the supernatants when
mannose and glucose were present at 10 and 75 mM, respectively, revealing that these two carbohydrates can inhibit the Con A-induced aggregation of the Man-Au NDs (Figure 5), albeit at concentrations of 1.0×10⁶and 7.5×10⁶times, respectively, that of Man-Au NDs (10 nM). In contrast, galactose and lactose did not affect the binding of Con A to the Man-Au NDs, even when their concentrations were greater than 225 mM. The inset to Figure 5 displays the linear relationships (R2> 0.94) between the fluorescence intensity of the supernatants at 545 nm and the mannose and glucose concentrations over the ranges 10-50 and 75-200 mM, respectively. These results are consistent with previous reports that Con A has higher affinity toward mannose than toward glucose.25In addition, the multivalent mannose ligands of these Man-Au NDs have a 6-orders-of-magnitude higher affinity for Con A than do the monovalent mannose ligands.
(24) Guo, C.; Boullanger, P.; Jiang, L.; Liu, T. Biosens. Bioelectron. 2007, 22, 1830–1834.
(25) (a) Sato, K.; Anzai, J.-I. Anal. Bioanal. Chem. 2006, 384, 1297–1301. (b) Mandal, D. K.; Kishore, N.; Brewer, C. F. Biochemistry 1994, 33, 1149– 1156.
Figure 4. (A, B) Fluorescence changes of the Man-Au ND probe
toward Con A, (A) other proteins, and (B) lectins. (C) Plots of the relative fluorescence intensities [(IF- IF0)/IF0] of solutions of the Man-Au ND probe (10 nM) and Con A (0-50 nM) in the presence of 10 µM BSA. Buffer: 10 mM sodium phosphate (pH 7.0) containing 0.1 mM MnCl2 and CaCl2. Other conditions were the same as those described in Figure 3.
Downloaded by NATIONAL TAIWAN UNIV on July 30, 2009
“Turn-On” Sensor by NP-Assisted Protein Enrichment.
We employed a NP-assisted protein enrichment method to further improve the sensitivity of the Man-Au NDs toward ConA.26 Mixtures (1 mL) of Con A (0-10.0 nM) and Man-Au NDs (1.0 nM) in buffer (10 mM sodium phosphate, 0.1 mM MnCl2 and CaCl2, pH 7.0) were left at room temperature for 60 min. The samples were then centrifuged and the supernatants removed. The precipitates were resuspended in a buffer (pH 7.0, 100 µL) containing 10 mM sodium phosphate, 0.1 mM MnCl2, 0.1 mM CaCl2, and 100 mM mannose and then equilibrated for another 60 min. Figure 6 displays the fluorescence spectra of the resulting Con A solutions. Unlike the situation in Figure 3B, the sensing in
Figure 6 reveals a turn-on response: the fluorescence increases upon increasing the Con A concentration. The relationship between the signal enhancement ratio [(IF- IF0)/IF0] and the Con A concentration (inset to Figure 6) was linear from 0.1 to 1.5 nM (R2) 0.96), with the LOD (at a S/N ratio of 3) for Con A being 75 pM. Thus, the Man-Au ND-assisted Con A enrichment process provided a nearly 1 order greater sensitivity improvement relative to that in Figure 3A. To the best of our knowledge, this approach provided the lowest LOD value (75 pM) for Con A when compared to the other nanomaterials-based detecting method.5,6,24
E. coli Labeling by Fluorescent Man-Au NDs. Type 1
fimbriae present on the surface of Enterobacteriaceae, such as
E. coli, are responsible for their mannose- and mannoside-binding activities.27,28Thus, we investigated whether our Man-Au NDs had the capability of binding mannose-specific adhesin FimH of type 1 pili in E. coli and, therefore, whether they could be used to detect E. coli. Type 1 pili are filamentous proteinaceous appendages that extend from the surface of many Gram-negative organisms; they are composed of FimA, FimF, FimG, and FimH proteins.27FimA accounts for more than 98% of the pilus protein; FimH is uniquely responsible for the binding toD-mannose.28In this study, we tested an E. coli strain K12 (ATCC 25404) that expresses wild-type 1 pili. After incubation of the bacterial suspensions ((1.00×10⁶)-(2.50×10⁸) cells/mL, 1.0 mL) with the Man-Au NDs (25 nM) in phosphate-buffered saline (PBS, pH 7.4) at 25°C for 60 min, we centrifuged the suspensions at RCF 10 000g for 20 min. Incubation with E. coli (2.50× 10⁸ cells/mL) revealed that the Man-Au NDs (25 nM) bind to the bacteria, yielding brightly fluorescent cell clusters (Figure 7, inset A). The supernatant solution containing unbound Man-Au NDs was discarded, and the cells were washed twice with PBS.
E. colibacteria labeled with the Man-Au NDs fluoresced with a (26) (a) Zheng, M.; Huang, X. J. Am. Chem. Soc. 2004, 126, 12047–12054. (b)
Kong, X. L.; Huang, L. C. L.; Hsu, C.-M.; Chen, W.-H.; Han, C.-C.; Chang, H.-C. Anal. Chem. 2005, 77, 259–265. (c) Huang, Y.-F.; Chang, H.-T. Anal. Chem.2006, 78, 1485–1493. (d) Huang, C.-C.; Chiu, S.-H.; Huang, Y.-F.; Chang, H.-T. Anal. Chem. 2007, 79, 4798–4804.
(27) Soto, G. E.; Hultgren, S. J. J. Bacteriol. 1999, 181, 1059–1071. (28) (a) Harris, S. L.; Spears, P. A.; Havell, E. A.; Hamrick, T. S.; Horton, J. R.;
Orndorff, P. E. J. Bacteriol. 2001, 183, 4099–4102. (b) Krogfelt, K. A.; Bergmans, H.; Klemm, P. Infect. Immun. 1990, 58, 1995–1998.
Figure 5. Fluorescence spectra of a solution of Man-Au NDs (10
nM) and Con A (100 nM) in the presence of increasing concentrations of mannose. Inset: Plots of fluorescence intensities (545 nm) of solutions of Man-Au NDs and Con A in the presence of mannose, glucose, galactose, and lactose. Other conditions were the same as those described in Figure 4.
Figure 6. Fluorescence spectra recorded after using the Man-Au
NDs (1.0 nM) to selectively enrich the detection of Con A. Inset: Relative fluorescence [(IF- IF0)/IF0] at 545 nm of the resuspended solutions of the mixture of Man-Au NDs (1.0 nM) and Con A (0-10.0 nM). Other conditions were the same as those described in Figure 4.
Figure 7. Fluorescence spectra of Man-Au NDs (25 nM) used as
probes for the detection of E. coli ((2.50× 10⁶)-(1.00× 10⁸) cells/ mL). (Inset A): Visualization of Man-Au NDs (25 nM) in the (a) absence and (b) presence of E. coli (2.50× 10⁸ cells/mL) upon excitation (365 nm) under a hand-held UV lamp. (Inset B): Plot of fluorescence intensity (545 nm) versus E. coli concentration. Other conditions were the same as those described in Figure 4.
Downloaded by NATIONAL TAIWAN UNIV on July 30, 2009
green color. The bacteria pellets were then resuspended in PBS containing 100 mM mannose, which displaced the Man-Au NDs from the surfaces of the E. coli. After centrifugation, we measured the fluorescence of the supernatants. Figure 7 indicates that the fluorescence increased upon increasing the concentration of E.
coli. The relationship between the fluorescence signal and the E.
coliconcentration (Figure 7, inset B) was linear from 1.00×10⁶ to 5.00× 10⁷ cells/mL (R2) 0.96), with the LOD (at a S/N ratio of 3) of E. coli being 7.20 × 10⁵ cells/mL. Most conventional methods (e.g., plating and culturing, biochemical tests, microscopy, flow cytometry, luminescence) for the detection of bacteria are time-consuming to obtain the results. Although much faster detection methods are becoming avail-able (e.g., immunosensors, DNA chips), they have failed to gain wide acceptance because of the high user expertise required, the high cost of labeling reagents, and the low stability of antibodies and DNA recognition elements. Recently, silica-coated magnetic NPs after being conjugated with man-nose have been demonstrated easily for detection of Con A and E. coli with a high capture efficiency of 65% in just 5 min.2b However, Con A and E. coli need to be labeled with fluorescein and PicoGeen dye, respectively. In addition, our fluorescent Man-Au NDs are easily prepared than that of the bioconjugated silica-coated magnetic NPs.
CONCLUSION
We have devised a novel, simple, and convenient method for the preparation of water-soluble biofunctional Au NDs for the detection of lectin. Our fluorescent Man-Au NDs are easily purified
and are capable of sensing, under optimal conditions, Con A with high sensitivity (LOD ) 75 pM) and remarkable selectivity over other proteins and lectins. Furthermore, we have also developed a new method for fluorescence detection of bacteria using these water-soluble Man-Au NDs. Incubation with E. coli revealed that the Man-Au NDs bind to the bacteria, yielding brightly fluorescent cell clusters. This aggregation is due to the multivalent interactions between the mannosylated Au NDs and mannose receptors located on the bacterial pili. In contrast to standard methods for pathogen detection, which require up to 2 days for analysis, our fluorescent carbohydrate-functionalized Au NDs allow of the presence of E. coli to be detected in as little as 3 h. To the best of our knowledge, this paper provides the first example of the use of fluorescent Au NDs for the sensing both lectins and bacteria.
ACKNOWLEDGMENT
This study was supported by the National Science Council of Taiwan under Contracts NSC 95-2113-M-002-026-MY3, NSC 97-2627-M-002-010, and NSC 97-2627-M-002-011.
SUPPORTING INFORMATION AVAILABLE
Additional information as noted in text. This material is available free of charge via the Internet at http://pubs.acs.org.
Received for review May 26, 2008. Accepted December 1, 2008.
AC8010654
Downloaded by NATIONAL TAIWAN UNIV on July 30, 2009