行政院國家科學委員會專題研究計畫 成果報告
1990 年代美國銀行業壞帳沖銷動機及市場解讀
計畫類別: 個別型計畫 計畫編號: NSC91-2416-H-002-028- 執行期間: 91 年 08 月 01 日至 92 年 07 月 31 日 執行單位: 國立臺灣大學會計學系暨研究所 計畫主持人: 劉啟群 報告類型: 精簡報告 處理方式: 本計畫可公開查詢中 華 民 國 92 年 12 月 22 日
Income Smoothing over the Business Cycle:
Changes in Banks’ Coordinated Management of Provisions for Loan Losses and Loan Charge-offs from the Pre-1990 Bust to the 1990s Boom
Chi-Chun Liu, National Taiwan University
We thank Bruce Bettinghaus for helping us access the regulatory data for commercial bank holding companies and Anwer Ahmed, Dan Gode, Jim Ohlson, Jim Wahlen, and accounting seminar participants at New York University for useful comments.
ABSTRACT: We provide evidence that banks smooth income by managing provisions for loan losses and loan charge-offs in a coordinated fashion that varies across the bust and boom phases of the business cycle and across homogeneous and heterogeneous loan types. In particular, during the 1990s boom, we predict and find that banks accelerated provisioning for loan losses and made this less obvious by accelerating loan charge-offs, especially for homogenous loans for which charge-offs are determined using number-of-days-past-due rules. We also provide
evidence that the valuation implications of banks’ provisions for loan losses and loan charge-offs vary across the phases of the business cycle and loan types reflecting the effect of these factors on banks’ income smoothing. In particular, during the 1990s boom, we predict and find that charge-offs of homogenous loans have a positive association with current returns and future cash flows, because these charge-offs are recorded primarily by healthy banks with good future prospects reducing over-stated allowances for loan losses. We also predict and find that these charge-offs have a positive association with future returns that is explained by their positive association with future net income and recoveries. Our results are consistent with the market only partially appreciating healthy banks’ overstatement of charge-offs of homogeneous loans based on number-of-days-past-due rules during the 1990s boom, because of the perceived non-discretionary nature of these charge-offs.
Keywords: Income smoothing; business cycle; banks; provisions for loan losses; loan charge-offs.
I. INTRODUCTION
We investigate how commercial banks’ coordinated management of provisions for loan losses and loan charge-offs changed from their period of poor health and ultimately crisis (bust) from about 1974-1990 to their period of robust health (boom) throughout the 1990s. A
considerable body of prior research finds that banks delayed provisioning for loan losses and, as a consequence, charging off loans during the bust period up to 1990.1 In contrast, we predict and find that during our sample period 1991-2000, which includes the entire 1990s boom, banks accelerated provisioning for loan losses and made this less obvious by accelerating charge-offs, which led to a high level of recoveries. Strikingly, we find that loan charge-offs – a variable that does not directly affect income and that prior research typically treats as a non-discretionary control variable – played a central role in banks’ income smoothing during the 1990s boom.2
This finding exemplifies the phenomenon postulated and observed by Barton and Simko (2002) that income management can be constrained by the magnitude of balance sheet accounts. Our analysis differs from theirs in three important ways, however. First, Barton and Simko use net operating assets as a proxy for the constraint over total accruals for a broad sample of firms. In contrast, for a sample of firms in a single industry (banking), we identify a particular balance sheet account (the allowance for loan losses) that constrains the management of a particular income statement line item (the provision for loan losses). This contextual focus increases the specificity of our hypotheses and interpretability of our results. Second, Barton and Simko show that firms with overstated net assets have less ability to increase income, while we show that
1
For example, see Beaver et al. (1989), Elliott, Hanna, and Shaw (1991), Griffin and Wallach (1991), Wahlen (1994), Liu and Ryan (1995), and Beaver and Engel (1996).
2 While not directly related to this paper, Moyer (1990), Beatty, Chamberlain, and Magliolo (1995), and Collins,
Shackelford, and Wahlen (1995) make hypotheses about and generally find evidence of the management of regulatory capital using net loan charge-offs. Loan charge-offs reduce regulatory capital to the extent that the allowance for loan losses is included in regulatory capital. The allowance for loan losses was included in primary
banks that accelerate charge-offs loans to reduce overstated allowances for loan losses have more ability to decrease income. Third, we show that banks use loan charge-offs to manage the
allowance for loan losses, thereby exploiting a perceived constraint on the management of the provision for loan losses to make their income smoothing opaque. The second and third differences illustrate Defond’s (2002) conjecture that the balance sheet can also facilitate earnings management.
As in Liu and Ryan (1995), we exploit differences across types of loans in how
provisions for loan losses and charge-offs are determined under generally accepted accounting principles. For heterogeneous loan types, such as commercial loans, provisions for loan losses and charge-offs typically are determined with judgment on a loan-by-loan basis. For
homogenous loan types, such as consumer loans, provisions for loan losses (charge-offs)
typically are determined using statistical methods at the portfolio level (number-of-days-past-due rules). Liu and Ryan show that banks delayed provisions for loan losses primarily for
heterogeneous loans during the bust period up to 1990. In contrast, we predict and find that banks accelerated loan charge-offs primarily for homogeneous loans during the 1990s boom. While numbers-of-days-past-due rules might appear to reduce discretion over loan charge-offs, this turns out not to be the case in good times, for two reasons. First, these rules interact with economic conditions, yielding charge-offs that are reversed with much higher probability in good times than bad times. Second, for reasons discussed in Section II, until June 1999 and to lesser extent thereafter, different banks chose to use very different number-of-days-past-due cutoffs and individual banks periodically changed the cutoffs they used.3
3
The possibility of accelerated loan charge-offs is consistent with McNichols and Wilson’s (1988) statement that as “receivables turnover decline (for example, in banking), mechanical rules are more difficult to specify, leaving greater room for discretion over write-offs.” This possibility also likely reflects the Tax Reform Act of 1986
We predict and find that the valuation implications of provisions for loan losses and loan charge-offs vary across the bust and boom phases of the banking industry business cycle and across homogeneous and heterogeneous loan types reflecting the effect of these factors on banks’ income smoothing. Most strikingly, we predict and find that charge-offs of homogenous loans have a positive association with current 12-month returns and future cash flows during the 1990s boom, because these charge-offs are recorded primarily by healthy banks with good future prospects reducing over-stated allowances for loan losses rather than by banks recognizing loan default. In this sense, loan charge-offs signal desirable bank attributes. We also predict and find that these charge-offs have a positive association with future returns that is explained by their positive association with future net income and recoveries. Our results are consistent with the market only partially appreciating healthy banks’ overstatement of charge-offs of homogeneous loans during the 1990s boom.
We also explain Ahmed, Takeda, and Thomas’ (1999) finding that valuation implications of banks’ provisions for loan losses changed from positive to negative around 1990. Our
explanation is based on Liu and Ryan (1995) and Liu, Ryan, and Wahlen’s (1997) arguments and evidence that provisions for loan losses are good news only for banks that meet two conditions. (1) Their provisions for loan losses are untimely relative to other sources of information about loan default, so that the provisions convey little bad news. (2) They appear to be “at risk” to loan losses, so that a signal conveying good news about their future prospects or management of troubled loans has a sufficiently large effect on market perceptions. We predict and find that neither of these conditions holds during the 1990s.
changing the timing of tax deductions for loan losses from that of provisioning for loan losses to that of charging off
While focusing on banks’ accounting for loan losses, our paper contributes to two broadly important areas of financial accounting research. First, it contributes to research demonstrating the contextual nature of the valuation implications of accruals. Our results illustrate how these implications depend on an industry’s health and on firm attributes such as loan portfolio composition. Our results also illustrate the importance of jointly analyzing the entire set of financial reporting information, including disclosures such as loan charge-offs that have no direct effect on bottom-line financial statement numbers.
Second, our paper contributes to research investigating firms’ use of discretion to smooth income, and whether such smoothing signals their quality (e.g., Ronen and Sadan 1981,
Subramanyam 1996, and DeFond and Park 1997). As discussed by Dechow and Skinner (2000), a debate remains in this literature and especially between academics and practitioners as to whether, when, and how income smoothing occurs, as well as the valuation implications of such behavior. In our view, one of the primary reasons for the lack of resolution of this debate is that the nature and implications of income smoothing are more complex then they seem. In particular, while income smoothing has a symmetric quality – income is lowered in good times and raised in bad times – firms may not be able or choose to exercise discretion in a symmetric fashion due to contextual constraints on that behavior.
The remainder of this paper is organized as follows. Section II develops our hypotheses based on the rules and practices governing the accounting for loan losses and prior research. Section III describes the sample and reports descriptive statistics. Section IV reports the
empirical results regarding the changing timeliness of provisions for loan losses and loan charge-offs. Section V reports the empirical results regarding the changing valuation implications of provisions for loan losses and loan charge-offs. Section VI concludes.
II. HYPOTHESIS DEVELOPMENT Accounting for and Disclosures of Loan Losses
Under FAS 5 (1975), Accounting for Contingencies, and related practice, when credit losses on a loan or portfolio of homogeneous loans are probable and can be reasonably estimated, an expense called the provision for loan losses and a contra-asset (to loans outstanding) called the allowance for loan losses should be recorded. When a specific loan is deemed uncollectible, that loan should be charged off, which involves reducing both loans outstanding and the
allowance for loan losses by the uncollectible amount. Charged-off loans may turn out to be collectible, in which case the charge-offs are reversed, called recoveries. Loan charge-offs do not directly affect total assets, net loans outstanding, owners’ equity, or net income, although they do affect loans outstanding and the allowance for loan losses. Net loan charge-offs equal gross loan charge-offs less recoveries. Recoveries typically result from the bank receiving some amount of cash from previously delinquent accounts.
Liu and Ryan (1995) emphasize that in practice provisions for loan losses are calculated differently across types of loans. For homogenous (e.g., consumer) loans, these provisions are determined primarily on a statistical basis at the portfolio level. For heterogeneous (e.g., commercial) loans, these provisions are determined primarily on a judgmental basis at the individual-loan level. During the bust period up to 1990, banks often used judgment to delay provisions for loan losses, and so the discipline of statistics yielded timelier and less
discretionary provisions; hence, Liu and Ryan refer to homogeneous loans as “timely” and heterogeneous loans as “untimely”. We do not use their terminology in this paper because we
expect discretionary acceleration of provisions and charge-offs of homogeneous loans during our sample period, which renders the good connotation of “timely” problematic.
We extend Liu and Ryan’s (1995) distinction of loan types to loan charge-offs, which typically are made using number-of-days-past-due rules for homogeneous loans and with judgment on a loan-by-loan basis for heterogeneous loans. While the use of such rules may suggest that less discretion is applied to loan charge-offs for homogeneous than heterogeneous loans, this turns out not to be true when banks desire to accelerate charge-offs in good times, for two reasons. First, these rules interact with economic conditions, yielding charge-offs that are recovered with much higher probability in good than bad times. Second, and more importantly, at least until June 1999, different banks used very different number-of-days-past-due cutoffs and individual banks periodically changed their cutoffs.
To curb diversity in charge-off practices, in February 1999, the Federal Financial Institutions Examination Council (FFIEC, a cooperative group of the main bank regulators) revised guidance for charge-offs of consumer loans that had been in place since 1980, stating that this “guidance had been interpreted and applied inconsistently.”4 As of June 1999, the FFIEC requires credit card and other open-end consumer loans to be charged off no later than 180 days past due and closed-end consumer (e.g., auto) loans to be charged off no later than 120 days past due. In justifying these rule changes, the FFIEC states that previous “[c]harge-off practices ranged from 120 to 240 days” past due, and that “a number of institutions were not following existing policy guidance for charging off open-end accounts based on past due status.” The new rules do not entirely eliminate differences in charge-off practices across banks, however, because
4
See the FFIEC’s February 10, 1999 press release (at www.ffiec.gov) and its rules published in the Federal Register on the same day listed in the references. These rules also apply to loan classifications (though not charge-offs per se) for residential mortgages.
they allow banks to adopt a “policy more conservative than the one detailed.” For example, SunTrust Banks continues to charge off closed-end consumer loans at 90 (not 120) days past due, despite consistently recovering these charge-offs at about a 40% rate. In our assessment,
supported by evidence discussed in Section IV, at least up to June 1999 and perhaps even thereafter, banks have considerably more ability to accelerate charge-offs for homogeneous than heterogeneous loans. The same does not hold for delaying charge-offs, however.
Prior Research
Prior research focuses on the valuation implications of allowances and provisions for loan losses (hereafter loan loss expense accruals), with net loan charge-offs included in the empirical models primarily as a control variable. Specifically, a large number of papers analyzing samples primarily from some portion of the bust period up to 19905 find that banks’ market value, share returns, and future cash flows are associated positively with their loan loss expense accruals, controlling for non-performing loans or assets6 and net loan charge-offs. These papers conjecture and provide evidence that a bank recording loan loss expense has positive valuation implications during this period, because this act signals good news about either the bank’s future prospects or its ongoing management of troubled loans.
5 For example, Beaver et al.’s (1989) sample includes annual data from 1979-1983, Wahlen’s (1994) sample
includes annual data from 1977-1988 and quarterly data from 4Q:1984-3Q:1989, Liu and Ryan (1995) and Liu, Ryan, and Wahlen’s (1997) sample includes quarterly data from 4Q:1983-2Q:1991, and Beaver and Engel (1996) sample includes annual data from 1977-1991. Elliott, Hanna, and Shaw (1991) and Griffin and Wallach (1991) examine banks’ 1987 provisions for loan losses for less-developed country debt.
6 Under Securities and Exchange Commission Industry Guide 3, the definition of non-performing loans is currently
the total book value of three classes of loans: (1) non-accrual loans (loans not accruing interest, which usually is loans more than 90 days past due that are not sufficiently well collateralized), (2) past due loans (loans that are accrual but have not met the contractual terms of one or more required payments), and (3) restructured troubled debt (loans that have been restructured because of the borrower’s impaired financial condition). Non-performing assets
Refining this finding, Liu and Ryan (1995) hypothesize that for loan loss expense accruals to be good news, these accruals must not convey bad news about loan default on a timely basis relative to other sources of information, since otherwise the bad news would dominate their valuation implications. Exploiting differences in the way provisions for loan losses are calculated across types of loans discussed in Section II, over a sample period from 4Q:1983-2Q:1991, Liu and Ryan predict and find that these provisions convey timely news about loan default for banks that hold an above-median level of homogeneous loans (hereafter homogeneous banks), but untimely news about loan default for banks that hold an above-median level of heterogeneous loans (hereafter heterogeneous banks). Reflecting this differential
timeliness, Liu and Ryan predict and find that provisions for loan loss are good news for heterogeneous banks but bad news for homogeneous banks.
Continuing this refinement, Liu, Ryan, and Wahlen (1997) hypothesize that for loan loss expense accruals to be good news, banks must also be “at risk” to loan losses. They use below-median regulatory capital to proxy for a bank being “at risk” to loan losses, because low regulatory capital tends to be associated with both high past loan losses and significant
consequences to future loans losses. Over the same sample period as Liu and Ryan (1995), Liu, Ryan, and Wahlen find that provisions for loan losses are good news only for “at risk” banks.
Liu and Ryan (1995) and Liu, Ryan, and Wahlen’s (1997) findings together imply that a relatively small number of heterogeneous and “at risk” banks drive prior findings of good news associated with loan loss expense accruals during the bust period up to 1990. We expect that the dramatic improvement in banks’ health during the early 1990s eliminated most or all of these observations, so that loan loss expense accruals are bad news in the 1990s.
Consistent with this expectation, Ahmed, Takeda, and Thomas (1999) find that provisions for loan losses are bad news for current returns and future cash flows for a sample covering the period 1987-1995, a period that includes significant portions of both the bust and boom periods. One of the purposes of this paper is to explain why the valuation implications of banks’ loan loss expense accruals have changed over time.
Ahmed, Takeda, and Thomas (1999) also find that the valuation implications of loan offs have changed over time. Specifically, while prior papers all find that loan charge-offs convey bad news for stock price and returns and future cash flows, Ahmed, Takeda, and Thomas find that loan charge-offs have no association with current returns and a positive
association with future cash flows, controlling for loan loss expense accruals and non-performing loans. The primary purpose of this paper is to explain this change.
Hypotheses
The most likely explanation for these changes in the valuation implications of loan loss expense accruals and loan charge-offs is that banks’ health improved sharply in the early 1990s and remained good throughout the remainder of that decade, and as a result banks accelerated rather than delayed loan loss expense accruals and loan charge-offs to smooth income. In Section III, we provide descriptive statistics that indicate that banks’ health improved substantially over this period. Providing evidence of the untimeliness of provisions for loan losses during the bust period up to 1990, Liu and Ryan (1995) find that for banks with above median heterogeneous loans during the 1985-1990 period, 27 percent of the variation in annual provisions for loan loss is explained by the current and three lagged annual changes in non-performing assets. This
finding understates the untimeliness of provisions for loan losses during this period, since the third lagged change in non-performing assets remains highly significant.
Reflecting this discussion, we test two hypotheses about the acceleration of loan loss provisions and loan charge-offs during the 1990s boom. First, because banks exhibited good health during most of the 1990s, we hypothesize that provisions for loan losses are much timelier relative to non-performing assets during the 1990s than in the prior period examined by Liu and Ryan (1995), especially for the heterogeneous banks for which they found provisions for loan losses to be particularly untimely.
Second, we hypothesize that during the 1990s banks overstated loan charge-offs to keep their allowances for loan losses from ballooning, in order to avoid scrutiny by the SEC, auditors, bank regulators, and possibly the market. For example, the SEC clearly believed by no later than 1997 that banks were over-reserved for loan losses, because in November of that year it very publicly required SunTrust Banks – a bank with a high level of gross charge-offs (especially of homogeneous consumer loans) that it recovered at a rate of close to 40 percent from 1993-1997 – to reduce its allowance for loan losses by $100 million. The public nature of this requirement was clearly intended as a signal to all banks either to justify or reduce their allowances for loan losses.7 We hypothesize that banks that were over-reserved for loan losses were more likely to overstate loan charge-offs, and that this overstatement was more feasible for homogeneous loans for which charge-offs are determined using number-of-days-past-due rules.
We test three sets of hypotheses about the valuation implications of loan loss provisions and loan charge-offs during the 1990s boom. These tests are conducted by estimating multiple regression equation coefficients that reflect the partial correlations of our test variables with
current or future 12-month returns or cash flows. We emphasize that observed partial
correlations do not imply causality, and that information about banks’ loan default or prospects can be conveyed to the market in any number of ways not controlled for in our regression
equations. As in prior research, we do control for the other primary sources of information about banks’ loan default contained in their financial reports, however, and so the observed partial correlations do indicate the information conveyed by the test variables incremental to those other sources of information. In our experience, the organized conduct of financial analysis requires evaluating incremental information in this sense.
First, reflecting the timeliness of provisions for loan losses during the 1990s boom, we hypothesize that provisions for loan losses have a negative association with current returns and future cash flows for both homogeneous and heterogeneous banks during this period. This hypothesis is consistent with Ahmed, Takeda, and Thomas’ (1999) results for their somewhat earlier sample period.
In developing the next hypothesis about the valuation implications of loan charge-offs, we emphasize that charge-offs necessarily follow provisions for loan losses large enough so that the allowance for loan losses remains adequate. In the extreme case in which a charge-off would make the allowance for loan losses (or a defined portion of it dedicated to a subset of the loan portfolio) negative, the charge-off yields a “mechanical” provision for loan losses. To the extent that provisions for loan losses are temporally prior or mechanically linked to loan charge-offs, these charge-offs inherently convey information that is incremental to that conveyed by
provisions. As a result, banks’ discretionary behavior regarding provisions for loan losses largely determines the incremental information that can be conveyed by loan charge-offs. For example, in the bust period up to 1990, banks’ deferral of provisions for loan losses reduced their
usefulness as an indicator of loan default, and so loan charge-offs primarily provide incremental information about loan default.
Second, we hypothesize that net loan charge-offs for homogeneous loans have a positive association with current returns and future cash flows during the 1990s boom. We expect banks’ provisions for loan losses during this period reflect expected loan default plus an additional discretionary overstatement, and that loan charge-offs primarily provide incremental information about this overstatement. We expect that healthier banks with better future prospects are likely to have larger discretionary overstatements. In this sense, larger loan charge-offs signal more desirable bank attributes. In addition, since banks that desire to accelerate loan charge-offs have more ability to do so for homogeneous loans, we expect that charge-offs for these loans are more likely to be good news.
Third, we hypothesize that there is a positive drift in returns subsequent to net loan charge-offs for homogeneous loans because overstatement of these loan charge-offs is relatively opaque to investors, for three reasons. First, net loan charge-offs do not directly affect assets or equity on the balance sheet or any number on the income statement. Second, investors likely perceive homogenous loan charge-offs based on number-of-days-past-due rules as largely non-discretionary. Third, banks disclose these variables only for the combined portfolio of loans initiated in the current and all prior years, which obscures inter-temporal manipulations, especially for growing banks. This hypothesis differs from Beaver and McNichols’ (2001) finding that the market reacts fully to PC insurers’ claim loss reserve revisions. Compared to banks’ loan charge-offs and recoveries, PC insurers’ loss reserve revisions are much more transparent; these revisions affect liabilities, owners’ equity, and net income, and they are disclosed by year of business written.
III. SAMPLE AND DESCRIPTIVE STATISTICS
The sample covers the period from 1991-2000. The number of commercial bank holding companies in the sample rises from 122 in 1991 to 304 in 2000, peaking at 329 in 1999. Since the sample does not include the bust period up to 1990, we compare our results to those of prior studies to make inferences about changes over time in the management and valuation
implications of provisions for loan losses and loan charge-offs. While this is not optimal, we view it as preferable to attempting to construct a sample of banks that includes the bust period for the following reasons. First, the Bank Compustat dataset discussed below does not include non-surviving banks, and so yields a highly selected sample in the bust period. Second, the bank regulatory data discussed below becomes available only in 1986, and its definitions of variables change at the beginning of our sample period in significant ways. In particular, the data by type of loan discussed below became available in its current form either at the end of 1990 or in the first quarter of 1991. Third, there are non-trivial problems matching banks over a longer period given the volume of merger and acquisitions activity in the banking industry.
We obtain data from three sources. Bank financial report data primarily are obtained from commercial bank holding companies’ regulatory Y9-C reports, which are available on the
Federal Reserve Bank of Chicago’s website. From these reports, we obtain the following data by type of loan: loans outstanding, gross and net loan charge-offs, recoveries, and non-performing assets. Types of loans are described below. We also obtain the allowance for loan losses, the provision for loan losses, net income, total assets, and owners’ equity from these reports.
From the annual Bank Compustat tape, we obtain shares outstanding and closing share prices to calculate end-of-fiscal-year market values. We also obtain Tier 1 risk-based capital
ratios from 1993-2000 from this source, since these ratios are only available beginning in 1997 in the Y9-C reports. Since Tier 1 risk-based capital ratios are not available prior to 1993 on Bank Compustat, in those years we proxy for it using equity divided by assets. While this is not optimal, we only use a dichotomous regulatory capital variable in the empirical analyses, and the use of this proxy has minimal effects on our results in 1993-2000. Thus, its use is unlikely to affect our results in 1991-1992, though we cannot test this.
We obtain monthly bank and value-weighted market index returns from CRSP. Since all banks have December 31 fiscal year ends, to ensure that returns include earnings announcement effects, we measure market-adjusted returns (bank minus value-weighted market return) over the 12-month period from April 1 through March 31. Since our CRSP data ends in December 2000, analyses involving current (next year’s) returns use data from 1990 to 1999 (1998).
Similar to Liu and Ryan (1995), in homogeneous loans, we include consumer loans, 1-4 family residential mortgages, loans to financial institutions, and acceptances of other banks. In heterogeneous loans, we include commercial and industrial loans, direct lease financing, all other real estate loans, agriculture loans, and foreign loans.8 In the analyses of provisions for loan losses, which are not disclosed by type of loan, banks are sorted each year into homogeneous (heterogeneous) bank sub-samples based on holding above median homogeneous (heterogeneous) loans. This crude partitioning is not necessary in the analyses of loan charge-offs and recoveries, however, since they are disclosed by type of loan.
8 Liu and Ryan (1995) use more aggregated data on loans outstanding by type from Bank Compustat to calculate
homogeneous and heterogeneous loans. The main difference between our classification scheme and that in Liu and Ryan is our more descriptive classification of 1-4 family residential mortgages as homogeneous, whereas Liu and Ryan are constrained to classify all real estate loans in a single category, which they choose to be heterogeneous. This classification difference has a small effect on the results in this paper.
We use all available observations for each analysis subject to two deletion rules. First, to ensure consistency of our data sources, we delete any observation for which the difference of total assets or loans outstanding on the Y9-C and Bank Compustat is greater than 10% of the Bank Compustat value. The main reason for differences in the two datasets is bank holding companies may be defined at a different level for Bank Compustat than for the Y-9C reports. There are also relatively slight differences in GAAP and regulatory accounting principles. To minimize the effect of extreme observations, observations of each variable in the outside 0.5 percent of each tail of its distribution each year are deleted. Our results are not sensitive to deletion or winsorization rules as long as extreme observations are deleted or pulled in.
Table 1 reports descriptive statistics for the bank-year observations that appear in at least one of our analyses. The number of observations varies slightly across variables depending on their availability and the availability of the other variables in the specific analyses in which they appear. Panel A contains the means and quartiles for the variables appearing in any subsequent analysis as well as a few additional descriptive variables for the entire sample period. Panel B contains medians of these variables for the odd years in the sample period. Panel C contains Pearson correlations of these variables for the entire sample period.
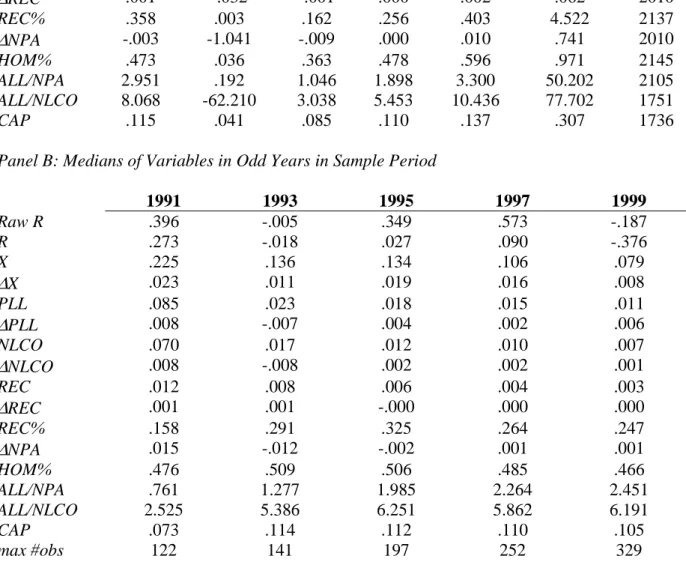
Of most interest are the trends in the medians of the variables from 1991 to 1995 (a year similar to 1994) reported in Panel B. The downward trends for the provision for loan losses, PLL, and net loan charge-offs, NLCO, both deflated by beginning price, indicate that loan losses
dropped by about 80% over this period. The upward trends for the ratios of the allowance for loan losses, ALL, to non-performing assets, NPA, and NLCO indicate that loss reserve adequacy improved by about 150% over this period. The upward trend for ratio of recoveries to gross loan charge-offs (the recovery rate), REC%, indicates that the recovery rate doubled over this period,
rising to a level of 32.5% in 1995 that is difficult to reconcile with charged-off loans being “deemed uncollectible.” These statistics reflect the fact that by no later than 1994 banks were experiencing minimal levels of loan losses but were far better reserved for loan losses than in the early 1990s. In our assessment, on average banks were significantly over-reserved for loan losses from the end of 1993 through mid 2000.
The downward trend for income before the provision for loan losses,9 X, deflated by beginning price, is misleading as an indicator of the trend in bank profitability, since banks’ price-to-earnings ratios rose dramatically during this period as interest rates fell and for other reasons. More representative of banks’ improving health, Bassett and Zakrajsek (2001) report the average book return on equity for all U.S. chartered commercial banks doubled from .078 in 1991 to .146 in 1994, and profitability stayed at that level throughout the remainder of the 1990s. The upward trend for the Tier 1 risk-based capital ratio, CAP, is correct but overstated, because as discussed above the ratio of book equity to book assets proxies for this variable in 1991. Bassett and Zakrajsek provide a figure indicating that the average Tier 1 risk-based capital ratio for all U.S. chartered commercial banks rose approximately 30% from .081 in 1991 to .106 in 1994, and Panel B indicates that banks stayed well capitalized through 2000. These statistics illustrate a highly profitable and well-capitalized banking industry by no later than 1994 that persists through 2000.
The correlations in Panel C indicate that the (change in the) provision for loan losses and (the change in) net loan charge-offs are highly correlated. While these correlations do not pose problems in our pooled estimations, they preclude reliable year-by-year estimations of the
9 For simplicity, we use earnings before the pretax provision for loan losses throughout the paper. We tested the
sensitivity of our results to using earnings before .6 times the provision for loan losses, and found no significant differences in the conclusions from our tests (the coefficients on the provision for loan losses are algebraically affected, of course).
equations that include both of these variables as explanatory variables, especially in the early years in our sample period that have about one-third the observations of the later years.
In the regression analyses in the following sections, unless stated otherwise we say a coefficient is significant if differs from zero at a 5 percent level or better in a two-tailed test. White’s (1980) heteroskedasticity-adjusted t statistics are reported throughout.
IV. THE ACCELERATION OF PROVISIONS FOR LOAN LOSSES AND LOAN CHARGE-OFFS DURING THE 1990S BOOM Provisions for Loan Losses
In this section, we test the hypothesis that provisions for loan losses are much timelier relative to non-performing assets during the 1990s boom than in the bust period examined by Liu and Ryan (1995), especially for the heterogeneous banks for which they found provisions for loan losses to be particularly untimely. Liu and Ryan assess the timeliness of provisions for loan losses relative to non-performing assets,10 the best available relatively non-discretionary measure of loan portfolio quality. Specifically, for homogeneous and heterogeneous bank sub-samples over the period 1985-1990, they regress the provision for loan losses on the current and three annual lagged changes in non-performing assets, with all variables deflated by four-year lagged price11 . 3 3 2 2 1 1 0 t t t t t
t NPA NPA NPA NPA
PLL =η+θ ∆ +θ ∆ − +θ ∆ − +θ ∆ − +ε (1)
10 Liu and Ryan (1995) use non-performing loans as the SEC defined this variable during their sample period, which
included other real estate owned. Under the current SEC definition, other real estate owned is part of
non-performing assets. Hence, though the name has changed, we use the same variable definition as in Liu and Ryan and so refer to them as using non-performing assets.
For the heterogeneous bank sub-sample, Liu and Ryan (1995) report that that the R2 is 27 percent and all of the changes in non-performing assets are highly significant (e.g., the
coefficient on the furthest lagged change in non-performing assets θ3 is .244 with a t statistic of 6.0), consistent with provisions for loan losses being relatively untimely information about loan losses for heterogeneous loans. In contrast, for the homogeneous bank sub-sample, they report that the R2 is only 5 percent and only the current and first lagged change in non-performing loans are significant, consistent with provisions for loan losses being relatively timely information about loan losses for homogeneous loans.
To determine whether and how the timeliness of provisions for loan losses has changed over time, we re-estimate equation (1) over the 1991-2000 period for banks grouped in the same fashion and compare the results to those of Liu and Ryan (1995). Table 2 reports these
estimations. The results for both sub-samples are similar to those in Liu and Ryan for the homogeneous banks sub-sample; the R2s are both 5 percent and only the coefficient θ0 on the current change in non-performing assets in the homogeneous bank sub-sample is significant at the 5 percent level in a one-tailed test. Thus, the provision for loan losses is much timelier for the heterogeneous banks sub-sample in the 1990s boom than it was in prior bust period, because banks were at least adequately reserved for these loans due to their robust health during this period. Liu and Ryan’s arguments and evidence thus imply that the valuation implications of all provisions for loan losses should be negative in the 1990s boom for both sub-samples of banks.
Loan Charge-offs
In this section, we test a set of hypotheses regarding how healthier banks overstated loan charge-offs to keep their overstated allowances for loan losses from ballooning during the 1990s
boom. Since overstated loan charge-offs lead to recoveries, we use the recovery rate as our measure of the excessiveness of those charge-offs.12 We predict that the recovery rate is higher for banks with allowances for loan losses that are higher than normal given non-discretionary measures of loan default. We also predict that the recovery rate is higher for homogeneous loans for which loan charge-offs are determined using number-of-days-past-due rules.
To determine whether the allowance for loan losses is higher than normal, in annual cross-sections we regress the allowance for loan losses on the balances of homogeneous and heterogeneous loans, net loan charge-offs for homogeneous and heterogeneous loans, and non-performing assets for homogeneous and heterogeneous loans, with all variables deflated by loans outstanding. As discussed by Ryan (2002), net loan charge-offs and non-performing assets are the two main relatively non-discretionary benchmarks for the allowance for loan losses used in financial analysis, and these benchmarks apply differently for homogeneous and heterogeneous loans. An indicator variable Ihighall takes a value of one if an observation has a positive residual in this regression that year and zero otherwise.
In this analysis, we include two controls for (changes in) banks’ economic exposure to loan losses, which could affect their recovery rates. First, we include an indicator variable Ihighcap that takes a value of 1 if the bank has an above median Tier 1 risk-based capital ratio that year and zero otherwise. We include this measure of regulatory capital primarily because Liu, Ryan, and Wahlen (1997) use it as a proxy for whether banks are “at risk” to loan losses. Another reason is that Moyer (1990), Beatty, Chamberlain, and Magliolo (1995), and Collins,
12 We are able to demonstrate excessive loan charge-offs by healthy banks during the 1990s in various alternative
ways (e.g., by a rising ratio of net loan charge-offs to non-performing assets). We chose the recovery rate as our dependent variable because it links charge-offs with recoveries; this leads naturally into the analysis in Section V, which shows that return drift following loan charge-offs is explained in part by their association with future
Shackelford, and Wahlen (1995) predict and generally find that loan charge-offs are used for regulatory capital management. We do not expect loan charge-offs to be managed to raise Tier 2 capital after the first couple of years in our sample period, however, because virtually all banks are well capitalized by no later than 1994. Second, we also include current and three lagged changes in performing assets, because this variable is the best available relatively non-discretionary measure of loan losses.
Reflecting the discussion above, we regress the recovery rate on the percentage of
homogeneous loans in the loan portfolio, HOM%, Ihighall, Ihighcap, and the current and three lagged annual changes in non-performing assets deflated by loans outstanding four years prior
. % % 3 0 e NPA f dI cI HOM b a REC s s t s highcap highall
∑
= − + ∆ + + + + = (2)We expect the coefficient b on HOM% to be positive, since it is easier to accelerate loan charge-offs for homogeneous loans. We expect the coefficients on the indicator variables to vary across time, as discussed below.
We estimate equation (2) over three sub-periods to illustrate changes in banks’ discretionary behavior over time: (1) 1991-1992, a recession period that should have some similarities with the 1980s; (2) 1993-1998, an unambiguous boom period; and (3) 1999-2000, a still boom period but with some indications of (the potential for) rising loan losses beginning to appear. The primary reason we separate 1999-2000 from the prior period is that the FFIEC rules regarding charge-offs of consumer loans became effective in June 1999. Since banks generally were not over-reserved for loan losses until the second sub-period, we expect the coefficient c on Ihighall to be more positive in the second and third sub-periods than in the first sub-period. Since
only in the first sub-period were a meaningful number of banks not well capitalized, we expect the coefficient d on Ihighcap to be positive only in that sub-period.
Table 3 reports the estimation of equation (2) both for the overall sample and for the three sub-periods. Note that the intercept rises dramatically over time, reflecting the trend in the
recovery percentage discussed in Section III. As expected, the coefficient b on HOM% is always positive but is very large and only significant in the first sub-period, primarily because recoveries for heterogeneous loans were very low in that period. This coefficient is significantly positive at the 10% level in a one-tailed test in the other sub-periods, however. The coefficient c on Ihighall is significantly positive in all periods, and it rises through time, consistent with banks that are better reserved for loan losses increasingly experiencing higher recovery rates. As expected, the
coefficient d on Ihighcap is significantly positive only in the first sub-period in which some banks were poorly capitalized and so had the incentive to delay loan charge-offs to raise Tier 2 capital. The coefficients f on ∆NPAt-s, 0≤s≤3, while frequently significant, change sign in a fashion that suggests no clear pattern between economic loan losses and recovery rates.
In summary, banks experienced sharply increasing recovery rates during the early 1990s, consistent with banks increasingly charging off loans too quickly. Superimposed on this overall trend, recovery rates were higher for banks with more homogeneous loans throughout the 1990s. As the 1990s progress, recovery rates rose more strongly for better-reserved banks and were less explained by regulatory capital. These results are all consistent with loan charge-offs being substantially determined by discretionary reporting behavior during the 1990s boom.
V. THE VALUATION IMPLICATIONS OF PROVISIONS FOR LOAN LOSSES AND LOAN CHARGE-OFFS DURING THE 1990S BOOM
In this section, we test our hypotheses regarding how the implications of provisions for loan losses and loan charge-off for current returns, future cash flows, and future returns depend on how banks’ income smoothing behavior varies across the bust vs. boom phases of the business cycle and homogeneous vs. heterogeneous loan types. Because we can observe loan charge offs and recoveries but not provisions for loan losses by loan type, we conduct this analysis in two distinct ways. Our primary analyses distinguish loan charge-offs and recoveries by loan type. We also conduct cruder analyses distinguishing provision for loan losses for homogenous and heterogeneous banks.
Current Returns Analysis
Distinguishing Net Loan Charge-offs by Loan Type
In this section, we test our hypothesis that net loan charge-offs for homogenous loans have positive implications for current returns during the 1990s boom. We regress market-adjusted returns from April 1 during the fiscal year to March 31 following the fiscal year end (hereafter current returns), R, on the change in earnings before the provision for loan losses, the change in the provision for loan losses, the change in net loan charge-offs for homogeneous and heterogeneous loans – NLCO(HOM) and NLCO(HET), respectively – and the change in non-performing assets during the year, with all explanatory variables deflated by price on April 1 of year t13
13 The main difference between equation (3) and those estimated in Liu and Ryan (1995) and Ahmed, Takeda, and
Thomas (1999) is that the earnings before the provision for loan losses, provision for loan losses, and net loan charge-off variables are all in first differenced, not levels, form. We specify equation (3) in this way because, unlike during the 1980s, we find that first differenced variables have more explanatory power over returns in the 1990s, likely due to these variables’ greater persistence in the later period.
. ) ( ) ( t U t t t T t t
t X PLL NLCO HOM NLCO HET NPA
R =α+β∆ +γ∆ +δ ∆ +δ ∆ +ς∆ +ε (3)
Studies prior to Ahmed, Takeda, and Thomas (1999) invariably find that net loan charge-offs have significantly negative implications for current returns. In contrast, Ahmed, Takeda, and Thomas find that net loan charge-offs have no implications for current returns in their later sample period from 1987-1995. As discussed above, we expect net loan charge-offs for homogeneous loans to have a positive association with returns.
Table 4 reports the estimation of equation (3). As expected, the coefficient δT on NLCO(HOM) is significantly positive, consistent with loan charge-offs for homogeneous loans being good news. In contrast, the coefficient δU on NLCO(HET) is insignificantly negative. These results imply that it is important to distinguish loan charge-offs for homogeneous and heterogeneous loans in our sample period, and they suggest that Ahmed, Takeda, and Thomas’ (1999) finding that loan charge-offs have no implications for returns reflects a weighted-average of the valuation implications of charge-offs of homogeneous and heterogeneous loans.
Distinguishing Provisions for Loan Losses by Bank Type
In this section, we test our hypothesis that provisions for loan losses for both
homogenous and heterogeneous banks have negative implications for current returns during the 1990s boom. Similar to Liu and Ryan (1995), to assess whether the implications of provisions for loan losses for returns vary across banks based on the types of loans they hold, we estimate a modified version of equation (3) that allows the coefficient on the provision for loan losses to
differ for the homogeneous and heterogeneous bank sub-samples, with the indicator variable IHOM denoting the homogeneous bank sub-sample14
. * HOM t t t t HOM t t t X PLL PLL I NLCO NPA R =α +β∆ +γ∆ +γ ∆ +δ∆ +ς∆ +ε (3’)
Liu and Ryan (1995) find that the coefficient γ on the provision for loan losses variable is significantly positive for their full sample over the 4Q:1983-2Q:1991, but that this result is attributable only to the heterogeneous bank sub-sample. In contrast, Ahmed, Takeda, and Thomas (1999) find that this coefficient is significantly negative over 1987-1995 for both sub-samples. Reflecting the timeliness of provisions for loan losses for heterogeneous banks in our sample period, we expect Ahmed, Takeda, and Thomas’ finding of negative coefficients for both sub-samples of banks to remain in our sample period.
Table 5 reports the estimation of equation (3’). Consistent with Ahmed, Takeda, and Thomas (1999), for the overall sample we find that the coefficient γ on the provision for loan losses is significantly negative for both samples and insignificantly different across the sub-samples. Thus, provisions for loan losses have negative implications for current returns in the 1990s boom. While this aspect of our results differs from those of Liu and Ryan (1995), they also find relatively timely provisions for loan losses to be bad news.
Future Cash Flows Analysis
Following Wahlen (1994), Liu, Ryan, and Wahlen (1997), and Ahmed, Takeda, and Thomas (1999), as an alternative to the current returns analysis, in this section we assess the
14
We do not include intercept dummies to capture mean effects when slope dummies are included in regressions in this paper; such intercept dummies are invariably insignificant and have no noticeable effect on any aspect of the estimations.
association of provisions for loan losses and loan charge-offs with future cash flows. Since the provision for loan losses is the main accrual estimate for banks, as in these prior studies we measure cash flows as earnings before the provision for loan losses.
Distinguishing Net Loan Charge-offs by Loan Type
In this section, we test our hypothesis that net loan charge-offs for homogenous loans have positive implications for future cash flows. To assess the implications of net loan charge-offs for future cash flows, we regress each of the next three years’ earnings before the provision for loan losses on the current year’s earnings before the provision for loan losses, the provision for loan losses, net loan charge-offs for homogeneous and heterogeneous loans, and the change in non-performing assets, with all variables deflated by market value at the beginning of the current year15 . 3 1 for , ) ( ) ( ≤ ≤ + ∆ + + + + + = + s e NPA f HET NLCO d HOM NLCO d cPLL bX a Xt s t t T t U t t t (4)
While Wahlen (1994) and Liu, Ryan, and Wahlen (1997) find that net loan charge-offs have significantly negative implications for future cash flows, Ahmed, Takeda, and Thomas (1999) find the opposite in their later sample period 1987-1995, consistent with our hypothesis that loan charge-offs become good news in the early 1990s. Reflecting our prior discussion and results for the current returns analysis, we expect net loan charge-offs for homogeneous loans to have a positive association with future cash flows in our sample period.
15 Equation (4) is similar to one estimated by Liu, Ryan, and Wahlen (1997), but differs somewhat from those in
Wahlen (1997) and Ahmed, Takeda, and Thomas (1998), who use changes in earnings before the provision for loan losses variables and measures of the unexpected provision for loan losses, net loan charge-offs, and change in non-performing loans. As discussed below, we find similar results regardless of which equation we estimate, and so we
Table 6 reports the estimation of equation (4). As expected, the coefficient dT on NLCO(HOM) is significantly positive at all horizons s from 1 to 3, consistent with loan charge-offs for homogeneous loans being good news. In contrast, the coefficient dU on NLCO(HET) is insignificant at all three horizons. Again, these results imply it is important to distinguish loan charge-offs for homogeneous and heterogeneous loans in our sample period, and they suggest that Ahmed, Takeda, and Thomas’ (1999) finding that loan charge-offs have positive
implications for future cash flows is driven by charge-offs of homogeneous loans.
Distinguishing Provisions for Loan Losses by Bank Type
In this section, we test our hypothesis that provisions for loan losses for both
homogenous and heterogeneous banks have negative implications for future cash flows during the 1990s boom. Again similar to Liu and Ryan (1995), to assess whether the implications of provisions for loan losses for future cash flows vary across banks based on the types of loans they hold, we estimate a modified version of equation (4) that allows the coefficient on the provision for loan losses to differ for the homogeneous and heterogeneous bank sub-samples.
. 3 1 for , * ≤ ≤ + ∆ + + + + + = + s e NPA f dNLCO I PLL c cPLL bX a Xt s t t HOM t HOM t t t (4’)
Wahlen (1994) for the 1977-1988 period and Liu, Ryan, and Wahlen (1997) for the 1Q:1984-4Q:1989 period find that the coefficient c on the provision for loan losses is significantly positive, while Ahmed, Takeda, and Thomas (1999) find that this coefficient is significantly negative in the 1987-1995 period. We again expect Ahmed, Takeda, and Thomas’ finding of negative coefficients for both sub-samples of banks to remain in our sample period.
Table 7 reports the estimation of equation (4’). Inconsistent with our hypothesis and the results of Ahmed, Takeda, and Thomas (1999) and our prior returns analysis, the coefficient c on
the provision for loan losses is insignificant at all horizons s from 1 to 3 for both sub-samples of banks, implying that provisions for loan losses have no implications for future cash flows during the 1990s.
We conjecture that the main explanation for this difference in the results in the current returns and future cash flow analyses is that during the 1990s provisions for loan losses conveyed (or possibly just were thought by the market to convey) some relatively timely information about loan losses that was reflected in returns, but that these provisions also contained considerable noise about the cash flows in any given future period because of excessive reserving for loan losses. This conjecture also explains why we find the coefficient f on the change in non-performing assets in equations (4) and (4’) to be much more negative and significant than do Ahmed, Takeda, and Thomas (1999), consistent with the change in
non-performing assets containing less noise about future cash flows than the provision for loan losses. Given that macro-economic conditions were remarkably and unexpectedly robust during the 1990s, it is possible that the market interpreted provisions for loan losses to be worse news than they turned out to be, however, so that the cash flow analysis better reflects the actual valuation implications of provisions for loan losses. This possibility is diminished by a specification test discussed below, in which we observe no drift in returns in the year subsequent year to
provisions for loan losses.
Future Returns Analysis
In this section, we test our hypothesis that net loan charge-offs for homogeneous loans are associated with a positive drift in future returns. We also investigate whether these charge-offs’ association with future earnings and recoveries explains any drift we observe. To determine
whether a drift exists, we first estimate a regression of one-year-ahead market-adjusted returns on the change in earnings before the provision for loan losses, the change in the provision for loan losses, the change in net loan charge-offs for homogeneous and heterogeneous loans, the change in non-performing assets during the year. To explain the drift that we observe, we then estimate expanded regression equations that include the one-year-ahead change in earnings before the provision for loan losses and/or the one-year ahead recoveries for homogeneous and heterogeneous loans, denoted REC(HOM) and REC(HET), respectively. All explanatory variables are deflated by price on April 1 of year t. The most expanded equation is
. ) ( ) ( ) ( ) ( 1 1 1 1 1 t t U t T t t t U t T t t t HET REC HOM REC X NPA HET NLCO HOM NLCO PLL X R ε φ φ β ς δ δ γ β α + ∆ + ∆ + ∆ + ∆ + ∆ + ∆ + ∆ + ∆ + = + + + + + (5)
A positive coefficient δT on NLCO(HOM) in the restricted equation implies a positive return drift subsequent to loan charge-offs for homogeneous loans. If δT becomes less positive (zero) as future net income and recoveries are included in the expanded equations, then the drift is partly (fully) explained by the association of these variables with NLCO(HOM).
Table 8 reports the estimation of equation (5). In the most restricted equation, the
coefficient δT on NLCO(HOM) is significantly positive, consistent with a return drift subsequent to net loan charge-offs for homogeneous loans. The coefficient β on ∆Xt is also significantly positive, perhaps because banks’ profitability was unexpectedly persistent throughout the 1990s boom, and because repeated profitability has positive valuation implications, as documented by Barth, Elliott, and Finn (1999). No other slope coefficients in the restricted model are significant.
As next year’s change in recoveries and especially change in net income are included in the equation the coefficient δT on NLCO(HOM) becomes less positive, and it is insignificant in
the most expanded equation. Thus the return drift associated with net loan charge-offs for homogeneous loans is explained fully by their association with future net income and recoveries. Interestingly, the return drift subsequent to the change in earnings is strengthened significantly by the inclusion of next year’s change in net income, perhaps because inclusion of this variable captures the effect of repeated profitability.
We emphasize that these tests of future returns should not be viewed as contributing to the return anomalies literature, because of the selected time period and industry investigated. In particular, we do not expect positive return drift subsequent to loan charge-offs in the current credit riskier, less well reserved banking environment.
Summary and Specification Tests
The results in this section imply that the valuation implications of provisions for loan losses and loan charge-offs differ across the bust and boom phases of the banking industry business cycle and across homogeneous and heterogeneous loan types, reflecting the effect of these factors on banks’ income smoothing. In particular, healthy banks’ acceleration of loan offs for homogeneous loans during the 1990s led to the unusual situation of these charge-offs being positively associated with both current returns and future cash flows. Moreover, investors incompletely appreciated this manipulation, so that these charge-offs are associated with a drift in future returns that is explained by their association with future net income and recoveries.
In addition, we find that the provision for loan losses conveys either bad or no news about loan losses during the 1990s. Thus, our results are more consistent with those of Ahmed, Takeda, and Thomas (1999) than with research prior to that study. In particular, unlike Wahlen
(1994), Liu and Ryan (1995), and Liu, Ryan, and Wahlen (1997), in no analysis or sub-sample do we observe that provisions for loan losses convey good news.
We conducted five specification tests, none of which change the basic character of our results regarding the valuation implications of provisions for loan losses and loan charge-offs. First, we specified the explanatory variables in equations (3)-(5) in both levels and first differences forms and also using Wahlen’s (1994) expectations models; deviations in the specifications from those in the reported results generally weaken the results in the returns analysis slightly and have minimal effect on the results in the future cash flow analysis. We also measured returns unadjusted, industry adjusted, and size adjusted, with little effect on our results.
Second, we included firm and year (industry) effects; firm effects have little effect on either the returns or future cash flow analyses, but year effects typically reduce the coefficient (t statistic) by about half (one-third) in the returns analysis, consistent with the banking industry exhibiting correlated discretionary behavior in given years. Our reported results do not include year effects, because we are interested in discretionary reporting behavior at both the banking industry and individual bank levels.
Third, banks merged with considerable frequency over this period, and so we deleted observations for which a bank’s loans grew more than 10% in any quarter of a given year (about 5% of our observations), which slightly weakens but does not change the character of our results.
Fourth, we replicated all our analyses distinguishing the valuation implications of the change in net loan charge-offs and recoveries for banks with above- and below-normal
allowances for loan losses as reflected in Ihighall indicator variable described earlier. We find that banks with above-normal allowances for loan losses drive the positive implications of loan charge-offs for homogeneous loans for future cash flows and future returns, but not current
returns, consistent with over-reserved banks accelerating loan charge-offs and this discretionary behavior not being appreciated fully by investors.
Finally, as an indication of the efficiency of the market reaction to provisions for loan losses, we used one-year ahead market-adjusted returns as the dependent variable in equation (3’) and obtained an insignificant coefficient γ on the provision for loan losses for both sub-samples of banks, consistent with the market reacting in an unbiased fashion to provisions for loan losses.
VI. CONCLUSION
In this paper, we illustrate the complex and contextual nature of income smoothing in the setting of banks’ provisions for loan losses and loan charge-offs. Specifically, we show that while banks manage provisions for loan losses to smooth income, their exercise of discretion is constrained by whether they hold homogeneous or heterogeneous loans, and that these
constraints bind differently in the bust and boom phases of the banking industry business cycle. During boom periods, banks have more ability to accelerate provisions and charge-offs for homogeneous loans, while during bust periods they have more ability to delay provisions and charge-offs for heterogeneous loans. By comparing and reconciling the results for our sample period of 1991-2000 to those of prior research, we show that banks’ exercise of discretion given these constraints has substantial effects on the valuation implications of provisions for loan losses and loan charge-offs.
We also find that the market does not react fully to banks’ income smoothing behavior during the 1990s boom, documenting a return drift subsequent to charge-offs of homogeneous loans that is explained by the association of these charge-offs with future net income and recoveries. We hypothesize that this drift occurs because of the perceived non-discretionary
nature of charge-offs based on number-of-days-past-due rules. As discussed by Dechow and Skinner (2000), earnings management is inherently more problematic when it is opaque.
These results bear on the recent policy debate about rules versus principles-based accounting standards. While rules-based standards are often thought to yield less discretionary accounting, our results suggest that a rules-based accounting policy that appears particularly non-discretionary – the use of number-of-days-past-due rules to determine charge-offs of
homogenous loans – leads to more discretion in certain contexts.
Relatedly, our results suggest that Barton and Simko’s (2002) arguments and evidence that income management can be constrained by the magnitude of balance sheet needs to be probed in specific contexts by future research. While the balance sheet surely influences the conduct and evaluation of income management, whether the balance sheet imposes real or perceived constraints appears to depend on the context. In particular, we provide an example of a context in which a perceived constraint facilitates income smoothing.
TABLE 1 Descriptive Statistics
Full Sample 1991-2000 Panel A: Means and Quartiles of Variables
mean minimum 25% median 75% maximum #obs
Raw R .153 -.520 -.117 .138 .387 .939 1734 R -.065 -.721 -.301 -.073 .138 .752 1734 X .124 -.206 .079 .105 .141 .705 2010 ∆X .016 -.476 .003 .012 .026 .583 1976 PLL .039 -.012 .008 .017 .033 1.041 2010 ∆PLL -.002 -.853 -.003 .001 .007 .389 1976 NLCO .033 -.012 .005 .011 .026 1.027 2010 ∆NLCO -.001 -.624 -.003 .001 .006 .415 2010 REC .009 .000 .002 .004 .009 .176 2021 ∆REC .001 -.032 -.001 .000 .002 .062 2010 REC% .358 .003 .162 .256 .403 4.522 2137 ∆NPA -.003 -1.041 -.009 .000 .010 .741 2010 HOM% .473 .036 .363 .478 .596 .971 2145 ALL/NPA 2.951 .192 1.046 1.898 3.300 50.202 2105 ALL/NLCO 8.068 -62.210 3.038 5.453 10.436 77.702 1751 CAP .115 .041 .085 .110 .137 .307 1736
Panel B: Medians of Variables in Odd Years in Sample Period
1991 1993 1995 1997 1999 Raw R .396 -.005 .349 .573 -.187 R .273 -.018 .027 .090 -.376 X .225 .136 .134 .106 .079 ∆X .023 .011 .019 .016 .008 PLL .085 .023 .018 .015 .011 ∆PLL .008 -.007 .004 .002 .006 NLCO .070 .017 .012 .010 .007 ∆NLCO .008 -.008 .002 .002 .001 REC .012 .008 .006 .004 .003 ∆REC .001 .001 -.000 .000 .000 REC% .158 .291 .325 .264 .247 ∆NPA .015 -.012 -.002 .001 .001 HOM% .476 .509 .506 .485 .466 ALL/NPA .761 1.277 1.985 2.264 2.451 ALL/NLCO 2.525 5.386 6.251 5.862 6.191 CAP .073 .114 .112 .110 .105 max #obs 122 141 197 252 329
TABLE 1 (continued)
Panel C: Pearson Correlations of Variables
(2) (3) (4) (5) (6) (7) (8) (9) (10) (11) (12) (13) (14) (15) (16) Raw R (1) .92 .38 .21 .14 .00 .13 .02 .16 -.01 .01 -.02 -.03 -.04 -.06 -.05 R (2) .48 .20 .20 -.05 .19 -.04 .23 .03 .01 -.06 -.03 -.09 -.06 -.09 X (3) .48 .68 .05 .66 .02 .55 .14 -.11 -.02 -.08 -.18 -.13 -.13 ∆X (4) .20 .31 .21 .17 .16 -.11 -.05 .17 -.05 -.04 -.07 -.02 PLL (5) .26 .89 .28 .47 .27 -.22 .12 -.12 -.14 -.18 -.14 ∆PLL (6) .04 .69 -.27 -.24 -.09 .51 -.01 .04 -.02 -.02 NLCO (7) .23 .61 .26 -.23 -.09 -.10 -.16 -.20 -.11 ∆NLCO (8) -.24 -.15 -.18 .37 -.02 .02 -.03 -.01 REC (9) .43 .14 -.29 -.08 -.13 -.18 -.05 ∆REC (10) .11 -.18 -.01 -.05 -.13 -.02 REC% (11) -.04 -.04 .10 -.04 .04 ∆NPA (12) .00 -.00 .02 -.05 HOM% (13) .00 .13 -.05 ALL/NPA (14) .18 .06 ALL/NLCO (15) .73 CAP (16)
TABLE 1 (continued)
The full sample includes all observations of any variable included in any subsequent analysis. Observations in the outside .5 percent of either tail of the distribution of any variable in a given analysis or for which total assets or loans outstanding on the regulatory Y9-C reports differs from the value on Bank Compustat by more than 10% are deleted.
Variable definitions:
Raw R= raw returns over the 12-month period from April 1 during the reporting year through March 31 following the reporting year (available only through 1999). R = value-weighted market-adjusted returns over the 12-month period from April 1 during the reporting year through March 31 following the reporting year (available only through 1999).
X (∆X) = (change in) net income before the provision for loan losses beginning of year price.
PLL (∆PLL) = (change in) provision for loan losses divided by beginning of year price. NLCO (∆NLCO) = (change in) net loan charge offs divided by beginning of year price. REC = recoveries divided by beginning of year price.
REC% = recoveries divided by gross loan charge-offs.
∆NPA = change in non-performing assets divided by beginning of year price.
HOM% = percentage of total loans outstanding that are homogenous loans (consumer loans, 1-4
family residential mortgages, loans to financial institutions, or acceptances of other banks). ALL/NPA = allowance for loan losses divided by non-performing assets.
ALL/NLCO = allowance for loan losses divided by net loan charge-offs. CAP = Tier 1 risk-based capital ratio.
max #obs=the maximum number of observations of any variable in a given year (which typically exceeds the minimum number of observations of any variable in that year by 10-20%).