Chiao Da Management Review Vol. 29 No. 1, 2009
pp.41-78
台灣股市投資人交易動態效果之分析
The Dynamic Analysis of Investors'
Tr
ading in The
Taiwan Stock Market
蕭朝興1 Chao-Shin Chiao
國立采摹大學 財務金融學~
Dep訂個lentofFinance, National Dong Hwa University
王子泊 Zi-Mei Wang
銘傳大學 財務金融學~
Dep訂伽lentof Finance, Ming Chuan Universi可 黃常和 Chang-Ho Huang
國立東華大學 國際經濟學系
Graduate Institution ofIntemational Economic, National Dong Hwa University
摘要:本文檢測三大法人、個別投資人對於臺灣 50 交易行為與股票報酬的每 日與日內關條,發現三大法人(個別投資人)每日淨買賣超與當日股票報酬之 間具有強烈的正(負)中目闕,同時也有追逐動能(反向交易)的傾向。進一步利 用逐筆委託資料來探討這正相關的可能原因,發現法人沒有預測日內短期報 酬能力,雖然法人會正向追隨過去日內報酬變化,但相較之下,法人交易產 生的價格壓力才是主要因素;同時,當個別投資人與法人同步且大搞買賣超 時,才能對股價產生較大的街擊。 關鍵字:法人;個別投資人;可市價化限績單;委託不均衡比率
Abstract: This paper examines the daily and intraday relationship between stock retum and the trading of institutional and individual investors on the TSEC 50 securities. First
,
the contemporaneous relation between stock retum and the trade imbalance by institutions (individuals) at the daily level is strongly positive (negative) and institutions (individuals) tend to be trend-chasing (contrarian).1 Corresponding author: Department ofFinance, National Dong Hwa Universi旬" Hualien Ci紗,
42 The Dynamic Analysis 01 Investors' Trading in the Taiwan Stock Market
Second, applying intraday order data, this paper finds that the observed positive
contemporaneous relation is largely driven by the price pressure from institutional
trading. Third, no consistent evidence supports that institutional order imbalance
predicts future stock returns. Finally, the stock prices wi11 move more when the
trading direction of individuals is consistent with that of institutions.
Keywords: Institutional investor; Individual investor; Marketable limit order;
Order imbalance
1.
Introduction
Since the early 1980s, the Ministry of Finance of Taiwan has made efforts
to globalize its stock market, widely dominated by individual investors (Harrison,
1994)
,
in order to enhance its efficiency. After two decades,
its institutionalizationand globalization achievements have been recognized. For instance, up to 37.1 %
of dollar trading volume in the Taiwan stock market is attributable to 甘ades by
profi巴ssionalinstitutional investors 企om2002/9 to 2004/12, 的 drawnin Figure 1 Figure 1
Percents ofTotal Dollar Trading Volume 50 ~食一一一-FIs ] 40 30 20 10
This figure draws Ihe proportion of dollar trading volwne by each group of inslitutional inveslors from 2月'/20021031112/2004, for a lolal of580 trading days. FIs, MFs, and SDs stand for foreign inveslors, mutual funds, and securities dealers, respectively. Sample averages of FIs, M訟,個d SDs 缸e23.53%, 7.91%, and 5.66%, respectively
Chiα'0 Da Management Revi,凹陷1. 29 No. 1. 2009 43
Con仕的ted with a mere 3% in 1989 (Schwartz and Shapiro
,
1991),
institutional trading has increased fast over recent years. Given the growing
importance of institutional 討ading, it would be instructive and even profitable to
understand the relation between institutional trading pa出msand stock retums
Recent studies document that institutional investors not only tend to herd
(Wermers, 1999; S恤, Chen, and Huang, 2005), but also follow past price
movements (Grinbla缸,Titman, and Werm帥, 1995; Lee et 祉,2006). Additionally,
the contemporaneous relation between changes in institutional ownership and
stock retum is stronger than the trend chasing effect (Nofsinger and Si的, 1999).
Employing the limit-order data for the Taiwan Stock Exchange (TSE), a purely
order-driven market, this paper aims to explain 也e posltJve contemporaneous
relation between changes in institutional ownership and stock retums found in previous studies and examine the relative importance among possible causes. We also analyze the roles of the trading behaviors of institutional and individual
investors 扭曲eshort-run (daily and intraday) price movements
According to the literature, one possibility resulting in the positive
contemporaneous relation be趴reeninstitutional trading activities and stock retums
is that institutional investors successfully forecast retums (Wermers, 1999; Choe,
Kho, and Stulz, 2005; Yu and L剖, 1999). Another possibility is about the
institutional positive-feedback tendency (Grinbla說, Titman, and Wermers, 1995;
Lin and 1\缸, 2002) and/or the concurrent price pressure (French and Roll, 1986;
Lee et a1., 2004; Chakrav訂旬, 2001). Dueωthe lack of high frequency dat
a,
theprevious literature mainly uses quarterly ownership data to compute the changes
in institutional holdings. For exampl巴, in order to examine the relation between
changes in institutional ownership and stock retum, Nofsinger and Sias (1999) use
annual institutional holdings on the NYSE stocks, while Sias, Starks, and Titman
(2001), Boyer and Zheng (2004) and C訓, Kaul, and Zheng (2000) employ the
qu訂teriyinstitutional ownership.
Even with intraday data, Griffin, Harris, and Topaloglu (hereafter GHT,
2003) still cannot identi
fY
the types of investors, such as institutional or individualinvestors. As the authors are obliged to estimate both sides of all trades as
44 The Dynamic Analysis olIn間的悶 ,Trading in the Taiwan Stock Market
some measurement errors. In contrast, our data recording all orders submitted to the TSE can unambiguously classify each limit order into one of five groups,
including foreign investors, mutual fun品, securities dealers, individual investors, and corporate institutions.2 Due ωdifferent investor compositions and market microstructures, the conclusions 企'om other developed markets may not entirely be applied to the Taiwan stock market. Therefore
,
this paper may provide investors with not only a broader view of a fast emerging market but also a potentially profitable application. To our knowledge, there is no empirical study related to this issue for 也eTaiwan stock market.Furthermore, from the angle of order submission behaviors, our conclusions help us gain a better understanding of the relation between the short-run price movements and the trading behaviors of investors. To distinguish investors' trading behaviors and jntentions, we calculate the imbalanc巳 of orders seeking
3
immediacy for the TSEC 50 stocks. J Specifically, we pay attention to the
“
marketable" limit orders, defined by Ch帥, Wang, and Lai (2007), in the likelihood that private information is encapsulated in such orders (Lee et al., 2004).4 The observed relations are expected to clarify the timing ability and thes甘engthwith which institutional and individual investors move stock prices. As a result,位rst, the contemporaneous relation between stock retum and
個de imbalance by institutions (individuals) at the da句 level is s仕ongly positive (negative) and institutions (individuals) tend to be trend-chasing (con個rian).
Second, applying a vector auto-regressions (V AR) analysis, this paper shows the persistence of institutional and individual trading, but institutional trading cannot
2 Mutual 恤血, formally called securities inv由加ent trust companies,缸e solely composed of
domestic mu阻al-fund fim阻,while foreign investors cover a wide variety of foreign institutions, including 自orei伊 (inves加ent)banks, insur閉目 companies,mutual fu帥, penSlon 伽ds,hedge funds, and so on.τùe corporate institutions consist of all domestic institutional investors 0由訂 出an the domestic professional institutional investors, such as mutual funds 阻d securities dealers
3 We choose the TSEC 50 because they are the most liquid and actively traded stocks on the TSE,
consistent with institutional investors' preference (Gompers and Metricks, 2001; Choe, Kho, and
sωIz, 1999). The TSEC 50 stocks are the most highly capitalized blue chip stocks representing around 70% of the market and the correlation between TSEC 50 阻dTSE index is above 98%, indicating that our results are representative.
Chiao Da Managem帥tReview Vol. 29 No. 1, 2009 45
predict future daily retums τbird, the intraday analyses still find no consistent
evidence that the institutional order imbalances predict future 30-minite retums.
Although the institutional trading positively follows past intraday returns, the
positive contemporaneous relation is largely driven by the price pressure 企om
concurrent institutional trading. F our血,the stock prices will move more when th巳
trading direction of individuals is consistent with that of institutions
,
implying thatindividual inv的tors play a deterministic role in the observed price behaviors.
Finally, we find that the information content of daily institutional 甘ade
imbalances lasts only for a short period, indicating that their 仕ading has limited
contribution to the process of incorporating information into stock prices.
This remaining paper proceeds as follows. Section 2 briefly reviews the related literature. Section 3 reports our datasets and summary statistics. Section 4
discusses the empirical results. Finally, we conclude this paper in Section 5
2. Literature Review
There is a growing body of literature on 甘le relation between 甘ading
pattems of institutional and individual investors and stock retums. Many existing studies document that institutional investors tend to engage in momentum
investing (also recognized as trend chasing or positive-feedback 甘ading) (e.g.,
DeLong et al., 1990; Froot, Scharfstein, and Stein, 1992; Hong and Stein, 1999;
Scharfstein and Stein, 1990; C剖, Kaul, and ZI隨時, 2000). Lakonishok, Shleif1仗,
and Vishny (1992) find only weak evidence supporting momentum trading and
herding for pension funds. Grinbla仗, Titman, and Wermers (l995) observe that
77% of mutual funds in the US are momentum traders and Choe, Kho, and Stulz
(1999) find strong evidence of trend chasing by foreign investors in Korea. As to
empirical studi巴s on the TSE, most studies document that institutional investors
positively follow past stock retums (e.g., Chen, Sh戶, and Wang, 2002; Lin and
Ma, 2002; Lee et al., 2006).
The studies on the trading behavior of individual investors find evidence of
the contrarian investment tendency. Barber and Odean (2002) document that
46 The Dynamic Analysis olInvestors' Trading in the Taiwan Stock Market
Odean (1998) finds that individl叫 1師estors are reluctant to realize their loss and
selling the past winners, which is so called disposition effect. Similarly, Hsu and
Lin (2005) find evidence sustaining the disposition effect of individual trading on the TSE. Grinblatt and Keloharju (2000) find that Finnish individual investors are
contrarian investors, while foreigners tend to be momentum investors.
Additionally, recent studies document a strong positive cross-sectional
relation between changes in institutional ownership and returns. For example,
Wermers (1999) find positive contemporaneous relation between quarterly
institutional trading and stock returns in the US. Chiao, Cheng, and Shao (2006)
argue that daily institutional trade imbalances are positively associated with the concurrent stock returns on the TSE. One possibility is related to the presumption that institutions are able to forecast returns. If institutional investors are better
informed, the stocks that institutions buy are expected to outperform those that
they sell (Chen, Jegade帥, and Werme悶,2000; Yu and Lai, 1999).
The second possibility is that institutional trading activities can move stock
prices (French and Roll, 1986; Barclay, Litzenberger, and Warner, 1990;
Chakrava旬', 2001;S帥,Starks, and Titman, 2001). For instance, Lee et al. (2004) find that institutional order imbalances are persistent due to herding and order splitting exerts greater impacts on stock prices. Another possibility is about the
positive-feedback trading (Grinblatt, Ti加an,and Werm帥, 1995). If, for instance,
the price impact of institutional buying is offset by the price impact of
non-institutional selling, then changes in institutional ownership are still
correlated with same period returns if the institutional investors follow a
short-term positive-feedback trading strategy (DeLong et al., 1990; GHT, 2003;
Lee et al., 2006).
3. Data
3.1
Data SourceThis paper employs two datasets to gather all required information. The
first dataset, maintained by the Taiwan Economic Journal, comprises the daily
Chiao Da Management Revi~ Vol. 29 No. 1, 2009 47
aIl listed individual stocks. In addition, this dataset provides in仕aday bid and ask
quotes information of each listed stock.
前le second dataset
,
obtained from the TSE,
contains the intradayinformation on every originallimit orders and 仕泌的 throughthe FuIly Automated
Securiti的 Trading σAST) system. Explicitly, for each order (trade), our sample
includes the time stamp to the nearest one hundredth second
,
stock code,
investorty阱, a buy-sell indicator, order (trade) si蜀, and limit (trade) price. Odd-lot and
bulk orders, separately drafted by the FAST, are excluded from our sample. The
corporate institutions are not professional investors and eliminated in the
following analyses. Therefore, the institutional investors in this paper only include
foreign investors, mutual fun品, and securities dealers. Our data cover 企om
2/912002 to 12/3112004, for a total of 580 tt'ading days. 3.2 Descriptive Statistics
Table 1 reports the descriptive statistics on trades and limit orders by each
investor group for the TSEC 50 stocks. The daily number of trades and 甘ading
volume are recorded in Panel A. First, individual investors are certainly main
participants. In terms of the average number of trades and trading volume, theirs
r缸1ks first and foreign investors' ranks second. For instance, the number of buy
trades and volume by individual investors are respectively 180,173 and 932,824
and account for 82.588% and 75.766% oftotal buy 仕泌的 andvolume. Those by
foreign investors respectively account for 13.338% and 17.239%.
Second, as reported in Panel B,位le pa位em of the number of limit orders
submitted by each type of investors is similar to that of trades. However, the order
size by iùdividuals is the smallest (7.98 =1206.623/151.179). As to foreign
investors, mutual funds, and securities dealers, their order sizes are 22.94, 61.68
and 55.52, respectively. The evidence further suggests that foreign investors are
likely to split their limit orders into smaller ones to camouflage their trades and
minimize possible price impacts, consistent with Chan and Lakonishok (1995),
Kyle (1985), and Chakravarty (2001).
Regarding the aggressiveness of the executed orders, we employ the
48 The Dynamic Anal)叫 olInvestors'Trading in the Taiwan Stock Market
for investors' demand for immediacy (e.g., Cooney, Van Ness, and Van Ness,
2003; Ranaldo, 2004). Higher submitted prices for buy limit orders (and lower prices for sell limit orders) should result in higher execution rates and shorter time
to execution. If the exe叫tion rate of orders by an investor is high or the time to
execution is short, he/she is likely to be impatient and acts as a liquidity demander.
Conversely, a value-motivated or patient trader, acting as liquidity provider, may
not be willing to trade until trading opportunities arise.
Reported in Panel C ofTable 1, the execution rate and the time to execution
of orders by professional institutions are respectively larger and shorter than those of individual investors. It follows that the professional institutions place orders in
a more aggressive way. Among professional institutions' orders, the execution
rate of mutual funds' orders is the highest while the time to execution of foreign
investors' orders is the shorte泣, indicating that foreign investors and mutual funds
are more impatient and willing to pay more to liquidity providers.5
5 One may question why the results measured by the execution rate 由ldthe time to execution for
foreign investors and mutual funds are con回dictory. From the angle of the execution ra妞,出e
limit- orders submitted by foreign investors are more aggressive; however, short time to
execution for the limit orders by mutual funds impli自由atthey are less patient. To solve the
mconslsten句,we attempt to examine the executed limit orders in more detail. First, we p盯tition
these orders into marketable and non-marketable limit orders,品 tobe defined in Section 4.2.1
In brief, since lhere is n自由era pre-trade period nor order informalion disseminaled before the
opening auction, we re且.ard the orders submitted before the opening 晶 the markelable limit
orders, if their buy (sell) prices are grealer (l自s) 曲曲 orequal to 血ecorresponding preceding
day's closing prices. After the opening auction, a marketable buy (sell) order is a limit order
whose limit price is grealer (lower) lh阻 orequal 10 the concurrent best offer (bid) price.
The u叮eported results show that, first, the executed marketable limit buy (sell) orders
submitted by foreign investors and mutual 臼nds respectively account for 52.9% and 51.1 %
(52.4% and 52.6%) of their own total limit buy (sell) orders. Hence, foreign investors and
mutual 如nds exhibit a similarity in the preference for marketable limit orders. Second, the observed buy (sell) order aggressiveness of foreign investors and mutual funds are respectively
0.0114 and 0.00354 (0.0112 個d0.0027), the inequality that is consistent with their observed 由c
time to execution. Overall, the two observations above show a better skill of mutual funds in
pricing non-marketable limit orders. Narnely, albeit mutual funds are relatively patient and
willing to wait a longer time, their submitted orders still can be executed. We 仰的cularlythank
Table 1
Descriptive Statistics
Buy Se1l
INDIs FIs MFs SOs INDIs FIs MFs SOs
Panel A: Trade data
Oaily no. oftrades (1000) 180.173 29.099 4.504 4.382 180.434 26.724 5.344 4.696 (82.588) (13.338) (2.065) (2.009) (83.074) (12.304) (2.460) (2.162) 932.824 212.249 42.606 43.509 945.767 193.615 42.737 43.644 Oaily trading volume (1000)
(75.766) (17.239) (3.461) (3.534) (77.157) (15.795) (3.487) (3.561) Panel B Order data
151.179 10.786 0.753 0.933 155.091 8.759 0.796 0.898 Oaily no. oforders (1000)
(92.379) (6.591) (0.460) (0.570) (93.686) (5.291) (0.481) (0.542)
Oaily order vo1ume (1000) 1206.623 247.458 46.443 51.797 1303.285 230.491 46.444 53.693 (77.730) (15.941) (2.992) (3.337) (79.765) (14.107) (2.843) (3.286)
Panel C Executed orders
Executionrate (%) 75.352 84.819 91.172 82.615 70.887 83.472 92.119 80.891
Time 個 execution(seconds) 826.887 347.341 504.526 552.280 758.941 354.439 496.958 509.726
Note: This table 間portsthe descrip叫vestatistics on trades 阻dlimit orders by each group of investors 五orthe TSEC 50 stocks. The ratios of the number ofbuy (se1l) trades by each investor type 個 thetotal b叫.y(se1l) trades and the trading volume to the total trading volume a間 reportedin parentheses. The average execution rate (%) oflimit orders by a given group ofinv自如rs18 研pressedas a percentage
of totallimit 叫dersby that give沮 groupof investors. The average time to execution is the average time of orders betw帥nbeing submitted and executed over the select叫“ocl曲, ignoring orders cancelled before execution. FIs, MFs, SOs, and INDIs stand for foreign investors, mutual funds, sec九1fitÎesdealers, and individual investors, respec地ively.
的
3E。
.
1?
h e=2
、
芯 片 趴~ 見。 』 趴CC、Jb D >....
心D50 The Dynamic Analysis oflnvestors 叮泊的ngin the Taiwan Stock Market
4.
Empirical Results4.1
Daily AnalysisEmploying trade data, this section examines the daily relation between
甘ading activities, concurrent retums, past retums, and institutional trading
persistence. It studies whether institutional trading activi旬, measured by the
institutional 甘ade imbalance, predicts daily stock retums as well. F or each stock, the 仕ade imbalance is defined as the difference between the buy and sell volumes
scaled by the daily trading volume.6 Then, for each day, we sort the TSEC 50
stocks equally into quintiles,企om low to high, based on the daily institutional
trade imbalance. With the five portfolios, we examine the institutional trade
imbalances and retums over the formation day (day 0) and the 5 days before
formation (days -1 toδ). Finally, we introduce a VAR analysis to examine the
lead-lag relation between stock retums and 仕adingactivities of each investor type
4.1.1 On The Basis ofInstitutional Trade Imbalance
'Table 2 reports 也e result耳, on the basis of institutional 仕ade imbalance.
First,由ere is a significantly positive contemporaneous relation between the
institutional trade imbalances and stock returns
,
consistent with Chiao and Lin(2004) and Chiao, Cheng, and Shao (2006). On day 0, the portfolio return is
monotonically increasing with the trade imbalance. The portfolio with the largest
institutional sell imbalances has a lower average return of -0.907%, whereas the
portfolio with the largest institutional buy imbalances yields 1.285%. The
differenc巳 between the highest and the lowest portfolios 但也) is 2.192% and significant at the 1 % level.
Second, institutional investors tend to engage in momentum 仕ading. The
returns over days -1 through -5 generally increase with the trade imbalance. For
the portfolio with the largest institutional selling imbalances on day 0, there is a
return “0.540% on day -1, whereas the portfolio with the highest net buy
imbalance yields 0.858%. The H-L return is 1.398% on day -1 and 0.569% on day
6 We also calculate the institutional trading imbalance in terms of the dollar trading volume and
Chiao Da Management Review Vol. 29 No. !, 2009 51
-2, clearly revealing the institutional positive-feedback trading tendency,
supporting Grinbla前, Titman, and Wermers (1995), Wermers (1999), and GHT
(2003). 切lird, pertaining to the persistent of institutional trade imbalances, we observe that the portfolio with the highest institutional trade imbalances on day 0
has significantly higher trade imbalances over days -1 to -5 as well, confirming
the persistence ofthe institutional 仕ading activity
Finally, the average daily correlation between the institutional and
individual 甘ade imbalances is -0.63. Although the 泌的tutional and individual
imbalances are not perfectly negatively correlated, it seems safe to make a
statement on the relation between individual trading and stock returns. That is, the
presumably negative contemporaneous relation between the individual trade imbalance and stock return preliminarily suggests that individuals behave as contrarian traders.
4.1.2 00 The Basis of Stock Return
Adopting a similar procedure to the one in 也e previous sub-section, we
divide the TSEC 50 stocks equally into quintiles based on daily return. For each
portfolio, the ratios of stocks for which institutions and individuals are net buyers
over day +1 (the day after formation) 的 drawn in Figure 2. Stocks wit11 the
highest daily stock returns are net bought with a probability of 67% by institutions
on day + 1, whereas the stocks wit11 the lowest returns are net bought only with a
probability of 37%. Conversely, individuals are more likely to net sell (buy) the
stocks wit11 the highest (lowest) daily stock returns. Therefore, even on the basis
of daily stock return, we still find that institutions (individuals) tend to be
山 公、2
Table 2
La~~ed Returns and Institutional Trade Imbalances for Portfolios ßased onlnstitutional Tradelmbalances Day -5 Day -4 Day -3 Day -2 Day -1 Day 0 Day -5 Day -4 Day -3 Day -2 Day -1 Day 0
1nstitutiona1 trade imba1ance (%)
HJFGHM 可 EER 』 Ehy 句目。\皆可 BEZ ‘ HVS 且骨肉 ssnMVEbw 吋勻。的持 pm 泊、再見 句 15.633 -6.286 -3.640 -2.281 -1.793 -1.061 -0.540" -0.907 (-7.260) (-12.259) -0.213" -0.374 (-3.162) (-5.261) Retum (%) Rank -0.137 (-1.846) -0.017 (-0.230) 0.021 (0.276) 0.056 (0.736) -0.047 (-0.675) 0.013 (0.187) 0.040 (0.579) 。 065 (0.932) L -4.811 -1.781 -1.089 -0 .455 -0.427 -0 .485 。 553 17.307 6.163 。 627 2.830 8.071 0.405 1.896 5.786 。 212 1.310 4.438 0.313 1.149 3.873 。 182 0.963 3.422 。 318 -0.007 (0.475) (-0.110) 。.362" 0.488 (5.318) (7.109) 0.858" 1.285 拿 (11.143) (17.842) 1.398" 2.192 (29.211) (47.082) 、, J. 、',壘,、 BJen 叮/ ζJny--J A 岫Tro 弓 J 勻, e 勻, BronwJAU O675 日 8 而 A -E1.4.fl OOL215L: (OCO(OO 0.047 (0.709) 。.149' (2.157) 0.274" (3.71) 。 291" (6.945) 0.079 (1.174) 0.067 (0.972) 2 。 118 (1.708) 。 211" (2.85) 。.1 90" (4.609) 0.101 (1.474) 。.149' (2.036) 0.093' (2.305) 3 4 H 32.940 14.357
Note: This table repo吋sthe lagged retums and institutional trade imbalances for portfolios based on institutional trade imbalances. For each trading day, the TSEC 50 stocks are divided into quintiles, from low to hi叭,based on the daily institutional trade imbalance. For each stock, institutional trade imbalance is the difference between the institutional buy and sell volumes for that day and scaled by the daily 伽ding volumes. We report the average of la銘ed and concurrent institutional trade imbalances and stock retums for each portfolio. The last row reports the difference between the highest and the lowest portfolios (H-L) for each variable. The I-ratios are reported in parentheses. " •• indicate significance at the 5% and 1 % levels, respectively
9.426 6.719
5.666 4.483
53
ChiaoDaManαgement Review Vol. 29 No. 1, 2009
Figure 2
Institutional and Individual Trade Imbalances on The Return-Based
Portfolios Over Day + 1
固 Individuals 區 Institutions 0.8 。 4 。 1 。 2 0.7 。 6 。 5 0.3 aoogaw 苟且 E 呵 ω-ue 扭 ωba 司的。晶晶叫偉 au 晶。。話徊。。但也也出 H 4 2 3 Return-based Portfolio L
。
For each trading day from 9/2/2002 to 12β112004, the TSEC 50 stocks are equally divided into quintiles, from 10w to high, based on their daily return. For each portfolio, the ratios of stocks for which institutions and individuals are net buyers over day + 1 are reported
4.1.3 Daily VARAnalysis
甘lÍs section will conduct a VAR analysis to explore the lead-lag relation
between 仕ade imbalances and stock returns on a daily basis. Because the TSE
change the members of the TSEC 50 once a quarter, we focus only on the stocks
that are in the TSEC 50 stocks throughout the whole sample period. There are
totally 34 stocks selected. Then, we ca1culate the daily returns, institutional and
individual trade imbalances for each stock. In order to extract the common
market-wide effec紹, these variables are subtracted by the equal-weighted TSEC
return, institutional trade imbalance, and individual trade imbalance,
respectively. Finally, for each stock, the following equations are estimated
The 勾mamicAnalysis olInvestors 'Trading 的 theTaiwan Stock Mar,岫 54 ) l ra 、、 Rt= 的 +
L
ß"
RRt (2)L=α1
+ Lßi.IRt-i +LÅiλ-j
+ LYi,
I Jt-i+ 丸,
(3)
A=αJ
+ Lßi,JRt-i + LÅi,J1t_i + LYi,JJtwhere Rt_i is the TSEC-50-adjusted retum at day -Î relative to time t and ιzmdJiz
are respectively the 叫justed institutional and individual trade imbalances at
day -Î. We present the cross-sectional averages of the coefficient estimates and
the percentages of stocks with significantly positive or negative coe伍cientsat the
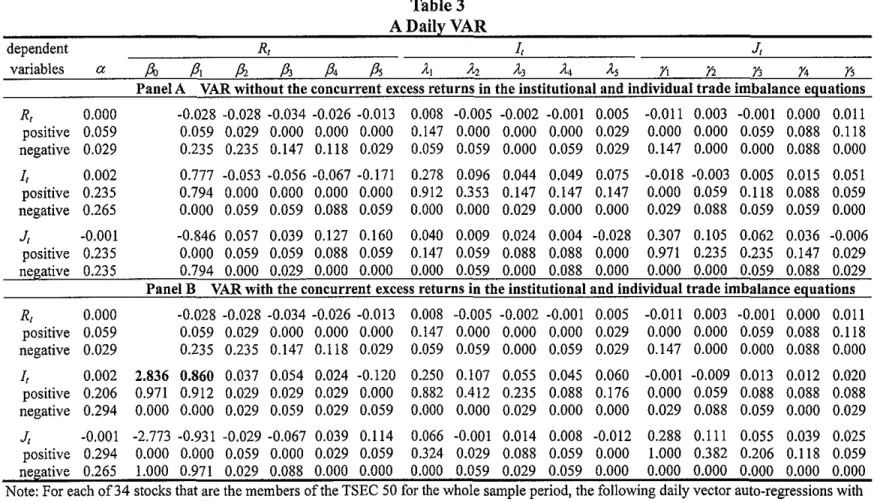
10% level in PanelA ofTable 3.
(individual) trade imbalances are positively
the previous day's retums. F or the institutional and
equations, equations (2) and (3), the average
coe宜icientson the previous day's retum are 0.777 and -0.846, respectively. There (79.4%) of stocks that have significantly positive (nergative)
coefficients at the 10% 1巳:vel. Although the institutional (individual) net buying
activity increases (decrease) with the previous day' s retum
,
the pa位.em reversesquickly, as shown by slightly negative (positive) coefficients on the day -2's to
day -5's retums. institutional related to First, (negatively) individual trade the imbalance 79.4% are
Second, institutional investors persistently trade in the same stocks for
several days, consistent with Sias and Starks (1997). The average coefficient on
the previous d旬's institutional trade imbalance is 0.278 and 91.2% of stocks have
a significantly positive coefficient. The coefficients on the day -2's to day -5's
institutional trade imbalances are sti11 positive. AIso, we find that individual trade
imbalances are positively related to their own past trade imbalances.
Third, th巳 institutional trade imbalance cannot predict daily
Although the average ∞efficient on the previous day' s institutional trade
imbalance in the retum equation (equation (1)) is 0.008, only 14.7% of stocks
have a signifiωntly positive coefficient. Additional1y, al1 ofthe lagged individual
Table 3 ADaily VAR
dependent R
,
L J,
variables G A βl ß, A ß4 A λ1 λg λ3 A λ5 y
,
Y2 均 月 丹Panel A VAR without the concurrent excess returns in the institutional and individual trade imbalance equations
R
,
0.000 -0.028 -0.028 -0.034 -0.026 -0.013 0.008 -0.005 -0.002 -0.001 0.005 -0.011 0.003 -0.001 0.000 0.011 positive 0.059 0.059 0.029 0.000 0.000 0.000 0.147 0.000 0.000 0.000 0.029 0.000 0.000 0.059 0.088 0.118 negative 0.029 。 .235 0.235 0.147 0.118 0.029 0.059 0.059 0.000 0.059 0.029 0.147 0.000 0.000 0.088 0.000 L 0.002 0.777 -0.053 -0.056 -0.067 -0.171 0.278 0.096 0.044 0.049 0.075 -0.018 -0.003 0.005 0.015 0.051 positive 0.235 0.794 0.000 0.000 0.000 0.000 0.912 0.353 0.147 0.147 0.147 0.000 0.059 0.118 0.088 0.059 negative 0.265 0.000 0.059 0.059 0.088 0.059 0.000 0.000 0.029 0.000 0.000 0.029 0.088 0.059 0.059 0.000 A -0.001 -0.846 0.057 0.039 0.127 0.160 0.040 0.009 0.024 0.004 -0.028 。 307 0.105 0.062 0.036 -0.006 positive 0.235 0.000 0.059 0.059 0.088 0.059 。 147 0.059 0.088 0.088 0.000 0.971 0.235 0.235 0.147 0.029 negative 0.235 0.794 0.000 0.029 0.000 0.000 0.000 0.059 0.000 0.088 0.000 0.000 0.000 0.059 0.088 0.029Panel B VAR with the concurrent excess returns in the institutional and individual trade imbalance equations
R
,
0.000 -0.028 -0.028 -0.034 -0.026 -0.013 0.008 -0.005 -0.002 -0.001 0.005 -0.011 0.003 -0.001 0.000 0.011 positive 0.059 0.059 0.029 0.000 0.000 0.000 。 .147 0.000 0.000 0.000 0.029 0.000 0.000 0.059 0.088 0.118 negative 0.029 。 235 0.235 0.147 0.118 0.029 0.059 0.059 0.000 0.059 0.029 0.147 0.000 0.000 0.088 0.000 L 0.002 2.836 0.860 0.037 0.054 0.024 -0.120 0.250 0.107 0.055 0.045 0.060 -0.001 -0.009 0.013 0.012 0.020 positive 0.206 0.971 0.912 0.029 0.029 0.029 0.000 。 .882 0.412 0.235 0.088 0.176 0.000 0.059 0.088 0.088 0.088 negative 0.294 0.000 0.000 0.029 0.059 0.029 0.059 0.000 0.000 0.029 0.000 0.000 0.029 0.088 0.059 0.000 0.029 A -0.001 -2.773 -0.931 -0.029 -0.067 0.039 0.114 0.066 -0.001 0.014 0.008 -0.012 0.288 0.111 0.055 0.039 0.025 positive 0.294 0.000 0.000 0.059 0.000 0.029 0.059 0.324 0.029 0.088 0.059 0.000 1.000 0.382 0.206 0.118 0.059 negative 0.265 1.000 0.971 0.029 0.088 0.000 0.000 0.000 0.059 0.029 0.059 0.000 0.000 0.000 0.000 0.000 0.00。Note: For each of34 stocks that are the members ofthe TSEC 50 for the whole s缸npleperiod
,
the following daily vector auto-regressions with5 lags are estimated
的
F NZ。
b ~i;;'電告、
EN F 、N2 。見 』 趴E河旦J D v> υ、v.
。、
Rg= 的 +I 丸.RR'_i + 主 λi.R1'_1 + LYi.RJ'-i + ð,仙
It=α/+ 主ßuRt-i + 乏人 [l[-j + 主叭,叫 p'
Jr=αJ + I ßi,JRH + IÂi
,
J1'_i + Iri,
JJH + 系,J MJFmNM宮。 ENbhEYM 切』芷若 EEE ‘ HVGKE 岫宮志的 MER 宅 S 勻。 &hhR 』E
where R'_i is the adjusted return at day -i andζi and J1-l.lre the a句ustedinstitutional and individual trade imbalance at day -i, r自:pectively,These three variables are adjusted by separately subtracting the equal-weighted average over the stocks comprising the TSEC 50 stocks for the corresponding day, This table reports the cross-sectional averages of the coefficient estimates, and the percentage of stocks with positive and
Chiao Da Manag凹'11ent Reviel伊始l.29 No. 1, 2009 57
trade imbalance coefficients are close to 0 and less than 12% of the coefficients
are significant at the 10% level. Therefore, consistent with the finding from
Odean (1999), there is no clear evidence that the past individual trade imbalance
forecast daily returns.
In order to compare 也e contemporaneous relation between stock retums
and 甘le institutional trade imbalances with the effect of the lagged retums on the
institutional trade imbalances
,
we propose a structural VAR including thecontemporaneous returns as an independent variable in the institutional and
individual 仕adeimbalance equations, (2) and (3), respectively (GHT, 2003). From
Panel B ofTable 3, we observe that the contemporaneous relation is stronger than
the relation between the lagged returns and the institutional trade imbalances. In
institutional trade imbalance equation, the average coe旺icient on the concurrent
retum is 2.836 and larger than the average coefficient on the lagged one-period
retum (0.860), shown in bold. Mor,∞ver, up to 97.1% of stocks have a
significant1y positive coefficient on the concurrent retum at the 10% level.
According to the related literature, this strong daily contemporaneous
relation may arise 企omprice pressure 企ominstitutional trading (French and Roll,
1986; 由此ravar旬, 2001), positive-feedback tendency (GHT, 2003), or
forecasting capability (Wermers, 1999; Grinblatt and Titman, 1993; Nofsinger
andS悶, 1999; Cho巴, Kho, and Stulz, 2005). Thanks to the richness of our data,
the next sub-section will apply an intraday analysis to justify the three possibilities.
4.2 Intraday Analysis
We intend to explore several competing explanations for the strong daily contemporaneous relation between imbalances and retums in the following ways
similar to those proposed by GHT. First, we use an intraday V AR analysis to
disclose the time-series properties of the order imbalances and retums. Secon吐,
we examine retums and order imbalances surrounding extreme institutional and individual order imbalances events as well as extreme retums.
In the intraday analysis similar to the previous daily analysis, we only focus
58 The Dynamic Analysis 01 Investors' Trading in the Taiwan Slock Market
period. Each trading day is divided into 54 five-minute intervals from 9:00 a.m. to
1:30 p.m. For each selected stock, we calculate the institutional and individual
order imbalances and use the trade prices to compute the returns over intervals.7
One major difference 企'om the approach proposed by GHT (2003) results
企omthe employed data. Because the TSE is an order-driven market where stock
prices are purely driven by order flows, this sub-section uses limit-order data
rather than 仕adedata. Thereby, we can expect to leam mor巴 abouthow the trading
intentions of investors affect short-term price movements, from the angle of order
submission behavior.
Generally speaking
,
investors seeking immediacy tend to submit ordersmore aggressively and exert more pr.臼sure on stock prices. However, unlike
limit-order data, trade data act as 血e ex-post realizations rather than the ex-ante
intentions of investors because execution prices may not be equal to the submitted
order prices. More importantly, trade data cannot cover the part oflimit orders not
executed. Therefore, comp紅巴dto trade data, limit-order data capture more clearly
the timing and strength with which the orders by investors move the stock prices
Furthermore, we adopt the method advanced by Chiao, Wang, and Lai (2007) and
analyze the imbalances of orders that seek immediacy, i.e., market且.ble limit
orders, to measure the extent to which trading activities immediately impact the
stock prices.
4.2.1 Order Imbalances
Order imbalances
,
often indicating private information,
could reduceliquidity at least temporarily and move the market price permanently. A positive
order imbalance signals the prevalence of demanders, engendering an upward
price pressure, a positive 伽nsitory volatili紗,and a tighter spread (Ranaldo, 2004).
Blume, MacKinley, and Terker (1989) argue that 品的 isa strong relation between
order imbalances and stock price movements, in the analyses of both time series
and cross sections.
Nevertheless, a total order imbalance 一- total buy orders less total sell
orders - may fail to provide an unambiguous association between investors'
Chiao Da Management Review Vol. 29 No. 1, 2009 59
order submission behaviors and the price impact. For instance, under the rule of
the single-price opening auction, the buy (sell) orders with very low (high)
submitted prices would not impact the concurrent stock prices. In order to
distinguish the orders that can effectively and immediately move stock prices, this
sub旬sectionanalyzes the imbalance ofmarki巴tablelimit orders
Like prior studies (e.g., Lee et al., 2004; Peterson and Sirri, 2002), a
marketable limit order is a buy (sell) limit ord巳r that is immediately executable
upon its receipt if the limit price is greater (lower) than or equal to a benchmark
price. Before the opening auction, no order information is disseminated;
afterwards information pe由ining to the limit order book (包r upω 卸的 est bid
and ask queues) 的 disseminated to the public on a real-time basis. From the
standpoint of investors, before the opening auction, the benchmark price of a
selected stock is defined as its ciosing price on the preceding 伽ding day (Chi帥,
Wang, and L訓, 2007). For a buy (sell) limit order submitted afterwards, the
benchmark price is assigned to the prevailing best ask (bid) price. Traders seeking
immediacy tend to use the marketable limit orders, while patient traders submit
non-marketable limit orders 4.2.2 Intraday VAR Analysis
In the intraday analysis, we calculate the returns and institutional and
individual order imbalances during each interval for each stock. The institutional
(individual) order imbalance is defined as the difference between the institutional (individual) marketable buy and selllimit orders for that 5-minute interval scaled
by the daily order volume.8 In order to control for common market-wide effec俗,
these variables are subtracted by the equal-weighted TSEC 50 re仙rn,institutional
or individual order imbalance, respectively. Then, the following equations are
estimated for each stock
8 Marsh and Rock (1986) find that the price impact of order imbalances varies with the stock sizes
F or instance, given 由e 10,000 of order imbalances, the larger stocks with deeper depths will
60 The Dynamic Analysis oflnvestors 'Trading in the Taiwan Stock 且也rket
Rr
zαR
+
Lßi,
RR,
-i+
L Å.i,
R1,
-i+ 乏丸,叫 i+ 系,R'
(4)Ir=α[
+ Lßi,lR'-i + L Å.i,
[It-i + LYi,
[Jt-i + 0,,[
(5)久 =αJ+ L ßi,JR (6)
where R'_i is the adjusted return at interval -Î and It_i and Jt_i are respectively the
a吐justed institutional and individual order imbalance at interval -Î. To avoid
crossing day boundaries for the lagged returns and order imbalances, the first half
hour of each trading day(9:00 a.m. ~ 9:30 a.m.) is excluded 企'om the analysis.
There are tot耳lly48 five-minute intervals for each tradingday. Table 4 reports 也e
cross-sectional averages of the coefficient estimates 組 dthe percentages of stocks
with significantly positive or negative coefficients at the 10% level.
Panel A of Table 4 reveals several interesting findings. F irst, the
institutional order imbalances are positively related to the past returns. The
average coefficient on the lagged one-period return is 0.110 and 73.5% of stocks
having a significant coefficient. There are at least 32.4% of stocks with a
signifiωntly positive coefficient on the lagged three-period returns, the
institutional positive-feedback s甘ategy that lends support to GHT (2003) but is
inconsistent with Nofsinger and Sias (1999).
Second, the institutional order submission behaviors are persistent since the
institutional order imbalances are positively autocorrelated. F or instance, the
average coe伍cient on the lagged one-period institutional order imbalance in
equation (5) is 0.120 and all of stocks have statistically significant coefficients
τbis is possibly because institutional investors tend to split their large orders to
smaller ones so as to camoutlage their 仕ades to minimize possible price impacts
(Chan and Lakonishok
,
1995; Admati and Ptleiderer,
1988). However,
thefindings is contrary to those by GHT (2003) who find that the institutional order imbalance is negatively related to the lagged own one-period order imbalance but
dependent variables α R
,
ß, j3, ß4 ß,
Table 4 An Intraday VAR L ß6-<,
-<,
λ3 ,t, Âs 7名 J,
1'3 Y4ßo
ß,
A y,
y, 丹 PanelA R,
0.000Vl\.R without the concurr四lt 阻cessretnrns in the institutional and individual order imbalanc海 equations
-0.38 -0.24 -0.15 -0.11 -0.06 -0.04 0.070 0 日 20 0.020 0.010 0.000 0.000 0.1700.0300.0200.0200.0100.010 0 0 0 0 0 0 0.000 0.000 0.000 0.000 0.000 0.000 0.941 0.441 0.412 0.176 0.088 0.029 1.0000.8530.7650.5590.5590.294 1.000 1.000 1.000 1.000 1.000 1.000 0.000 0.029 0.000 0.118 0.029 0.176 0.0000.0000.0000.0000.0000.000 positive 0.176 negative 0.176 1
,
0.000 positive 0.294 negative 0.235 J,
0.000 。 .110 0.040 0.020 0.010 0.000 0.000 0.7350.412 0.324 0.147 0.235 0.118 0.0290.0290.0590.1180.088 0.059 0.220 0.120 -0.09 -0.05 -0.03 -0.01o
0 0 0 0.971 1.000 0.000 0.000 0.000 0.000 0.029 0.000 1.000 0.824 0.588 0.294 。 .120 0.020 0.020 0.010 0.000 0.020 0.0300.0100.0100.0000.0000.000 1.000 0.735 0.529 0.235 0.147 0.294 0.6760.1180.0880.0880.0290.059 0.000 0.000 0.029 0.118 0.059 0.059 0.0290.0590.0290.0590.0000.029 0.0000.000 0.000 -0.01 -0.01 -0.01 0.1800.1200.0200.0200.0100.000 0 0 0 0.176 0.000 0.088 0.029 0.000 0.029 1.000 0.706 0.529 0.529 0.2940.000 0.118 0.147 0.059 0.088 0.206 0.147 0.0000.0000.0000.0000.0000.029 positive 0.265 些昆虫已型豆P'anel B VAR with the concurrent exc曲sreturns in the institutional and individual order imbalance equations
R
,
0.000 -0.38 -0.24 -0.15 -0.11 -0.06 -0.04 0.070 0.020 0.020 0.010 0.000 0.000 0.1700.0300.0200.0200.0100.010 0 0 0 0 0 0 positive 0.176 0.000 0.000 0.000 0.000 0.000 0.000 0.941 0.441 0.412 0.176 0.088 0.029 1.0000.8530.7650.5590.5590.294 negative 0.176 1.000 1.000 1.000 1.000 1.000 1.000 0.000 0.029 0.000 0.118 0.029 0.176 0.0000.0000.0000.0000.0000.000 1,
0.000 0.530 0.080 0.080 0.050 0.050 0.030 0.020 0.080 0.030 0.000 0.020 0.000 0.020 -0.05 0.000 -0.01 -0.01 -0.01 0.000o
0 0 0 positive 0.294 1.000 0.706 0.882 0.735 0.676 0.618 0.559 1.000 0.853 0.059 0.882 0.000 0.618 0.0000.0590.0000.0590且 000.029 negative 0.235 0.000 0.029 0.000 0.000 0.000 0.000 0.000 0.000 0.000 0.059 0.029 0.029 0.000 0.7350.2350.2350.1180.2060.088 J, 0.000 0.540 -0.01 0.000 -0.01 0.000 -0.01 .0.010 -0.04 -0.02 -0.01 -0.01 -0.01 -0.01 0.1000.0400.0200.0200.0000.000o
0 0 0 0 0 0 0 0 positive 0.235 1.000 0.265 0.235 0.118 0.265 0.088 0.265 0.000 0.000 0.029 0.000 0.000 0.029 1.0000.9120.735 0.5880.1470.000 negative 0.294 0.000 0.471 0.294 0.412 0.235 0.206 0.118 0.529 0.294 0.088 0.118 0.206 0.118 0.0000.0000.0590.1180.0000.176Note: For each of34 stocks that are the rnernbers ofthe TSEC 50 for the who1e sarnple pe口的 d,the following d副ly v自岫rauto-regressions with
6 lags are estimated
的甘心。 bhN 〉 KSRM 岫 nESNhs 宮、 FrhhE 宅。 iFN-bE "、
-o、 N Rf ;::::.aR + 乏 β'i.RRr-i + 主 λ"ι 1
,
= a,
+L,
ß'
,1RH + L, λ;,1 11_1 + Lri,I九 J, = a,
+L,
ß"
,
R,_, +L,
Â",
IH + L, y" ,J,刊+伐" 泣。均可 EERhEY 背曳 HERE2. 旬之 5 個吉普白宮。這句一。已是堅宮where R,.; is the adjusted 間turnat interval -i andιand .!,';J.fe respect附lythe adjusted institutional and individual order imbalance at interval -i,
These three variables are adjusted by separately subtracting the equal-weighted average over the stocks comprising the TSEC 50 stocks for the corresponding 5-minute interval. The institutional (individual) order imbalance is the difference between the institutional (individual) marketable buy and selllimit orders scaled by the daily order volumes 必rthat 5-minute interval. For limit orders placed prior to the opening, a marketable limit order is a buy (sell) limit order whose price is greater (lower) than or equal to the corresponding closing price on the preceding trading day. For the orders submitted after the opening, a marketable limit order is a buy (sell) limit order whose price is greater (lower) than or equal to the prevailing best offer (bid) To avoid crossing day boundaries for lagged retums and or甘erimbalances, the first half hour of each trading day is excluded from the analysis. This table reports the cross-sectional averages of the coefficient estimates and the percentage of stocks with positive and negative coefficients that are significantly different from 0 at the 10% level
Chiao Da Management R目前vVol. 29 No. 1, 2009 63
positively related ωthe lagged own two-period to six-period order imbalances for
the NASDAQ100 stocks. This difference may result from the microstructure of
NASDAQ that the market makers tend to smooth inventory around block 仕adesto
control inventory risk (Reiss and Wemer, 1998). Conversely, the TSE is a p前ely
order-driven market without designated market makers, so our results are immune
from the inventory effect. Moreover, we observe that individuals tend to herd
across 仕ading days. Even for 甘le lagged four-period individual order imbalance,
more than 52% of stocks have a significantly positive coe宜icient.
Third, both the institutional and individual order imbalances are positively
related to the future returns
,
and the relation is s甘ongestfor the lagged one period.In the retum equation (equation (4)), for 94.1% (100%) ofthe stocks, the lagged
one-period institutional (individual) order imbalances exert a significantly
positive influence on the concurrent retums. Finally, there is no clear evidence
that the lead-lag relation between institutional and individual order imbalances
exists. For instance, the average coefficients on the lagged institutional order
imbalances in individual order imbalance equation (equation (ô)) 訂巳 close to 0
and there are only a few stocks with significant coefficients
4.2.3 Intraday Event study
To emphasize the timing at which the order imbalances by each investor
type take place, this section will pay atiention to the five-minute periods of order
imbalances and stock retums surrounding events of intensive 加ding or ex仕eme
retum.
(1) Events ofExtreme Institutional Order Imbalance
We first seek to examine all investors' order imbalances and retums around the events of extreme institutional order imbalance. We divide each trading day
into 54 five-minute intervals 企om 9:00 a.m. to 1:30 p.m. There are totally 24,360
intervals for each stock. Around 20% of them一 the 2
,4
36 intervals of the largestand the smallest institutional order imbalances, separately- are then selected for
each stock. This application is essentially similar to that of GHT (2003). To avoid
crossing daily boundaries while examining intervals -6 to +6, the events starts
64 The Dynamic Analysis of Investors' Trading in the Taiwan Stock Market
Figure 3 plots the cumulative average retums and institutional and individual order imbalances for the thirty-minute periods (-6 to +6) sUITounding the events of the extreme institutional order imbalances,
Figure 3
Intraday Returns and Order Imbalances Around The 5-1\位nute
Intervals of Extreme Ins組組組onalOrder Imbalances
Panel A Top 20% intervals of the largest institntional bny order imbalances 0.6 c - lnstitutional order imbalance
,
1.2區噩噩Individualorder imbal祖ce
。 5 哼一t 印血咖ve re恤 0.4 0.8 0.3 0.2 。 1 0.2
。
。
-0.1 -0.2 -6 -5 -4 -3 -2 -1 0 1 2 3 4 5 6Panel B Top 20% intervals of the largest institntional sell order imbalances
[問Jr
1""
,1""
,rLJEiii
d
t
。
-0.1 r- .. ---.~ _ . - - ~ -j -0.1 。.2 ←?\ .
。.3kB
l …恥 !l43
-j -0.4 -0.5 J -0.5 -6 -5 -4-3
-2。
1 23
4 5 6Chiao Da Management Review Vol. 29 No. !, 2009 65
Each trading day is divided into 54 five-minute intervals from 9:00 a.m. to 1:30 p.m. For each interval, the return and order imbalance are computed for each ofthe 34 stocks that is a member of the TSEC 50 throughout the sample period from 2/9/2002 to 31112/2004 訂單 institutional
(individual) order imbalance for each stock is the di宜èrence between the institutional (individual) marketable buy and seII limit orders scaled by the order volumes of the sarne stock over the trading day for that 5-minute interval. There are totaIIy 24,360 intervals for each stock. Around 20% of them-the 2436 intervals of the largest and the smaIIest institutional order imbalances, separately-are then selected. To avoid crossing day boundaries while exarninin皂, the events are selected from the 7也 interval(9:30-9:35 a.m.) through the 48th interval (12:55-1 :00 p.m.)
Panel A of Figure 3 examines the activities around the events of the largest institutional buy imbalances. Before extreme institutional buy imbalances, the individual investors' order imbalances are smaI1 and negative for intervals -6 to -2 whereas institutional net buying activity is persistent. Therefore, stock pric巴:s are pushed up graduaI1y and the retums range 企om 0.06% to 0.09% in each ofthe six 5-minute intervals preceding the event. It indicates that institutional investors demonstrate cIear positive-feedback trading pattems, consistent with the preceding intraday VAR results.
Unlike the observations documented by GHT (2003), the retum over interval 0 (0.30%) is significant and quite distinguishable. Not until interval -1, individual investors start to net buy 甘leTSEC 50 stocks. Over interval 0, the order imbalances by institutional and individual investors reach the top simultaneously, moving the 5-minute retum to its peak. The institutional order imbalances are 3 times more than the individual order imbalances over interval O. It is clear that the order imbalances by institutions are the main driving force of the concurrent retums and, to a less extent, investors also plays a role. After interval 0,
institutions continu巴 to net buy with smaI1er scales while individual investors switch to net seI1 those stocks. The retums are relatively smaI1 with a cumulative 30-minute retum ofO.08% only
In Panel B ofFigure 3, the retum pattem and trading activities looks mirror reflections of those demonstrated in Panel A. Institutional investors tend to persistently net seII the TSEC 50 stocks over the entire I3 five-minute intervals The order imbalances by individual investors, on the other hand, are cIose to 0 in alI intervals except interval O. The cumulative retums over intervals [-6, -1] and [+ 1, +6] are -0.16% and -0.08%, respectively. Institutions and individuals
66 The Dynamic Analysis olInvestors' Trading 的 theTaiwan Stock Market
simultaneously net sell the selected stocks over interval 0 with a return of -0.24%.
We sti11 find that the institutional order imbalance is the main driving force of the
concurrent return
(2) Events of Extreme Individual Order Imbalance
Figure 4 draws the 仕ading activities surrounding the extreme individual order
imbalances. The cumulative returns over interval [-6, -1] are 0.310% and 0.044%,
的 shown in Panels A and B, respectively. 官le difference in cumulative returns
(0.266%) is significant at the 1 % level, implying that individual investors submit
more marketable buy (sell) limit orders before stock prices soars (plungès). The
institutional investors also net buy the selected stocks on a small scale over
interval O. The return over this period is 0.36% and larger than the return over
interval 0 with the largest institutional buy imbalance, as drawn in Panel A 甘11S
is perhaps because individual investors are the main market participants, as
reported in Table 2, and play an important role in moving stock prices. The
cumulative return over interval [+ 1, +6] is almost zero.
(3) Events of Extreme Return
In the preceding sub-sections, we have learned 也e intraday linkage 企om
the order imbalances by each investor type to the short-terrn returns on the TSEC
50 stocks. To understand in more detai! whether individual and institutional
trading activities forecast,合lV巴, or follow stock returns, we select the top 10%
five-minute intervals separately with the largest and the smallest returns for each
stock, and then examine institutional and individual trading activities over the
thirty minutes surrounding the events.
Panels A and B of Figure 5 plot the trading activities around the events of the
largest and the smallest returns, respectively. In general, the stock prices move
little prior to interval 0 and the order imbalances by all investors are rather small.
Not until interval -1, the institutional and individual investors simultaneously act
as net buyers and push up the stock prices by 0.066%. Following interval 0,
institutional investors still persistently net buy those stocks but individual
investors st訂t to net sell stocks and the stock prices start to fall. Noteworthy is
that, the trading directions of institutional investors are opposite to those of
Chiao Da Management Review 均1.29 No. 1, 2009 67
Figure 4
Intraday Returns And Order Imbalances Around The 5-Minute lutervals of Extreme Individual Order imBalances
Panel A Top 20% intervals ofthe largest indi吋dualbuy order imbalances
。 8 _lnstitutional order imbalance
區墨璽 lndividual order imbalance //,Ã_企~ι由
一念一 Cmnulativereturn ~ 于官聖哲 / / 位主 。。 ro4. 弓, h Aυnυnunυ 11titil--→ liIlli--1iIJ 「 4 月 SEZEESEδ 。 6 。 4 。 2 全~
。
。
-6 -5 -4 2 3 4 5 6 -0.2 -0.2Panel B Top 20% intervals of the largest indi吋dnalsell order i血balances
串串串 CR
,It ,1,
L.
,
1
,. ,. '. ,.
。自圓圓凶個層…『臼『可『臼b;, ! . " " " .~Uo\是L
æ
~ ~
-0.2 ( 法 ) Eω
a M J-04自04L
Ji
EE D G -0.6 •i。品i ~
-0.6告。
δ
E -0.8 L ~ -0.8 -6 -5 -4 -3 -2 。 2 3 4 5 6Each trading day is divided into 54 five-minute intervals from 9:00 a.m. to 1:30 p.m. For each
interval, the retum and order imbalance are computed for each ofthe 34 stocks 由atis a member of
the TSEC 50 throu的out the sarnple period from 2/9/2002 to 31112/2004. The institutional
(individual) order imbalance for each stock is the difference betwe聞出einstitutional (individual)
68 The Dynamic Analysis olInvestors' 卦。dingin the Taiwan Stock Market
甘ading day for that 5-minute interval. There are totally 24,360 intervals for each stock. Around 20% of 也em-the 2436 intervals of 也e largest and the smallest individual order imbalances,
sep缸ately 一缸'ethen selected. To avoid crossing day boundaries while ex缸nini嗯.the even臼缸C
se!ected from the 7血 interva!(9:30-9:35 a.m.) through the 4日thinterva! (12:55-1 :00 p.m.).
rather limited, the cumulative returns over intervals [-6, -1] and [+ 1, +6] are only
0.006% and 0.104%
,
respectively.The returns over interval 0 reported in Panels A and B are 0.586% and
-0.515%, respectively. It is obvious that th巴 order imbalances by individual
investors are the main driving force of the ex仕eme returns whereas institutional
trading activities still have an impact on stock prices. For example
,
in Panel A,
albeit both institutions and individuals are net buyers, the order imbalance by
individual investors (0.294%) more than doubles that by institutional investors
(0.146%). In addition, the results 企'om the intraday event-study show that the
extreme institutional order imbalances engender price pressure and have li社Ie
ability to forecast subsequent stock price movements. The stock prices move more
when the trading direction of individuals is in line with that of institutions. Our
results con仕adict the observation for NASDAQ by GHT (2003) who find that
prices move little in the 5-minute interval with large individual order imbalances.
Particularly note th前, despite that the intraday V AR results in Panel A of
Table 4 show that institutional order imbalances are positively related to the next
5-minute returns
,
Panels A and B of Figure 5 reveal that the returns following theextreme events are relatively smaller and close to O. Therefore, there is no
consistent evidence that the institutional order imbalances can predict future 30-minite returns.
Given the inconsistency observed above, one may wonder what driving
force makes the positive correlation between institutional order imbalances and the stock returns on the same day. Is it the positive-feedback tendency or the price
impact? To answer this question
,
we estimate regressions similar to those in PanelA of Table 4, except that the concurrent returns are additionally included for the
Chiao Da Management Review Vol. 29 No. 1, 2009 69
Figure5
Intraday Returns And Order Imbalances Around The 5-Minute Intervals ofExtreme Returns
0.4
Panel A Top 20% intervals of the extreme positive returns
圓圓圓 InstitutionuaIorder imbalance
監翠皇宮Individualorder imbalance
一傘一 Cumulativereturn 0.8 。 6 0.3 (法 )BE 苟且自己 ω 宮。 0.4 。 2 0.1 0.2 。 }崗藍E 呵EJ~I~ 圖【 L唔,-圓圓腎。闢圓圓 -6 -5 -4 -3 -2" -1 0
PanelB Top 20% intervals ofthe ex甘'emenegative returns
O K 金 l 嚕一述自γ這金1團 l
•
l.
電壓
• • • 色品 -0.1 f 至三 -0.2 -0.2 r ]ω
o E E \關 J企----A_ _ _ 一一一企---A~-1 -0.4。 3
I
i
弓-1 -0.6 。 4 L υJ -0.8 可6 -5 4 -3 -2 。 2 3 4 5 6Each 甘adingday is divided into 54 five-minute intervals from 9:00 a.m. to 1 :30 p.m. For each
interval, the return and order imbalance 缸ecomputed for each ofthe 34 stocks that is a member of
也e TSEC 50 throughout the sample period from 2/9/2002 to 31112/2004. The institutional
(individual) order imbalance for each stock is the di旺erencebetween the institutional (individual)
marketable buy and sell limit orders scaled by the order volumes of the same stock over the
trading day for that 5-minute interval. There are totally 24,360 intervaIs for each stock. Around
20% of them -the 2436 intervals of the largest 缸,d the smallest retums, separately-are then
selected. To avoid crossing day boundaries while exarnining, the events are selected from the 7th
interval (9:30-9:35 a.m.) through the 48th
70 TheL沙namicAnalysis olInvestors' Trading in the Taiwan Stock Market
First, the contemporaneous relation is stronger than the relation between the
lagged one自period returns and institutional order imbalances. In the institutional
order imbalance equation, the average coefficient on the concurrent retum is
0.530, shown in bold, and larger than the average coefficient on the lagged
one-period retum 0.080. Second, all stocks have significantly positive coefficients
on the concurrent return at the 10% level. It indicates that, although the
institutional trading positively follows the past intraday retums
,
the positivecontemporaneous relation is largely driven by the price pressure from the
concurrent institutional order submissions. These results support Sias, Starks, and
Titman (2001) that the price impact of institutional buys is not 0位et by that of
non-institutional sells.
4.3 Post-Formation Returns
If buying (selling) activity by positive-feedback 仕aders moves prices
beyond the fundam巴ntal values of stocks, then the activity has a destabilizing
effect on stock prices. Nevertheless, it is also possible that those traders can move
prices towards fundamentals if interring useful inforrnation 企om other traders
(Bikhchandani et al., 1992; Hong and Stein, 1999). In this section, we will
examine whether institutional trading activities contribute to the process of incorporating inforrnation into stock prices.
We adopt the ideas proposed by Werrners (1999) and GHT (2003), arguing
that one obvious testable implication of destabilization is that excessive
institutional net trades will be followed by stock price reversals, if the effect of
positive-feedback trading is transitory; otherwise, the traders are inforrned and the
price adjustments could be accelerated and long-lasting. To justify whether the
effect is transitory or long-lasting, we first follow the procedures similar to those
in the daily analysis to examine retums on the quintiles based on the institutional trade imbalances over the 5 days after forrnation.
Table 5 reports the post-forrnation retums. [+1, +5] represents the 5-day
cumulative return after forrnation. On day + 1, there is a monotonic relation
between stock retum and the order imbalance. The stocks with the largest
Chiao Da Management Review 101. 29 No. 1, 2009 71
on stocks with the largest institutional buying activity is 0.355%. However
,
thestock prices start to reverse 企om day +2. The difference in the day +2's returns
between the high的t and the lowest institutional trade imbalances portfolios is
-0.121 % and significant at the 1% level.在le cumulative-retum difference over
[+ 1, +5] between the two quintiles reduces to 0.007% and insignificant. In sum,
our results show that institutional trading activities only have temporary information content and have limited contribution to process of incorporating information into stock prices.
Table 5
Post-Formation Returns
portfolio Post-Formation Retums (%)
Day+l Day+2 Day+3 Day+4 Day+5 [+1,+5]
L 。 123 0.142 0.163' 0.149' 。 142 0.474" (-1.668) (1.950) (2.199) (2.058) (1.914) (2.868) 2 0.011 。.133 。.106 0.097 0.100 0.448" (0.163) (1.855) (1.495) (1.381) (1.439) (2.838) 3 (1.30.090 0.096 0.069 。 126 0.056 0.441 艸 54) (1.455) (1.03) (1.849) (0.848) (2 日 68) 4 。 123 0.060 0.090 0.018 0.088 0.384' (1.852) (0.867) (1.357) (0.283) (1.324) (2.496) H 0.355" 0.021 。.016 0.062 。 036 0.482" (4.845) (0.296) (0.222) (0.84) (0.486) (3.124) H-L 0.478" -0.121" -0.147" -0.087' -0.107' 。 .007 (10.750) (-2.645) (-3.297) (-1.978) (-2.510) (0.078)
Note: This table reports the 阻turnsover the 5 days after formation for the 5 portfolios based on the
i nstitutional trade imbalance. For each trading day, the TSEC 50 stocks are divided into
quintiles, from low to hi叭, based on the daily institutional trade imbalance. The average
stock returns for each portfolio are reported. The last row reports tM difference between the
higbest and the lowest portfolios (H-L). The t-ratios are reported in parentheses. [+1, +5]
represents 也e5-day cumulative returns 弋..indicate significance at the 5% and 1 % levels,
respectively.
4.4 Robustness Test
Even among institutions, their trading strategi巳s could be substantially
different (Dennis and Strickland, 2002; Grinblatt, Titman, and Wermers, 1995;