sustainability
Case ReportUtilizing a Novel Approach at the Fuzzy Front-End of
New Product Development: A Case Study in a
Flexible Fabric Supercapacitor
Gwo-Tsuen Jou1,* and Benjamin J. C. Yuan2,31 Department of Business and Planning, Taiwan Textile Research Institute, New Taipei City 23674, Taiwan 2 Institute of Management of Technology, National Chiao Tung University, Hsinchu 300, Taiwan;
3 Institute of Industrial Economics, Jinan University, Guangzhou 510632, China * Correspondence: [email protected]; Tel.: +886-2-2267-0321 (ext. 6000) Academic Editor: Andrew Kusiak
Received: 9 June 2016; Accepted: 27 July 2016; Published: 3 August 2016
Abstract:The fuzzy front-end plays a most crucial part in new product development (NPD), leading to the success of product development and product launch in the market. This study proposes a novel method, TTRI_MP, by combining Crawford and Di Benedetto’s model and Cooper’s model, to strengthen the management of the fuzzy front-end. The proposed method comprises four stages: market exploration and technology forecasting, idea generation and segmentation, portfolio analysis and technology roadmapping (TRM). In the first stage, SWOT was utilized to identify the key strategic areas, and the technology readiness level (TRL) was adopted to position the level of developed technologies. In the second stage, the business concepts were required to go through the viability test and customers, collaborators, competitors and company (4C). In the third stage, the Strategic Position Analysis (SPAN) and Financial Analysis (FAN) developed by IBM were employed in the portfolio analysis to screen out potential NPD projects. In the last stage, the selected NPD projects were linked with their functions and technologies in the TRM chart. The method was successfully implemented by a research team working on a flexible fabric supercapacitor at the Taiwan Textile Research Institute (TTRI).
Keywords:TRM; NPD; supercapacitor; fuzzy front-end; TRL
1. Introduction
It is generally recognized that the NPD process can be divided into three phases: fuzzy front-end (FFE) or project planning, product development and commercialization. FFE is considered as an area that offers enormous emerging opportunities for the improvement of the overall NPD process. The fuzzy front-end (FFE) has a strong impact on the success of NPD projects and determines which projects should be conducted, as the quality, costs and schedule are mainly defined in the front-end phase. However, Stevens and Burley [1] found that only 60% of NPD projects survive from the fuzzy front-end to commercialization, which might be due to the fact that NPD processes are not strictly controlled, leading to product outcomes inconsistent with market requirements.
Oliveira and Rozenfeld [2] discussed four FFE models [3–6] and emphasized that the Crawford and Di Benedetto model is the best model to adopt as it is more comprehensive and offers a more detailed explanation. An ITP method, which stands for Integrated (I) Technology Roadmapping (T) Portfolio Management (P), was thus developed, which comprises 13 activities starting from technology roadmapping (TRM) activities, followed by the ‘proposition of NPD projects’ and ending with project portfolio management (PPM) activities. However, the ITP method indicated that it was
Sustainability 2016, 8, 740 2 of 18
used for product planning rather than technology planning, as the ITP method may lack the input of technology forecasting. The activities of the front-end of NPD include idea generation, idea screening and concept developments and a three-gate FFE model to help with the front-end planning and decision making [7]. Crawford and Di Benedetto [5] defined the front-end model as three activities: opportunity identification and selection, concept generation and concept/project evaluation; while Cooper’s stage-gate system is a five-stage and five-gate process [3]. The process begins with an ideation stage, called discovery, and ends with the post-launch review. Three of the stages that happen before development begins are considered as the fuzzy front-end, which consists of ideation, scoping the project, defining the product and building the business case, which is perhaps the most critical part of stage-gate. Regardless of Crawford and Di Bendedetto’s model or Cooper’s stage-gate system, fuzzy front-end no doubt is a vital process that plays a crucial part in the model that contributes the most to a much higher success rate in the development and product launch.
Technology-based research institutes tends to focus on the performance of the R&D outcome with the innovation intensity of patents and their licensing value and pay less attention to new product development, needless to say, commercialization of the product. Therefore, the majority of technologies transferred from the research institutes to the firm, to a large extent, failed to reach the phase of product launch. Apparently, a serious missing link or gap exists between R&D outcomes and the transfer of technology applied to the product development and commercialization in the industries.
It is the objective of this study to combine the advantages of three activities addressed in Crawford and Di Bendedetto’s model and the portfolio analysis addressed in Cooper’s stage-gate system, to propose a four-stage method, TTRI_MP method: market exploration and technology forecasting, idea generation and segmentation, portfolio analysis and technology roadmapping in the fuzzy front-end process. To strengthen the technology forecasting, we used TRL developed by NASA to assess the maturity of the technology in the stage of market exploration to screen out the potential technologies to link with the product roadmap in the later stage of fuzzy the front-end process. Further, the decision check point (DCP) was made, analogous to the gate process, in the third stage of the TTRI_TM method before executing the NPD projects.
This paper is organized as follows: in Section1, the problems and purposes of the research are described. In Section2, a literature review on TRLs and technology roadmapping (TRM) is introduced. In Section3, the research methodology of the TTRI_TM method is proposed. In Section4, a case study on a flexible fabric supercapacitor is discussed. Finally, conclusions are presented in Section5.
Based on the definition of Wikipedia, a supercapacitor (SC) (sometimes ultracapacitor, formerly electric double-layer capacitor (EDLC)) is a high-capacity electrochemical capacitor with capacitance values much higher than other capacitors (but having lower voltage limits) that bridge the gap between electrolytic capacitors and rechargeable batteries. Supercapacitors are considered as an extremely attractive alternative to rechargeable batteries as they exhibit several unique features, such as rapid charge and discharge capacities, ultrahigh power delivery, exceptional life cycle and efficiency [8]. Additionally, electroactive materials can be combined with fabrics to form fabric electrodes, used as flexible electrodes [9–12]. Carbon materials are widely employed as the electrode materials of flexible supercapacitors due to their excellent mechanical and double-layer capacitive properties. Over the years, researchers have endeavored to investigate constructing supercapacitors using carbon-based materials, such as carbon nanotubes [9], activated carbon [10], carbon fibers and graphene [13].
2. Literature Review
As the tools of TRL and TRM were adopted in this study to strengthen the fuzzy front-end (FFE) in the management of technology, it might be appropriate to mention some of the literature related to the current work.
2.1. Technology Readiness Level
Technology readiness level (TRL) is a framework that has been used in many variations across industries to provide a measurement of technology maturity from idea generation (basic principles) to commercialization [14]. TRL can also be adapted to support the understanding of the capabilities and resources required to develop technologies at different stages of development. TRLs originally consisted of nine individual and distinct technology readiness levels. Tierney et al. [15] used the TRL concept to provide a more general technology review and identified a given technology’s TRL level through the administration of a simplified semi-structured technology readiness assessment (TRA) questionnaire. They used the traditional TRL scale of one through nine for the pharmaceutical landscape. This measurement system provides a common understanding of technology status and addresses the entire innovation chain. By evaluating a technology project against the parameters for each technology readiness level, one can assign a TRL rating to the project based on its stage of progress.
2.2. Technology Roadmapping
Technology roadmapping (TRM) is recognized as one of the most comprehensive tools to foster management and planning, as its multi-layered structure is able to link business directly to product and technology, and accordingly, TRM has been widely used within industry by individual firms, government organizations and consortia [16–18]. However, in practice, TRM does not describe the guidelines and details of how to make a TRM in a proper manner, and its simple concept lacks a complete methodology or theory [19]. Apparently, the development of TRM focuses more on process than theory [20], and a systematic practical structure needs to be explored [19]. Unlike a product technology map, which requires business-driven strategic planning and product specification [21], TRM for R&D purposed planning will require a considerable effort dedicated to technology selection. Designing a detailed guideline mainly for R&D planning will be helpful to future technology forecasts, and it can even be standardized to fit with firms or industrial level planning [22]; this would be very constructive and meaningful for organizations for R&D planning.
The standard T-plan, which is a fast start technology roadmapping developed by Cambridge University, is focused on product planning [23], being especially based on company-centric [24], rather than industry-oriented planning, in order to map out a plan linking market, product and technology. For an R&D-centric company or institute, the intention is to create a plan for developing future technologies [25].
R&D institutes or government-sponsored organizations, which do not produce any tangible products, mainly focus on science-technology roadmaps for their industries or certain sectors [22]. Therefore, R&D-oriented planning would require a different approach. Lee et al. [26] developed a technology roadmapping process, the so-called “TechStrategy”, for the Korean parts and materials industry for long-term R&D planning. TRM provides a structured approach to map the evolution and development of a complex system [27] and is considered as an effective, comprehensive tool for planning the future development of emerging technologies [28].
3. Research Methodology
An NPD process comprises three phases: the fuzzy front-end phase (FFE), the product development phase and the product launch phase. The Crawford and Di Benedetto front-end model [5] indicates that the fuzzy front-end phase consists of three activities: opportunity identification and selection, concept generation and concept/project evaluation. The research methodology we propose, the TTRI_MP method, which stands for Market Planning at the Taiwan Textile Research Institute, is a complementary method to the ITP method developed by Oliveira and Rozenfeld [2] in the front-end phase to strengthen the decision making control and the management of technology product development and commercialization. The TTRI_MP method is divided into four stages: market
Sustainability 2016, 8, 740 4 of 18
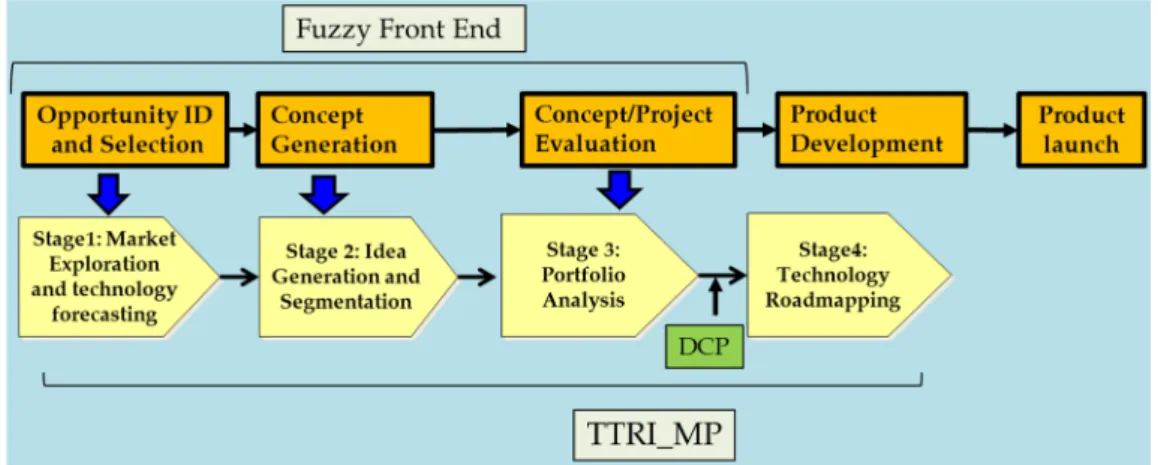
exploration and technology forecasting, idea generation and segmentation, portfolio analysis and technology roadmapping. These stages are represented in Figure1.
Sustainability 2016, 8, 740 4 of 19
Figure 1. The corresponding activities of fuzzy front-end with TTRI_MP method. DCP, decision
check point.
In the first stage, the market exploration and technology forecasting is similar to the opportunity identification and selection, but involves the selection of strategic areas that a firm intends to develop. A series of steps is involved to investigate the macro analysis by the social, technological, economic, ecological and political (STEEP) method and to examine the internal strength and weakness of the institution. SWOT is introduced to find the strategic areas on which the corporation intends to focus. TRL is utilized to forecast the potential technologies to be further explored for the NPD project or product planning. In the second stage, idea generation and segmentation are equivalent to the concept generation in the fuzzy front-end and are involved in inviting industrial experts to participate in the idea-generation process and product segmentation. In the third stage, the portfolio analysis is identical to Cooper’s project portfolio management (PPM) [29] supporting the evaluation, selection, prioritization and control of the company’s project portfolio by analyzing the strategic position of and financial analysis of each segment of the market. A decision check point (DCP) was conducted to select the potential NPD projects before moving forward to TRM. TRM is a chart to link the market needs, product features or functions, technology and resources in the fourth stage. Moreover, a case study was implemented to verify the method. 3.1. Market Exploration and Technology Forecasting
The strategic development areas lead the organizational development for the institution and are determined by the corporate mission and the commitment of top management teams to the board. The corporation should conduct technology strategic planning for future development, as shown in Figure 2. The SWOT tool can be adopted to arrange a series of educational seminars and brainstorming workshops for the corporate managing team. In the macro analysis, the information of global opportunities and threats (O/T) is collected from five aspects, i.e., social, technological, economic, ecological and political (STEEP), whereas in the micro analysis, the strengths and weaknesses (S/W) are identified by comparing the corporation with its benchmarking organizations based on organizational capabilities.
Through rational discussions and debates by providing proven data or reasons, strategies and strategic areas (SA) can be pinpointed: attack strategies by maximizing the corporation’s strengths and external opportunities(S/O); market creation strategies by utilizing the corporation’s strengths to avoid the threats (S/T); the transformation strategy by improving the corporation’s weaknesses to seize external opportunities (W/O). As a result, some strategic areas (SA) can be further aligned with the corporate mission to develop the technology roadmap. By referring to the literature survey and consulting with expert interviews, R&D topics can be further expanded for each area. The technology readiness assessment (TRA) [15] can be introduced to forecast the potential technologies for product planning in the next stage.
Figure 1. The corresponding activities of fuzzy front-end with TTRI_MP method. DCP, decision check point.
In the first stage, the market exploration and technology forecasting is similar to the opportunity identification and selection, but involves the selection of strategic areas that a firm intends to develop. A series of steps is involved to investigate the macro analysis by the social, technological, economic, ecological and political (STEEP) method and to examine the internal strength and weakness of the institution. SWOT is introduced to find the strategic areas on which the corporation intends to focus. TRL is utilized to forecast the potential technologies to be further explored for the NPD project or product planning. In the second stage, idea generation and segmentation are equivalent to the concept generation in the fuzzy front-end and are involved in inviting industrial experts to participate in the idea-generation process and product segmentation. In the third stage, the portfolio analysis is identical to Cooper’s project portfolio management (PPM) [29] supporting the evaluation, selection, prioritization and control of the company’s project portfolio by analyzing the strategic position of and financial analysis of each segment of the market. A decision check point (DCP) was conducted to select the potential NPD projects before moving forward to TRM. TRM is a chart to link the market needs, product features or functions, technology and resources in the fourth stage. Moreover, a case study was implemented to verify the method.
3.1. Market Exploration and Technology Forecasting
The strategic development areas lead the organizational development for the institution and are determined by the corporate mission and the commitment of top management teams to the board. The corporation should conduct technology strategic planning for future development, as shown in Figure2. The SWOT tool can be adopted to arrange a series of educational seminars and brainstorming workshops for the corporate managing team. In the macro analysis, the information of global opportunities and threats (O/T) is collected from five aspects, i.e., social, technological, economic, ecological and political (STEEP), whereas in the micro analysis, the strengths and weaknesses (S/W) are identified by comparing the corporation with its benchmarking organizations based on organizational capabilities.
Through rational discussions and debates by providing proven data or reasons, strategies and strategic areas (SA) can be pinpointed: attack strategies by maximizing the corporation’s strengths and external opportunities(S/O); market creation strategies by utilizing the corporation’s strengths to avoid the threats (S/T); the transformation strategy by improving the corporation’s weaknesses to seize external opportunities (W/O). As a result, some strategic areas (SA) can be further aligned with the corporate mission to develop the technology roadmap. By referring to the literature survey and
consulting with expert interviews, R&D topics can be further expanded for each area. The technology readiness assessment (TRA) [15] can be introduced to forecast the potential technologies for product planning in the next stage.
Sustainability 2016, 8, 740 5 of 19
Figure 2. SWOT analysis and strategic area. STEEP, social, technological, economic, ecological
and political.
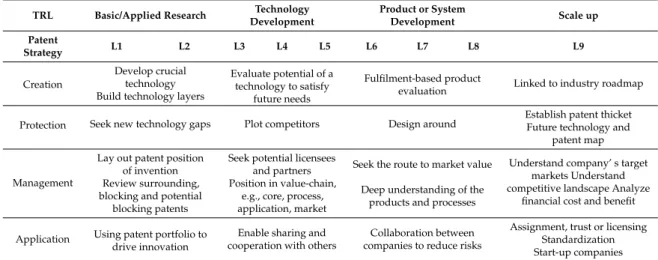
The TRL concept is utilized to provide a better technology review. This allows new product development practitioners to focus on how best an NPD project can be used to meet the needs of a new innovation. TRLs can be divided into four phases: basic/applied research, technology development, product or system development and scale up, as shown in Table 1. Basically, TRLs 1–2 are defined as the phase for basic/applied research and TRLs 3–5 as the phase for technology development to realize the proof of principle in a laboratory environment. TRLs 6–8 are the phase to realize the proof of performance in a simulated real environment, and normally alpha and beta tests and pre-production are conducted at this stage. TRL 9 is the production phase to realize the proof of performance in a real environment. The different patent strategy for each phase is described in Table 1.
Table 1. Patent strategy corresponding to different phases of TRL. TRL Basic/Applied Research Technology
Development Product or System Development Scale up Patent Strategy L1 L2 L3 L4 L5 L6 L7 L8 L9 Creation Develop crucial technology Evaluate potential of a technology to satisfy future needs Fulfilment-based product evaluation Linked to industry roadmap Build technology layers
Protection Seek new technology
gaps Plot competitors Design around
Establish patent thicket Future technology and
patent map
Management
Lay out patent position of invention
Seek potential licensees and partners
Seek the route to market value
Understand company’ s target markets Understand competitive
landscape Analyze financial cost
and benefit Review surrounding,
blocking and potential blocking patents
Position in value-chain, e.g., core, process, application, market
Deep understanding of the products and processes
Application Using patent portfolio to drive innovation
Enable sharing and cooperation with others
Collaboration between companies to reduce risks
Assignment, trust or licensing Standardization Start-up companies Figure 2. SWOT analysis and strategic area. STEEP, social, technological, economic, ecological and political.
The TRL concept is utilized to provide a better technology review. This allows new product development practitioners to focus on how best an NPD project can be used to meet the needs of a new innovation. TRLs can be divided into four phases: basic/applied research, technology development, product or system development and scale up, as shown in Table1. Basically, TRLs 1–2 are defined as the phase for basic/applied research and TRLs 3–5 as the phase for technology development to realize the proof of principle in a laboratory environment. TRLs 6–8 are the phase to realize the proof of performance in a simulated real environment, and normally alpha and beta tests and pre-production are conducted at this stage. TRL 9 is the production phase to realize the proof of performance in a real environment. The different patent strategy for each phase is described in Table1.
Table 1.Patent strategy corresponding to different phases of TRL.
TRL Basic/Applied Research Technology Development Product or System Development Scale up Patent Strategy L1 L2 L3 L4 L5 L6 L7 L8 L9 Creation Develop crucial
technology Evaluate potential of atechnology to satisfy future needs
Fulfilment-based product
evaluation Linked to industry roadmap Build technology layers
Protection Seek new technology gaps Plot competitors Design around Establish patent thicketFuture technology and patent map
Management
Lay out patent position of invention
Seek potential licensees
and partners Seek the route to market value Understand company’ s targetmarkets Understand competitive landscape Analyze
financial cost and benefit Review surrounding,
blocking and potential blocking patents
Position in value-chain, e.g., core, process, application, market
Deep understanding of the products and processes
Application Using patent portfolio to drive innovation
Enable sharing and cooperation with others
Collaboration between companies to reduce risks
Assignment, trust or licensing Standardization Start-up companies
The use of TRLs requires a TRL-level temporal assessment for each category of technology. We provided each respondent with a description and definition of the TRL technique before
Sustainability 2016, 8, 740 6 of 18
interviewing the respondents. The traditional TRL scale from 1–9 is used. The TRL scale ranges from Level 1 (the most commercial immature) through Level 9 (fully commercially developed) [15].
The five respondents were asked to rate the TRL levels of each CTE (critical technology element) of key components in the technology. The respondents were interviewed in person. We asked each respondent to rate the TRL level for each of two time periods.
3.2. Idea Generation and Segmentation
As illustrated in Figure3, the purpose of idea generation is to use the divergent and convergent approach to collect the ideas, to expand the applications of technological topics and to explore the business concepts. To extend the outcome of idea generation, new businesses aim at building up business concepts, including defining customers, value proposition, value capture, strategic control, activity scope and needed knowledge for developing new business structure, scope and method to follow up. Business concepts need to go through a viability test by means of the dimensions of the business attractiveness and risk to screen out most potential business concepts; to define potential customers, collaborators, competitors and company, so-called 4C [30], through understanding the relationship among the potential customers, collaborators and competitors, seeking for a business position to find common features of customers, to develop the strategy to contact focus group. The purpose of market segmentation is to divide different attributes of customers, to link the product with the market and targeting the right product to the right customers. The analysis of market segmentation is to find who the best customers are, what requirements the customers need and which solution can satisfy the customer’s need.
Sustainability 2016, 8, x FOR PEER REVIEW 7 of 18
The use of TRLs requires a TRL-level temporal assessment for each category of technology. We provided each respondent with a description and definition of the TRL technique before interviewing the respondents. The traditional TRL scale from 1–9 is used. The TRL scale ranges from Level 1 (the most commercial immature) through Level 9 (fully commercially developed) [15].
The five respondents were asked to rate the TRL levels of each CTE (critical technology element) of key components in the technology. The respondents were interviewed in person. We asked each respondent to rate the TRL level for each of two time periods.
3.2. Idea Generation and Segmentation
As illustrated in Figure 3, the purpose of idea generation is to use the divergent and convergent approach to collect the ideas, to expand the applications of technological topics and to explore the business concepts. To extend the outcome of idea generation, new businesses aim at building up business concepts, including defining customers, value proposition, value capture, strategic control, activity scope and needed knowledge for developing new business structure, scope and method to follow up. Business concepts need to go through a viability test by means of the dimensions of the business attractiveness and risk to screen out most potential business concepts; to define potential customers, collaborators, competitors and company, so-called 4C [30], through understanding the relationship among the potential customers, collaborators and competitors, seeking for a business position to find common features of customers, to develop the strategy to contact focus group. The purpose of market segmentation is to divide different attributes of customers, to link the product with the market and targeting the right product to the right customers. The analysis of market segmentation is to find who the best customers are, what requirements the customers need and which solution can satisfy the customer’s need.
Figure 3. The process of idea generation and customer segmentation. 4C, customers, collaborators,
competitors and company.
The main consideration is the factors and reasons that customers make up their minds, which need to be found out. The analysis of the market segment provides a more structured method to separate the group, where the market is segregated into different groups and segments. In the same segment, customers have the same demand.
3.3. Portfolio Analysis
There are four goals in portfolio management: maximizing the value of the portfolio, seeking the right balance of projects, ensuring that your portfolio is strategically aligned and making sure you do not have too many projects for your limited resources. Tools used to assess “project value” normally include NPV, expected commercial value (ECV) and scoring model, while the techniques used to portray balance are bubble diagrams and pie charts [29].
In this study, the Strategic Position Analysis (SPAN) and Financial Analysis (FAN) methods developed by IBM [31] were used to give a view of the financial implications of each segment and to provide a view of where value is created and should be created. Based on the two dimensions of the competitive position on the X-axis and market attractiveness on the Y-axis in SPAN, four generic strategies in each segment can be formed, as shown in Figure 4. Competitive position needs to consider four factors, such as market share, cost/expenses differentiation and core competence, whereas market attractiveness needs to consider four factors, such as segment size, market growth rate, potential for profit and strategic value.
Figure 3.The process of idea generation and customer segmentation. 4C, customers, collaborators, competitors and company.
The main consideration is the factors and reasons that customers make up their minds, which need to be found out. The analysis of the market segment provides a more structured method to separate the group, where the market is segregated into different groups and segments. In the same segment, customers have the same demand.
3.3. Portfolio Analysis
There are four goals in portfolio management: maximizing the value of the portfolio, seeking the right balance of projects, ensuring that your portfolio is strategically aligned and making sure you do not have too many projects for your limited resources. Tools used to assess “project value” normally include NPV, expected commercial value (ECV) and scoring model, while the techniques used to portray balance are bubble diagrams and pie charts [29].
In this study, the Strategic Position Analysis (SPAN) and Financial Analysis (FAN) methods developed by IBM [31] were used to give a view of the financial implications of each segment and to provide a view of where value is created and should be created. Based on the two dimensions of the competitive position on the X-axis and market attractiveness on the Y-axis in SPAN, four generic strategies in each segment can be formed, as shown in Figure4. Competitive position needs to consider four factors, such as market share, cost/expenses differentiation and core competence, whereas market attractiveness needs to consider four factors, such as segment size, market growth rate, potential for profit and strategic value.
Sustainability 2016, 8, 740 7 of 19
Figure 4. Four strategies for strategic position analysis.
In Block A, grow/invest in attractive segments where your company’s competitive advantage is strong, while in Block B, harvest/re-segment unattractive segments/offerings where your company's competitive advantage is strong. In Block C, avoid/exit unattractive segments/offerings where your company competitive advantage is weak. In Block D, acquire capabilities in attractive segments/offerings where your company competitive advantage is weak. The accumulative expense is regarded as the X-axis, and the accumulative benefit or company profit is taken as the Y-axis, the FAN graph is made. Based on the outcome of SPAN and FAN, each market segment will be discussed, and the portfolio strategy will be defined.
3.4. Decision Check Points
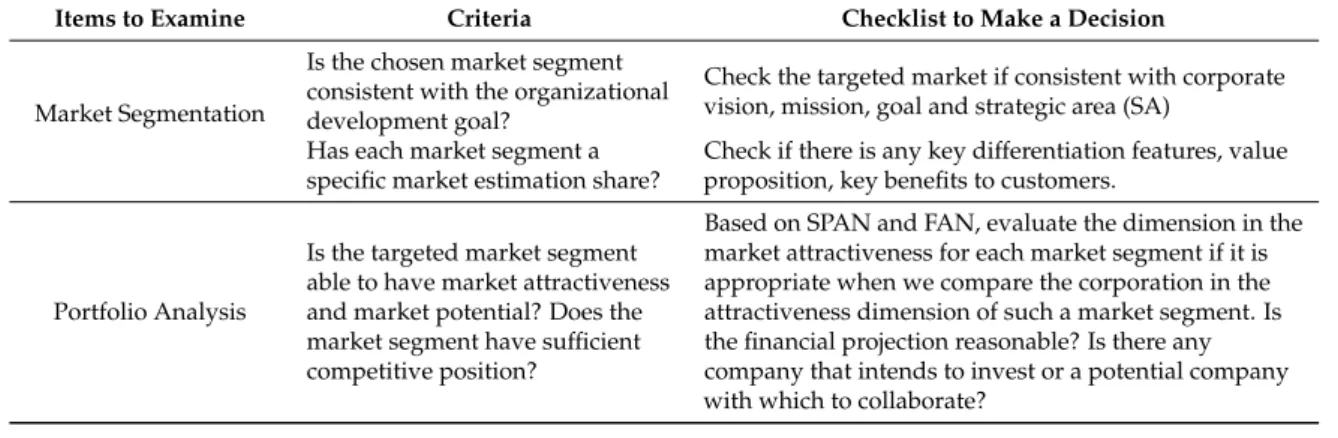
There was one DCP to be made at the stage of portfolio analysis. The top management team (TMT) should be responsible for decision making and resource allocation. The strategic planning team (SPT) is responsible for discovering and facilitating the potential research team from business departments to spin off, assisting the research team in preparing a business plan or building a business case presented to the top management team or venture capitalist (VC) to get funding support. The aim, timing and participants of the DCP checklists are described in Table 2.
Table 2. DCP checklist for market segmentation and portfolio analysis. SPAN, Strategic Position
Analysis; FAN, Financial Analysis.
Items to Examine Criteria Checklist to Make a Decision
Market Segmentation
Is the chosen market segment consistent with the organizational development goal?
Check the targeted market if consistent with corporate vision, mission, goal and strategic area (SA)
Has each market segment a specific market estimation share?
Check if there is any key differentiation features, value proposition, key benefits to customers.
Portfolio Analysis
Is the targeted market segment able to have market attractiveness and market potential?
Does the market segment have sufficient competitive position?
Based on SPAN and FAN, evaluate the dimension in the market attractiveness for each market segment if it is appropriate when we compare the corporation in the attractiveness dimension of such a market segment. Is the financial projection reasonable?
Is there any company that intends to invest or a potential company with which to collaborate?
Figure 4.Four strategies for strategic position analysis.
In Block A, grow/invest in attractive segments where your company’s competitive advantage is strong, while in Block B, harvest/re-segment unattractive segments/offerings where your company’s competitive advantage is strong. In Block C, avoid/exit unattractive segments/offerings where your company competitive advantage is weak. In Block D, acquire capabilities in attractive segments/offerings where your company competitive advantage is weak. The accumulative expense is regarded as the X-axis, and the accumulative benefit or company profit is taken as the Y-axis, the FAN graph is made. Based on the outcome of SPAN and FAN, each market segment will be discussed, and the portfolio strategy will be defined.
3.4. Decision Check Points
There was one DCP to be made at the stage of portfolio analysis. The top management team (TMT) should be responsible for decision making and resource allocation. The strategic planning team (SPT) is responsible for discovering and facilitating the potential research team from business departments to spin off, assisting the research team in preparing a business plan or building a business case presented to the top management team or venture capitalist (VC) to get funding support. The aim, timing and participants of the DCP checklists are described in Table2.
Table 2. DCP checklist for market segmentation and portfolio analysis. SPAN, Strategic Position Analysis; FAN, Financial Analysis.
Items to Examine Criteria Checklist to Make a Decision
Market Segmentation
Is the chosen market segment consistent with the organizational development goal?
Check the targeted market if consistent with corporate vision, mission, goal and strategic area (SA)
Has each market segment a specific market estimation share?
Check if there is any key differentiation features, value proposition, key benefits to customers.
Portfolio Analysis
Is the targeted market segment able to have market attractiveness and market potential? Does the market segment have sufficient competitive position?
Based on SPAN and FAN, evaluate the dimension in the market attractiveness for each market segment if it is appropriate when we compare the corporation in the attractiveness dimension of such a market segment. Is the financial projection reasonable? Is there any company that intends to invest or a potential company with which to collaborate?
Sustainability 2016, 8, 740 8 of 18
3.5. Technology Roadmapping
A roadmap usually includes a multilayer graphic representation of a plan that links technology and products with market opportunities, as depicted in Figure5[32–34]. In this study, we adopted a simplified “T-plan” [35] to draw the chart of the technology roadmap. “T-plan” offered a quick start for supporting the initiation of roadmapping and requires four workshops to complete a chart when the objective is aligned with the company’s vision. We collected most of the information generated from Stages 1–3 with regard to market and business drivers, SWOT analysis, product concepts and priority, the milestone, evolution of the product and technology.
Sustainability 2016, 8, 740 8 of 19
3.5. Technology Roadmapping
A roadmap usually includes a multilayer graphic representation of a plan that links technology and products with market opportunities, as depicted in Figure 5 [32–34]. In this study, we adopted a simplified “T-plan” [35] to draw the chart of the technology roadmap. “T-plan” offered a quick start for supporting the initiation of roadmapping and requires four workshops to complete a chart when the objective is aligned with the company’s vision. We collected most of the information generated from Stages 1–3 with regard to market and business drivers, SWOT analysis, product concepts and priority, the milestone, evolution of the product and technology.
Figure 5. Generalized technology roadmap architecture. Adapted from Phaad et al. [34].
4. A Case Study on the Development of a Flexible Fabric Supercapacitor
Taiwan Textile Research Institute (TTRI), a non-profit research organization located in New Taipei City, Taiwan, was established in 1959. TTRI has been renowned for its testing and technical assistance to small and medium-sized enterprises of textile industries and started to undertake R&D programs since 1990. It has more than 350 professional employees, of whom nearly 65% have an advanced degree. Its turnover was about USD 33 million in 2014, of which 60% was funded by government and 40% of the revenue received from private enterprise by providing contract research or industrial services.
As the government R&D funding was cut by 3%–5% annually, there is an increasing pressure for the institute to accelerate the commercialization of technologies by transferring the scalable technology products to textile manufacturers or to spin-off a company to operate the production itself. The TTRI_MP method was implemented by a TTRI R&D team who has been devoted to developing a flexible fabric supercapacitor since 2006, and the team was spun off from the TTRI in March 2012.
4.1. Market Exploration and Technology Forecasting
4.1.1. External Opportunity and Threats
When energy textiles were developed in 2006 at the TTRI, three technology alternatives of energy textiles were identified: a thin type of fabric cell, a flexible fabric supercapacitor and a solar cell. Referring to Tierney’s method [15], we analyzed the flexible supercapacitor technology set progression through the use of a TRL-based interview. We invited five professionals involved in the
Figure 5.Generalized technology roadmap architecture. Adapted from Phaad et al. [34].
4. A Case Study on the Development of a Flexible Fabric Supercapacitor
Taiwan Textile Research Institute (TTRI), a non-profit research organization located in New Taipei City, Taiwan, was established in 1959. TTRI has been renowned for its testing and technical assistance to small and medium-sized enterprises of textile industries and started to undertake R&D programs since 1990. It has more than 350 professional employees, of whom nearly 65% have an advanced degree. Its turnover was about USD 33 million in 2014, of which 60% was funded by government and 40% of the revenue received from private enterprise by providing contract research or industrial services.
As the government R&D funding was cut by 3%–5% annually, there is an increasing pressure for the institute to accelerate the commercialization of technologies by transferring the scalable technology products to textile manufacturers or to spin-off a company to operate the production itself. The TTRI_MP method was implemented by a TTRI R&D team who has been devoted to developing a flexible fabric supercapacitor since 2006, and the team was spun off from the TTRI in March 2012. 4.1. Market Exploration and Technology Forecasting
4.1.1. External Opportunity and Threats
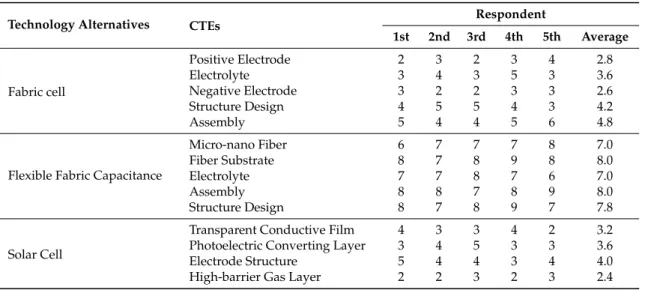
When energy textiles were developed in 2006 at the TTRI, three technology alternatives of energy textiles were identified: a thin type of fabric cell, a flexible fabric supercapacitor and a solar cell. Referring to Tierney’s method [15], we analyzed the flexible supercapacitor technology set progression through the use of a TRL-based interview. We invited five professionals involved in the supercapacitor business to act as a pilot group. We analyzed the respondents by averaging all respondents’ TRL ratings for each technology alternative (fabric cell, fabric capacitance, solar cell).
The critical technology elements (CTEs) of each technology alternative were analyzed, and their TRLs were evaluated and rated as shown in Table3. The CTE of the thin type of fabric cell was
evaluated, and the averaged TRLs were rated between TRL 2 and TRL 5; and the CTE of the solar cell was rated between TRL 2 and TRL 4; whereas those of the flexible fabric supercapacitor were rated averagely between TRL 7 and TRL 8, which is apparently closer to the market exploration. It was thus decided to take the fabric supercapacitor even further to develop technology products.
Table 3.TRL of critical technology elements (CTEs) for three technology alternatives of energy textiles.
Technology Alternatives CTEs Respondent
1st 2nd 3rd 4th 5th Average Fabric cell Positive Electrode 2 3 2 3 4 2.8 Electrolyte 3 4 3 5 3 3.6 Negative Electrode 3 2 2 3 3 2.6 Structure Design 4 5 5 4 3 4.2 Assembly 5 4 4 5 6 4.8
Flexible Fabric Capacitance
Micro-nano Fiber 6 7 7 7 8 7.0 Fiber Substrate 8 7 8 9 8 8.0 Electrolyte 7 7 8 7 6 7.0 Assembly 8 8 7 8 9 8.0 Structure Design 8 7 8 9 7 7.8 Solar Cell
Transparent Conductive Film 4 3 3 4 2 3.2
Photoelectric Converting Layer 3 4 5 3 3 3.6
Electrode Structure 5 4 4 3 4 4.0
High-barrier Gas Layer 2 2 3 2 3 2.4
TTRI’s “flexible fabric supercapacitor”, a textile with conductive fabric as the main carrier of the super capacitor, is thin and foldable (thickness less than 0.1 cm). It was selected as one of the 100 most technologically-significant products introduced into the marketplace in the 2011 R&D 100 Awards. The market planning for developing the flexible supercapacitor was conducted in August 2011 with regular meetings attended by the CEO, VP, the financial, R&D and business department directors.
This device is a new supercapacitor, which can be folded and stored. In spite of its diminutive size, the capacitor stores 10-times more energy than a standard supercapacitor. A typical capacitance can accept one farad of charge at best, but the TTRI supercapacitor can hold up to 50 farads. This invention has been patented in Taiwan and the U.S., and the product could be used in the digital camera and solar bag markets.
This product was aimed at developing an energy management system, which includes the technology of the flexible supercapacitor, and its module, design and integration for different energy supply systems (solar, wind, mechanical power). Some difficulties and threats have been perceived while developing all fordable fabric super-capacitors, such as product interface protocol, product cost competiveness, safety issue, etc.
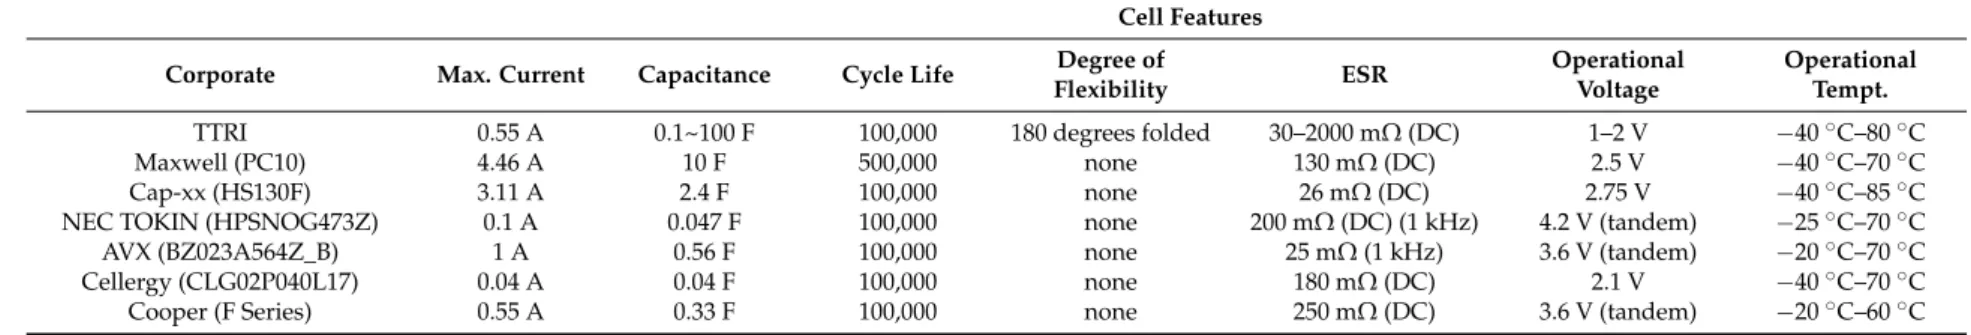
4.1.2. Analysis of Strength/Weakness of TTRI’s Organizational Development
Compared to the technology benchmark, TTRI’s supercapacitor technology possesses advantages of being foldable, having relative dimensional stability and safety (explosion prevention), as shown in Table4. However, the electric current of the supercapacitor component is relatively small, which is not comparable to the specification in the current 3C (computer, communication, consumer) market. In terms of organizational capability, since TTRI is a non-profit institution, it is trustworthy and easier to collaborate with the upstream and downstream industries and academic institutions without conflict of interest. Furthermore, with research funding support from the government, TTRI is able to get involved in the early stage of R&D, to explore the possibility of application scope. TTRI is capable of assisting companies with applying for government-funded project resources. Nevertheless, TTRI lacks marketing people who are familiar with the market trend and final customer needs. Government procurement law tends to affect the efficiency of development.
Sustainability 2016, 8, 740 10 of 18
Table 4.Comparison of TTRI’s supercapacitor with other companies. Cell Features
Corporate Max. Current Capacitance Cycle Life Degree of
Flexibility ESR
Operational Voltage
Operational Tempt.
TTRI 0.55 A 0.1~100 F 100,000 180 degrees folded 30–2000 mΩ (DC) 1–2 V ´40˝C–80˝C
Maxwell (PC10) 4.46 A 10 F 500,000 none 130 mΩ (DC) 2.5 V ´40˝C–70˝C
Cap-xx (HS130F) 3.11 A 2.4 F 100,000 none 26 mΩ (DC) 2.75 V ´40˝C–85˝C
NEC TOKIN (HPSNOG473Z) 0.1 A 0.047 F 100,000 none 200 mΩ (DC) (1 kHz) 4.2 V (tandem) ´25˝C–70˝C
AVX (BZ023A564Z_B) 1 A 0.56 F 100,000 none 25 mΩ (1 kHz) 3.6 V (tandem) ´20˝C–70˝C
Cellergy (CLG02P040L17) 0.04 A 0.04 F 100,000 none 180 mΩ (DC) 2.1 V ´40˝C–70˝C
Cooper (F Series) 0.55 A 0.33 F 100,000 none 250 mΩ (DC) 3.6 V (tandem) ´20˝C–60˝C
4.1.3. Strategic Areas for NPD Projects
Four strategic areas were found based on SWOT: (1) a flexible supercapacitor is able to fold itself without sacrificing its function and possesses a higher safe property; (2) a supercapacitor is light, thin and flexible, and it is able to engage the solar panel and system module manufacturer and the textile manufacturer, to produce renewable energy textiles; (3) the limitation of the thickness of the current foldable supercapacitor cannot go lower than 3 mm; (4) the focus on a consumer product instead of an electronic product, competitive comparison analysis (performance and price) and interface specification.
4.2. Product Proposal and Business Concepts 4.2.1. Business Concepts
A flexible fabric supercapacitor technology is the core technology of this study. The brainstorming and analysis of feasibility of the business concept will encompass this topic. There were 41 ideas of the products generated after intensive discussion and brainstorming and, mainly, on energy management packs, personal mobile products and personal protective products by 20 different fields of industrial experts and consumers from the electronics, channel, media and textile sectors. Eight business concepts finally were proposed through grouping and converging.
‚ Electric locker: easy to install and use in any public places or household doors.
‚ GPS button: fit with GPS, connect with a mobile phone, easy to locate expensive things.
‚ Emergency rescue pack: use in all kinds of inconvenient events and scenarios, such as a lifesaving pack, rescue self-travelling.
‚ Six-star diagnosis room: instant body sign measurement, in which the signal is connected to hospital inquiry and diagnosis, two-way interactive functional device.
‚ Power bank for bike: power generated by exercise on a bike, no plug, no battery replacement. ‚ Daylight fabric: roll up easily, soft and portable lamp with even lighting, which fits with any
construction and personal portable use.
‚ Audio amusement pack: a handy family movie studio, play anytime and anywhere, wireless transmission and rechargeable.
‚ Waterproof and portable computer bags: soft and easy to carry.
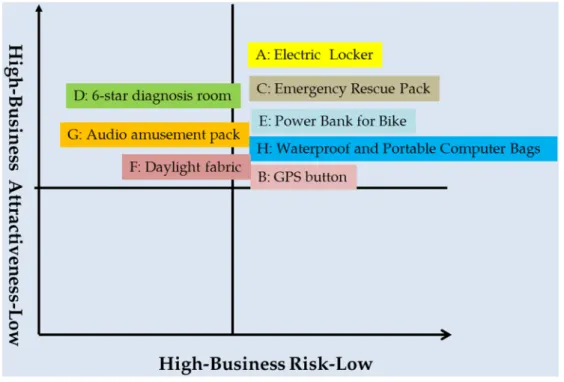
Eight business concepts were analyzed in a business viability matrix by the same group of industrial experts exhibited in Figure 6, in which the dimension of business attractiveness is in the vertical axis, while that of the risk is in the horizontal axis. Overall, electric locker, emergency rescue pack, power bank for a bike and computer bags were chosen as they are located in the area that has a higher business competiveness and lower business risk. Generally speaking, the value differentiation focuses on convenience, product design concept of human beings, which stand out with the “flexible supercapacitor” charge and discharge capability, storage capability, film and flexible design characteristics, which get rid of the traditional means of the business concept locked into the price competition stereotype. These four business concepts turned into some more substantial, realistic concepts as: electric locker, emergency rescue packs, power bank for a bike, touch panel or computer bags (soft keyboard).
Sustainability 2016, 8, 740 12 of 18
Sustainability 2016, 8, 740 13 of 19
Figure 6. Business viability matrix. 4.2.2. Analysis of the Market Segment
(1) Electric locker
The product and service value differentiation derives from two dimensions: one is for the use of consumers and the other is the features of a flexible supercapacitor, emphasizing the power charge and discharge ability, storage, thin, foldable and flexible dimensions.
(2) Emergency rescue packs
“Rescue packs” are for certain scenarios, and the “product sale price” market segment dimension is divided into four market segments for emergency needs and medical use. For different market segments, an emergency or medical pack provides the service for GPS, GPRS, blood glucose, heart beat device and solar panel or hand-held power generator.
(3) Power bank for a bike
The power bank kit for a bike regards “brand type” and “power use” as two dimensions, and these are divided into four market segments: (1) medium power user and the bike power storage demand market; (2) low power user and the market for branding bike power storage; (3) medium power user and the market for non-branding bike power storage; (4) low power user and the market for non-branding power storage.
(4) Touch panel or computer bags
The touch panel power bank kit regards the ”touch panel user type” and ”power storage function” as market dimensions, and these are divided into two market segments: (1) the market for power function , which can support the word processing function; (2) power storage can support Internet and Wi-Fi function.
Figure 6.Business viability matrix.
4.2.2. Analysis of the Market Segment (1) Electric locker
The product and service value differentiation derives from two dimensions: one is for the use of consumers and the other is the features of a flexible supercapacitor, emphasizing the power charge and discharge ability, storage, thin, foldable and flexible dimensions.
(2) Emergency rescue packs
“Rescue packs” are for certain scenarios, and the “product sale price” market segment dimension is divided into four market segments for emergency needs and medical use. For different market segments, an emergency or medical pack provides the service for GPS, GPRS, blood glucose, heart beat device and solar panel or hand-held power generator.
(3) Power bank for a bike
The power bank kit for a bike regards “brand type” and “power use” as two dimensions, and these are divided into four market segments: (1) medium power user and the bike power storage demand market; (2) low power user and the market for branding bike power storage; (3) medium power user and the market for non-branding bike power storage; (4) low power user and the market for non-branding power storage.
(4) Touch panel or computer bags
The touch panel power bank kit regards the ”touch panel user type” and ”power storage function” as market dimensions, and these are divided into two market segments: (1) the market for power function , which can support the word processing function; (2) power storage can support Internet and Wi-Fi function.
Sustainability 2016, 8, 740 13 of 18
4.3. Analysis of the Product Portfolio
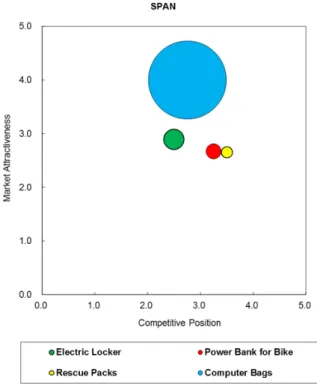
We used four factors: segment size, market growth, potential for profit and strategic value, to represent market attractiveness and converted them into score rating scale from 1–5, as shown in Table5. We used another three factors: market share, cost/expense differentiation and core competence, to represent competitive position and converted them into the score rating scale from 1–5, as shown in Table6. Based on the two dimensions of competitive position on the X-axis and market attractiveness on the Y-axis, the SPAN of four chosen NPD projects can be seen in Figure7.
4.3. Analysis of the Product Portfolio
We used four factors: segment size, market growth, potential for profit and strategic value, to represent market attractiveness and converted them into score rating scale from 1–5, as shown in Table 5. We used another three factors: market share, cost/expense differentiation and core competence, to represent competitive position and converted them into the score rating scale from 1–5, as shown in Table 6. Based on the two dimensions of competitive position on the X-axis and market attractiveness on the Y-axis, the SPAN of four chosen NPD projects can be seen in Figure 7.
According to the market segment analysis, there were four potential products that had been identified. Four potential customers were further to be analyzed by the dimensions of product competitiveness and market attractiveness. Overall, as shown in Figure 7, four NPD projects are all located in Block A, which is the area for the grow and invest strategy. In particular, computer bags seem to have the highest market attractiveness among the four projects. In terms of product competiveness, the electric locker and power bank for a bike manufacturers appear to have a higher competitive position.
Figure 7. SPAN of four NPD projects. Table 5. Market attractiveness of four NPD projects.
Factors
NPD Projects Segment Size Market
Growth Rate
Potential for Profit
Strategic
Value Score (NTD MN) Rating (%) Rating Rating Rating Rating
Electric Locker 4.30 0.34 5% 1.25 5 5 2.90
Rescue Packs 1.30 0.10 10% 2.50 4 4 2.65
Power Bank for Bike 2.33 0.18 10% 2.50 4 4 2.67
Computer Bags 63.30 5.00 20% 5.00 2 4 4.00
Max/5 12.66 4% NTD MN: New Taiwan Dollar Million. Table 6. Competitive position of four NPD projects.
Figure 7.SPAN of four NPD projects.
Table 5.Market attractiveness of four NPD projects.
NPD Projects
Factors Segment Size Market Growth
Rate
Potential for Profit
Strategic
Value Score
(NTD MN) Rating (%) Rating Rating Rating Rating
Electric Locker 4.30 0.34 5% 1.25 5 5 2.90
Rescue Packs 1.30 0.10 10% 2.50 4 4 2.65
Power Bank for Bike 2.33 0.18 10% 2.50 4 4 2.67
Computer Bags 63.30 5.00 20% 5.00 2 4 4.00
Max/5 12.66 4%
NTD MN: New Taiwan Dollar Million.
Table 6.Competitive position of four NPD projects.
NPD Projects
Factors Market Share Cost/Expense
Differentiation
Core
Competencies Score
Electric Locker 1 4 2 2.33
Rescue Packs 4 4 3 3.67
Power Bank for Bike 3 4 3 3.33
Sustainability 2016, 8, 740 14 of 18
According to the market segment analysis, there were four potential products that had been identified. Four potential customers were further to be analyzed by the dimensions of product competitiveness and market attractiveness. Overall, as shown in Figure7, four NPD projects are all located in Block A, which is the area for the grow and invest strategy. In particular, computer bags seem to have the highest market attractiveness among the four projects. In terms of product competiveness, the electric locker and power bank for bike manufacturers appear to have a higher competitive position.
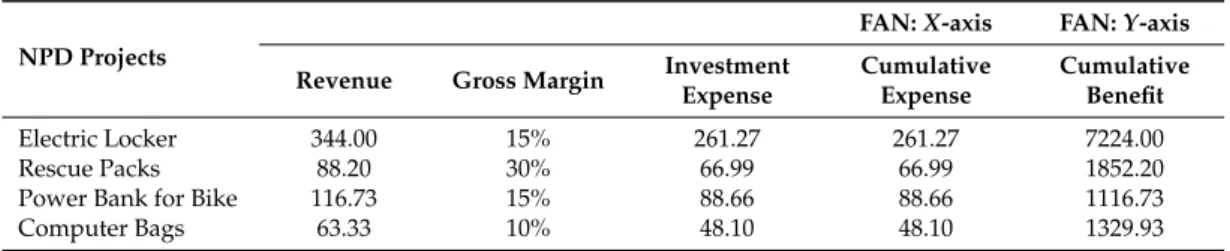
Despite the fact that the computer bag was projected to have the largest market potential in the long-term estimation, it was observed that TTRI’s supercapacitor had a relatively weaker competiveness in the area. In terms of FAN, Table7estimates revenue, gross margin, investment expense, cumulative expense, and cumulative benefit. All the values were plotted in Figure8, it can be seen that the electric locker exhibits having the best business opportunity both in revenue and gross margin, and the military and fire emergency rescue pack comes second, whereas the computer bags do not show any business opportunity being activated as they appear to have the lowest revenue and gross margin, although the investment expense is relatively lower than the other.
Sustainability 2016, 8, 740 15 of 19
NPD Projects
Factors Market Share Cost/Expense
Differentiation
Core
Competencies Score
Electric Locker 1 4 2 2.33
Rescue Packs 4 4 3 3.67
Power Bank for Bike 3 4 3 3.33
Computer Bags 1 4 3 2.67
Despite the fact that the computer bag was projected to have the largest market potential in the long-term estimation, it was observed that TTRI’s supercapacitor had a relatively weaker competiveness in the area. In terms of FAN, Table 7 estimates revenue, gross margin, investment expense, cumulative expense, and cumulative benefit. All the values were plotted in Figure 8, it can be seen that the electric locker exhibits having the best business opportunity both in revenue and gross margin, and the military and fire emergency rescue pack comes second, whereas the computer bags do not show any business opportunity being activated as they appear to have the lowest revenue and gross margin, although the investment expense is relatively lower than the other.
Overall, the foldable supercapacitor technology could enhance the total value of textile applications, resulting in the improvement of higher value-added products. Products with lower investment will have the first priority to develop, such as the rescue packs, and the power bank for bike. Thus, the targeted product portfolio will focus on the electric locker, military and fire use rescue pack and power bank for a bike.
Table 7. FAN for four NPD projects. Unit: NTD million.
FAN: X-axis FAN: Y-axis Revenue Gross Margin Investment Expense Cumulative Expense Cumulative Benefit Electric Locker 344.00 15% 261.27 261.27 7224.00 Rescue Packs 88.20 30% 66.99 66.99 1852.20 Power Bank for Bike 116.73 15% 88.66 88.66 1116.73 Computer Bags 63.33 10% 48.10 48.10 1329.93
Figure 8. FAN of four NPD projects. Figure 8.FAN of four NPD projects.
Table 7.FAN for four NPD projects. Unit: NTD million.
NPD Projects
FAN: X-axis FAN: Y-axis Revenue Gross Margin Investment
Expense Cumulative Expense Cumulative Benefit Electric Locker 344.00 15% 261.27 261.27 7224.00 Rescue Packs 88.20 30% 66.99 66.99 1852.20
Power Bank for Bike 116.73 15% 88.66 88.66 1116.73
Computer Bags 63.33 10% 48.10 48.10 1329.93
Overall, the foldable supercapacitor technology could enhance the total value of textile applications, resulting in the improvement of higher value-added products. Products with lower investment will have the first priority to develop, such as the rescue packs, and the power bank for bike. Thus, the targeted product portfolio will focus on the electric locker, military and fire use rescue pack and power bank for a bike.
4.4. Decision Check Point for Market Segmentation and Portfolio Analysis
There was one DCP to be made by the TMT (top management team) at TTRI. The first one was related to ranking four NPD projects, which were screened out from eight business concepts. The DCP information was prepared by the SPT (strategic planning team) based on the FAN and SPAN results, along with the decision sheet designed in Table2. The top management team (TMT) was formed by the CEO, two VPs and two program directors at TTRI. Basically, the supercapacitor is a key component to make the EDLC (electric double-layer capacitor) for the four different product applications.
Based on the criteria and checklists in Table 2, the ranking sequence for these four NPD projects is as follows: EDLC for emergency rescue pack, for bike, for electric locker and computer bags, respectively.
4.5. Technology Roadmapping
As addressed earlier, a simplified T-plan was used to chart a roadmap for flexible fabric supercapacitors. Three NPD projects, i.e., electric double-layer capacitors (EDLCs) for the bike power bank, electric lockers and emergency rescue packs, have been determined at the stage of portfolio analysis and DCP. The market drivers have been identified as convenience, safe, thin, flexible, fast charging and discharging. The common product features for three NPD projects were operational voltage, capacitance capacity, thickness and certification. Technology solutions, which met with the product features, were electrolyte and process technology. TTRI’s foldable or flexible supercapacitor had to start off a water-based electrolyte to make the material, supported by process technology to stabilize the production capacity and quality. The water-based electrolyte used water sodium solution as the power storage substance, offering the advantages of being environmentally friendly and safety, in addition to providing a wider range of operational temperatures. However, the disadvantage of water-based electrolyte is the low operational voltage, which needs to be raised by shifting to the solid state of electrolyte. Coating and modulation will be indispensable supporting process technologies in producing three products (EDLC modules for the bike, electric lockers and emergency rescue packs) or newly-explored markets. A simplified T-plan chart to link the three layers of market needs, product features and technologies is illustrated in Figure9.
Sustainability 2016, 8, 740 17 of 19
Figure 9. A simplified T-plan for the flexible supercapacitor. EDLC, electric double-layer capacitor.
5. Conclusions
This paper proposed a four-stage process, TTRI_MP, to strengthen Crawford and Di Benedetto’s and Cooper’s model in the front-end of NPD, by introducing the technology readiness level (TRL) to forecast technology development and technology roadmapping (TRM) to give a whole picture of the business development of NPD projects. The method was employed by a TTRI internal research team who spun off to scale up the production of the flexible supercapacitor. Over the past decade, research institutes tended to adopt a technology-driven approach to transfer their R&D outcomes to the manufacturers for them to scale up technology-product development and sell products on the market. However, the success rate had been extremely low over the years for the technologies to turn into commercialized products due to the fact that the front-end of NPD had not been managed properly and efficiently.
5.1. Advantages of Using the TTRI_MP Method
It was observed that there are four advantages of using the TTRI_MP method:
1. Not only can an R&D department in a firm consider expanding their new business from their existing technologies, but a research institute, who usually lacks business and marketing experience, can use this method to assess the emerging technologies for potential products to commercialize.
2. To overcome the some limitations where the workshop or brainstorming processes rely on the intuitive knowledge of participating experts, which might be subjective and biased. Some existing tools can be employed to screen the technologies and product concepts based on market and customer needs.
3. To supplement the portfolio management in Cooper’s stage-gate process, we set up a DCP for top management staff at the stage of portfolio analysis, to evaluate the plan completeness. 4. It was found that the results were quite satisfactory, consistent with the corporate vision and
goal; apart from corresponding to the plan and schedule in this study, the pilot scale for the plant was set up at the TTRI in 2011. Three researchers were spun off from TTRI to form a company, Litnertex, in 2012, and entered into the TTRI incubation center. This combined method has strengthened the decision making process by top management staff.
Sustainability 2016, 8, 740 16 of 18
Resources required to complete a business development are divided into two phases: the first phase was to construct a pilot-scale plant at the TTRI commencing in 2011 aiming to expand the pilot scale of production from the development stage, so that the product improvement and stability can be analyzed before formal production was put into practice. The pilot plant needed to invest around NTD 10 million. The second phase of business development was to spin-off a company in 2012 by taking over from the pilot plant to expand the production line, which produced EDLCs for the bike power bank, electric lockers and military/fire emergency rescue packs. The capital investment was estimated to attain NTD 27.5 million.
5. Conclusions
This paper proposed a four-stage process, TTRI_MP, to strengthen Crawford and Di Benedetto’s and Cooper’s model in the front-end of NPD, by introducing the technology readiness level (TRL) to forecast technology development and technology roadmapping (TRM) to give a whole picture of the business development of NPD projects. The method was employed by a TTRI internal research team who spun off to scale up the production of the flexible supercapacitor. Over the past decade, research institutes tended to adopt a technology-driven approach to transfer their R&D outcomes to the manufacturers for them to scale up technology-product development and sell products on the market. However, the success rate had been extremely low over the years for the technologies to turn into commercialized products due to the fact that the front-end of NPD had not been managed properly and efficiently.
5.1. Advantages of Using the TTRI_MP Method
It was observed that there are four advantages of using the TTRI_MP method:
1. Not only can an R&D department in a firm consider expanding their new business from their existing technologies, but a research institute, who usually lacks business and marketing experience, can use this method to assess the emerging technologies for potential products to commercialize.
2. To overcome the some limitations where the workshop or brainstorming processes rely on the intuitive knowledge of participating experts, which might be subjective and biased. Some existing tools can be employed to screen the technologies and product concepts based on market and customer needs.
3. To supplement the portfolio management in Cooper’s stage-gate process, we set up a DCP for top management staff at the stage of portfolio analysis, to evaluate the plan completeness. 4. It was found that the results were quite satisfactory, consistent with the corporate vision and
goal; apart from corresponding to the plan and schedule in this study, the pilot scale for the plant was set up at the TTRI in 2011. Three researchers were spun off from TTRI to form a company, Litnertex, in 2012, and entered into the TTRI incubation center. This combined method has strengthened the decision making process by top management staff.
5.2. Constraints/Limitations of the Study
As the selection of the case study was from a spun off small company at the TTRI, it may limit the generalization of the research results to other medium or larger companies, which normally have a more complicated organizational structure and need a larger group of managing staff to form the TMP (top management team) to conduct DCP, leading to a longer time required to reach consensus. A start-up company may not have sufficient financial report information to disclose and validate the applicability of the TTRI_MP method proposed in this study.
5.3. Recommendations of Future Work
Due to the constraints of the time and scope of this research, some more investigations that could be further conducted to complement this study are:
‚ Development of case studies in different types of companies that have a discrepancy in organizational characteristics and product ranges.
‚ Application of the TTRI_MP method to support the front-end of the innovation process, where the function of technology planning and roadmapping will may a more important role than in the NPD process.
‚ Application of the scenario planning approach to improve the forecasting of market and technology trends.
Acknowledgments:The authors are very grateful to the IBM consultants in Taiwan for their guidance in using the tools and to the TTRI colleagues in the flexible superconductor’s team for sharing their research information.
Author Contributions:Gwo-Tsuen Jou and Benjamin J.C. Yuan proposed the idea of the case study on a flexible fabric superconductor, Gwo-Tsuen Jou was responsible for collecting the information from the research team at the TTRI, conducting the research, analyzed the data, and wrote the paper.
Conflicts of Interest:The authors declare no conflict of interest. References
1. Stevens, G.A.; Burley, J. Piloting the rocket of radical information. Res. Technol. Manag. 2003, 46, 16–25. 2. Oliveira, M.G.; Rozenfeld, H. Integrating technology roadmapping and portfolio management at the
front-end of new product development. Technol. Forecast. Soc. Chang. 2010, 77, 1339–1354. [CrossRef] 3. Cooper, R.G. Winning at New Products: Acceleratiing the Process from Idea to Launch, 3rd ed.; Basic Books:
New York, NY, USA, 2001.
4. Koen, P.; Ajamian, G.; Burkart, R.; Clamen, A.; Davidson, J.; D’Amore, R.; Elkins, C.; Herald, K.; Incorvia, M.; Johnson, A.; et al. Providing clarity and a common language to the “fuzzy front-end”. Res. Technol. Manag.
2001, 44, 46–55.
5. Crawford, M.; di Benedetto, A. New Product Management; McGraw Hill/Irwin: New York, NY, USA, 2015. 6. Clark, K.B.; Wheelwright, S.C. Managing New Product and Process Development; The Free Press: New York, NY,
USA, 1993.
7. Russel, R.K.; Tippett, D.D. Critical success factors for the fuzzy front-end of innovation in the medical device industry. EMJ Eng. Manag. J. 2008, 20, 36–43. [CrossRef]
8. Zhang, L.L.; Zhou, R.; Zhao, X.S. Graphene-based materials as supercapacitors electrodes. J. Mater. Chem.
2010, 20, 5983–5992. [CrossRef]
9. Pasta, M.; La Mantia, F.; Hu, L.; Deshazer, H.D.; Cui, Y. Aqueous supercapacitors on conductive cotton. Nano Res. 2010, 3, 452–458. [CrossRef]
10. Jost, K.; Perez, C.R.; McDonough, J.K.; Presser, V.; Heon, M.; Dion, G.; Gogotsi, Y. Carbon coated textiles for flexible energy storage. Energy Environ. Sci. 2011, 4, 5060–5067. [CrossRef]
11. Liu, W.W.; Yan, X.B.; Lang, J.W.; Peng, C.; Xue, Q.J. Flexible and conductive composite electrode based on graphene sheets and cotton cloth for supercapacitor. J. Mater. Chem. 2012, 22, 17245–17253. [CrossRef] 12. Hu, L.; Pasta, M.; la Mantia, F.; Cui, L.; Jeong, S.; Deshazer, H.D.; Choi, J.W.; Han, S.M.; Cui, Y. Stretchable,
porous, and conductive energy textiles. Nano Lett. 2010, 10, 708–714. [CrossRef] [PubMed]
13. Weng, Z.; Su, Y.; Wang, D.W.; Li, F.; Du, J.; Cheng, H.M. Graphene-Cellulose paper flexible supercapacitors. Adv. Energy Mater. 2011, 1, 917–922. [CrossRef]
14. Nakamura, H.; Kajikawa, Y.; Suzuki, S. Multi-level perspectives with technology readiness measures for aviation innovation. Sustain. Sci. 2013, 8, 87–101. [CrossRef]
15. Tierney, R.; Hermina, W.; Walsh, S. The pharmaceutical technology landscape: A new form of technology roadmapping. Technol. Forecast. Soc. Chang. 2013, 80, 194–211. [CrossRef]

![Figure 5. Generalized technology roadmap architecture. Adapted from Phaad et al. [34]](https://thumb-ap.123doks.com/thumbv2/9libinfo/7984340.159213/8.892.205.691.331.611/figure-generalized-technology-roadmap-architecture-adapted-phaad-et.webp)