Vibrational fine structures revealed by the real-time vibrational phase and amplitude
in MEH-PPV using few cycle pulses
Jun Zhang,1 Zhuan Wang,1,2and Takayoshi Kobayashi1,2,3,4
1Department of Applied Physics and Chemistry and Institute for Laser Science, The University of Electro-Communications,
1-5-1 Chofugaoka, Chofu, Tokyo 182-8585, Japan
2Ultrashort Pulse Laser Project, ICORP, JST, 4-1-8 Honcho, Kawaguchi, Saitama 332-0012, Japan 3Department of Electrophysics, National Chiao Tung University, 1001 Ta Hsueh Road, Hsin-Chu 3005, Taiwan
4Institute of Laser Engineering, Osaka University, 2-6 Yamada-Oka, Suita, Osaka 565-0971, Japan
共Received 19 December 2007; revised manuscript received 9 March 2008; published 9 April 2008兲 It was found that the vibronic transition peaks hidden in a featureless spectrum of induced absorption could be clearly revealed by utilizing the spectra of phases and amplitudes of the molecular vibrational modes. Some of the peaks were also found in a second derivative of a transition spectrum integrated over a delay time from 100 to 700 fs. This is because of the localization of a wave packet in a limited region along the potential multimode hypersurfaces. The transition energy of an induced absorption or an induced emission corresponds to some localized point共space兲 on the potential hypersurface to which the wave packets visit with some fixed phases.
DOI:10.1103/PhysRevB.77.153202 PACS number共s兲: 78.47.⫺p, 33.70.Ca, 36.20.Ng
Properties such as the plasticity, chemical modification capability, and semiconductivity1–4 make conjugated poly-mers remarkably excellent candidates for electro-optical de-vice applications. Therefore, research activities on the effi-ciency and the dynamics of elementary excitations in conjugated polymers have recently been stimulated by the potential application in optoelectronic devices.5–8In
particu-lar, considerable progress has been made in the development of electroluminescent devices based on poly共arylenevi-nylene兲s in recent years.9,10 One of the most important and
extensively studied conjugated polymers is poly-关2-methoxy, 共5-2⬘-ethyl-hexyloxy兲-p-phenylenevinylene兴 共MEH-PPV兲 because of its high electroluminescence quantum efficiency and solubility in common solvents.
Through the extensive study of the mechanism of a lumi-nescence process in MEH-PPV, it was found that it could be described in terms of an exciton.11–13A detailed
understand-ing of the dynamics of photoexcitations in MEH-PPV is highly desirable for practical reasons because they are related to the radiationless relaxation, which determines lumines-cence efficiency. In order to clarify the mechanism of the fast radiationless decay dynamics, it is most straightforward to utilize pulse lasers in transient nonlinear spectroscopy tech-niques such as absorption, gain, grating, and stimulated Ra-man scattering.14–16When ultrafast pulse duration is shorter
than molecular vibrational periods, the vibrational dynamics can also be studied as described in previous papers.17–19
Pulse lasers with pulse durations of several tens to hun-dreds of femtoseconds were used to study MEH-PPV.20–22
However, no study has been reported on the coherent mo-lecular vibration induced by an impulsive excitation using a short enough pulse to excite coherent vibration.
In this Brief Report, the dependence of vibrational ampli-tude on probe photon energy is discussed for the wavelength range, where the intensity of ground-state absorption is neg-ligibly small. From this, a vibrational spectroscopic structure hidden in a broad induced absorption spectrum could be re-vealed by the phase information of the molecular vibration.
This phase information cannot be obtained by conventional time-resolved共TR兲 vibrational spectroscopies such as TR, IR absorption, and TR Raman scattering.
A noncollinear optical parametric amplifier23–25 共NOPA兲
was used as a light source of the pump-probe experiment, as described in our previous papers.17–19Several features of the
system are described below. The pump source of this system is a commercially supplied regenerative amplifier 共Spectra Physics, Spitfire兲. Its central wavelength, pulse duration, rep-etition rate, and average output power were 790 nm, 50 fs, 5 kHz, and 800 mW, respectively. The output pulse from the NOPA was compressed with a compressor composed of a pair of prisms and chirp mirrors. The pulse duration was 5.7 fs and covered the spectral range from 520 to 750 nm. The pulse energies of the pump and probe were about 35 and 5 nJ, respectively. A 128-channel lock-in amplifier was used as a phase-sensitive broadband detector.19Chloroform solutions
of MEH-PPV were spin-coated onto quartz plates to form 0.5– 1.0 m thick films. All the experiments were per-formed at room temperature共293⫾1 K兲.
The pump-probe experiment of a MEH-PPV sample film was performed with a probe delay time from −200 to 1800 fs. The absorbance change induced by the pump is probed as a function of probe delay time. The curve of the absorbance change versus probe delay time is called real-time共vibration兲 trace or vibration real-time spectrum.
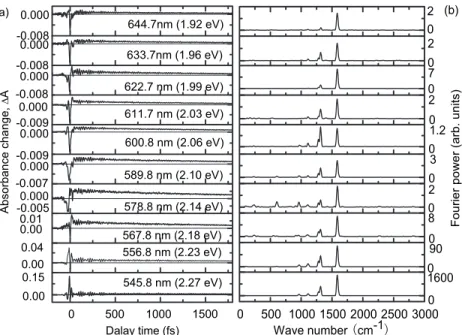
Figures1共a兲and 1共b兲 show the real-time traces and fast Fourier-transform 共FFT兲 power spectra of the traces calcu-lated for the time range from 50 to 1800 fs, respectively, at ten typical, different wavelengths. The time range between 0 and 50 fs was not used for the FFT calculation to avoid the interference between the scattered pump and probe pulses.
In the power spectra shown in Fig.1共b兲, there are several intense peaks at 961, 1278, 1315, and 1587 cm−1. In order to clarify the mechanism of the modulation of transition prob-ability due to the molecular vibration, the probe photon en-ergy dependence of the vibrational amplitude and phase are shown in Fig.2. Among all of the modes, there are intense PHYSICAL REVIEW B 77, 153202共2008兲
amplitude ranges in the probe photon energy higher than 2.2 eV. In our previous paper, the intense amplitude range ex-tending in the ground-state absorption spectral region was studied in detail and was explained in terms of the ground-state wave packet induced by the time-dependent Franck– Condon共FC兲 effect and non-Condon 共NC兲 effect.26,27FC and
NC contribute to the spectral dependence described by the first derivative and the zeroth and second derivatives, respec-tively, of the ground-state absorption spectrum.
Here, in this Brief Report, we would like to discuss in detail the probe photon energy dependence of the vibrational amplitude of the most intense modes with frequencies of 1278, 1315, and 1587 cm−1 in the spectral range below the absorption edge.
Figures2共a兲–2共c兲show the probe photon energy 共wave-length兲 dependence of vibrational phases and amplitudes of the vibrational modes with frequencies of 1587, 1315, and 1278 cm−1, respectively. It can be found in Fig.2共a兲that the amplitude and phase spectra have a distinct structure, with the peaks and valleys at nearly the same photon energies. Similar features also exist in Figs.2共b兲and2共c兲. TableIlists these extrema appearing in the amplitude and phase spectra corresponding to modes of 1587, 1315, and 1278 cm−1, as shown in Fig.2. The probe photon energy corresponding to the distance between the neighboring peaks and valleys are nearly equal. This means that these extrema can correspond to the peaks and/or valleys forming a vibrational progression in the time-resolved spectrum. Peaks may correspond to the excited state absorption peaks, and valleys may correspond to the peaks of induced emission. In the latter case, a nega-tive absorbance due to a bleaching induced by a ground-state depletion can be neglected because of the absence of a suf-ficiently intense fluorescence in this range.
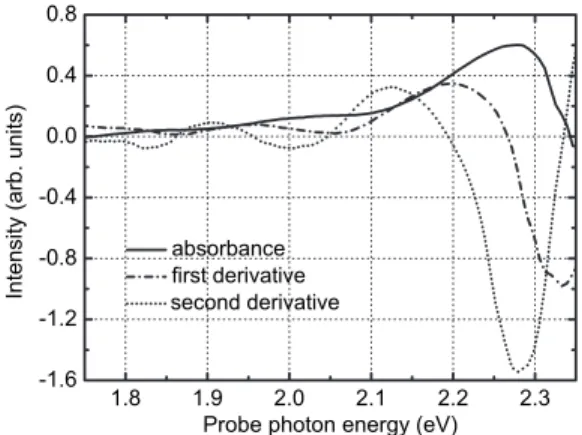
Figure 3 shows the time-resolved absorption spectra of the sample integrated over the delay time ranging from 100 to 700 fs and its first and second derivatives with respect to photon energy. It can be observed that the time-resolved spectrum does not have a clear structure due to either a vi-brational progression or other electronic states. However, it
is known that a faint feature in the spectrum can be resolved by calculating its second derivative. The peak of the second derivative can either be the peak or valley hidden in the original 共zeroth derivative兲 spectrum. Therefore, it can be found in Fig.3that the second derivative calculated for the delay time integrated time-resolved spectrum has a fine structure composed of several peaks and valleys. These ex-trema共peaks and valleys兲 are also listed in TableI.
FIG. 1. Real-time vibrational spectra and FFT power spectra of molecular vibration at ten dif-ferent probe wavelengths.共a兲 The change in the absorbance as a function of pump-probe delay time at various probe photon energies.共b兲 The FFT power spectra of real-time vibrational spec-tra at the corresponding probe photon energies.
FIG. 2. FFT amplitude共solid curve; the part of the photon en-ergy smaller than 2.21 eV is magnified ten times for details兲 and phase共dashed curve兲 corresponding to the modes 共a兲 1587 cm−1,
共b兲 1315 cm−1, and共c兲 1278 cm−1, respectively.
BRIEF REPORTS PHYSICAL REVIEW B 77, 153202共2008兲
From TableI, there are extrema共peaks and valleys兲 com-monly found in the second derivative of the transient absorp-tion spectrum共d2A/d2兲, and phase 共⌽兲 and amplitude 共A兲 spectra of the molecular vibration. For the 1587 cm−1mode, there are four extrema in the second derivative of the time-resolved absorption spectrum. They are located at 1.82, 1.91, 2.00, and 2.12 eV. These highest energy peaks appear within the vicinity of 0.04 eV of the three relevant extrema. The phase and amplitude spectra have common extrema at around 2.00 and 2.05 eV. The former also exists in the sec-ond derivative. In the case of the 1315 and 1278 cm−1 modes, the extremum near 2.00 eV exists in all of the spectra of the second derivative, the phase, and the amplitude. There are four common extrema among those of the second deriva-tive, phase共⌽兲, and amplitude 共A兲 spectra for the 1278 cm−1 mode.
The extrema found in the second derivative have equal distances of about 0.09 eV. This may be related to the peaks in the integrated absorption spectra shown in Fig.3, which may contain a vibrational progression of 1440 cm−1
corre-sponding to 0.18 eV, which is twice the value of 0.09 eV. Further study is in progress to analyze the absorption phase of the vibrational modes to clarify the origin of these peaks. The exact assignment of these peaks is not easy at present, but they are considered to be vibronic transitions not clearly detected in the time-resolved spectra. Some of them could actually be found in the time-resolved spectra by utilizing the second derivative.
In conclusion, we could find the vibronic structure and progression hidden in the featureless spectrum of an induced absorption by utilizing the spectra of phases and amplitudes of the molecular vibrational modes. This appears because of the localization of the wave packet along the potential mul-timode hypersurfaces. The transition energy of the induced absorption or induced emission corresponds to some local-ized point 共space兲 on the hypersurface, to which the wave packets visit with some fixed phases. The method comple-ments the second derivative method of a transient absorption spectrum. By utilizing the data taken by this method, the structure of potential hypersurfaces may be constructed by a detailed analysis of the time-resolved spectrum and the spec-tra of phase and amplitude of various vibrational modes ap-pearing in the Fourier power spectra of real-time traces.
This work was partly supported by the 21st Century COE program on “Coherent Optical Science” and by a grant from the Ministry of Education共MOE兲 of Taiwan under the ATU Program at the National Chiao Tung University. A part of this work was performed under the joint research project of the Institute of Laser Engineering, Osaka University under Contract No. B1-27.
1L. J. Rothberg and A. J. Lovinger, J. Mater. Res. 11, 3174
共1996兲.
2F. Hide, M. A. Díaz-García, B. J. Schwartz, and A. J. Heeger,
Acc. Chem. Res. 30, 430共1997兲.
3R. H. Friend, R. W. Gymer, A. B. Holmes, J. H. Burroughes, R.
N. Marks, C. Talian, D. D. C. Bradley, D. A. dos Santos, J. L.
Brédasa, M. Lodlung, and W. R. Salaneck, Nature 共London兲 397, 121共1999兲.
4G. A. M. Sáfar, F. A. C. Oliveira, L. A. Cury, A. Righi, P. L. M.
Barbosa, P. Dieudonné, and F. S. Lameiras, J. Appl. Polym. Sci. 102, 5620共2006兲.
5T. Kobayashi, Nonlinear Optics of Organics and Semiconductors
TABLE I. The extrema of the second derivatives共2ndD兲 of the integrated time-resolved spectrum with respect to the probe delay time over 100–700 fs, the vibrational phase共⌽兲 with respect to the zero probe delay time, and the amplitude共A兲 of the molecular vi-brations corresponding to the modes of 1587, 1315, and 1278 cm−1, respectively.
Mode共cm−1兲
2ndD
extrema共eV兲 ⌽ extrema 共eV兲 A extrema 共eV兲
1587 1.82 1.86 1.91 1.92 2.00 2.01 1.99 2.05 2.05 2.12 2.11 1315 1.82 1.88 1.91 1.92 2.00 2.00 1.98 2.05 2.04 2.12 2.15 1278 1.82 1.87 1.87 1.91 1.92 1.91 2.00 2.00 1.98 2.02 2.03 2.09 2.12 2.14
FIG. 3. Absorbance change 共solid curve兲, its first derivative 共dash-dotted curve兲, and second derivative 共dotted curve兲.
BRIEF REPORTS PHYSICAL REVIEW B 77, 153202共2008兲
共Springer, Berlin, 1989兲.
6S. Etemad and Z. G. Soos, in Spectroscopy of Advanced
Mate-rials, edited by R. J. H. Clark and R. E. Hester共Wiley, New
York, 1991兲.
7R. F. Mahrt, T. Pauck, U. Lemmer, U. Siegner, M. Hopmeier, R.
Hennig, H. Bässler, E. O. Göbel, P. Haring Bolivar, G. Weg-mann, H. Kurz, U. Scherf, and K. Mullen, Phys. Rev. B 54, 1759共1996兲.
8A. J. Heeger, S. Kivelson, J. R. Schrieffer, and W.-P. Su, Rev.
Mod. Phys. 60, 781共1988兲.
9P. L. Burn, A. B. Holmes, A. Kraft, D. D. C. Bradley, A. R.
Brown, R. H. Friend, and R. W. Gymer, Nature共London兲 356, 47共1992兲.
10G. R. Hayes, I. D. W. Samuel, and R. T. Phillips, Phys. Rev. B
52, R11569共1995兲.
11M. Liess, S. Jeglinski, Z. V. Vardeny, M. Ozaki, K. Yoshino, Y.
Ding, and T. Barton, Phys. Rev. B 56, 15712共1997兲.
12S. Abe, J. Phys. Soc. Jpn. 58, 62共1989兲.
13T. Ogawa and T. Takagahara, Phys. Rev. B 44, 8138共1991兲. 14Femtochemistry, edited by F. C. Schryver, S. Feyter, and G.
Schweitzer共Wiley-VCH, Weinheim, Germany, 2001兲.
15Femtochemistry and Femtobiology, edited by A. Douhal and J.
Santamaria共World Scientific, Singapore, 2001兲.
16Femtochemistry VII Fundamental Ultrafast Processes in
Chem-istry, Physics, and Biology, edited by A. W. Castleman, Jr. and
M. L. Kimble共Elsevier, The Netherlands, 2006兲.
17T. Kobayashi, T. Saito, and H. Ohtani, Nature共London兲 414,
531共2001兲.
18T. Kobayashi, A. Shirakawa, H. Matsuzawa, and H. Nakanishi,
Chem. Phys. Lett. 321, 385共2000兲.
19N. Ishii, E. Tokunaga, S. Adachi, T. Kimura, H. Matsuda, and T.
Kobayashi, Phys. Rev. A 70, 023811共2004兲.
20X. Yang, T. E. Dykstra, and G. D. Scholes, Phys. Rev. B 71,
045203共2005兲.
21A. Ruseckas and I. D. W. Samuel, Phys. Status Solidi C 3, 263
共2006兲.
22A. Ruseckas, P. Wood, I. D. W. Samuel, G. R. Webster, W. J.
Mitchell, P. L. Burn, and V. Sundström, Phys. Rev. B 72, 115214共2005兲.
23A. Shirakawa, I. Sakane, and T. Kobayashi, Opt. Lett. 23, 1292
共1998兲.
24A. Shirakawa, I. Sakane, M. Takasaka, and T. Kobayashi, Appl.
Phys. Lett. 74, 2268共1999兲.
25A. Baltuska, T. Fuji, and T. Kobayashi, Opt. Lett. 27, 306
共2002兲.
26H. Kano, T. Santio, and T. Kobayashi, J. Phys. Chem. B 105,
413共2001兲.
27T. Kobayashi, Z. Wang, and T. Otsubo, J. Phys. Chem. A 111,
12985共2007兲.
BRIEF REPORTS PHYSICAL REVIEW B 77, 153202共2008兲