This article was downloaded by: [National Chiao Tung University 國立交通大學]
On: 01 May 2014, At: 00:38
Publisher: Taylor & Francis
Informa Ltd Registered in England and Wales Registered Number: 1072954 Registered office: Mortimer House,
37-41 Mortimer Street, London W1T 3JH, UK
Journal of the Air & Waste Management Association
Publication details, including instructions for authors and subscription information:
http://www.tandfonline.com/loi/uawm20
Use of Two Different Acidic Aerosol Samplers To
Measure Acidic Aerosols in Hsinchu, Taiwan
Chuen-Jinn Tsai
a, Shie-Bong Perng
a& Shin-Fu Chiou
a aInstitute of Environmental Engineering, National Chiao Tung University , Hsinchu , Taiwan
Published online: 27 Dec 2011.
To cite this article: Chuen-Jinn Tsai , Shie-Bong Perng & Shin-Fu Chiou (2000) Use of Two Different Acidic Aerosol Samplers
To Measure Acidic Aerosols in Hsinchu, Taiwan, Journal of the Air & Waste Management Association, 50:12, 2120-2128, DOI:
10.1080/10473289.2000.10464237
To link to this article:
http://dx.doi.org/10.1080/10473289.2000.10464237
PLEASE SCROLL DOWN FOR ARTICLE
Taylor & Francis makes every effort to ensure the accuracy of all the information (the “Content”) contained
in the publications on our platform. However, Taylor & Francis, our agents, and our licensors make no
representations or warranties whatsoever as to the accuracy, completeness, or suitability for any purpose of the
Content. Any opinions and views expressed in this publication are the opinions and views of the authors, and
are not the views of or endorsed by Taylor & Francis. The accuracy of the Content should not be relied upon and
should be independently verified with primary sources of information. Taylor and Francis shall not be liable for
any losses, actions, claims, proceedings, demands, costs, expenses, damages, and other liabilities whatsoever
or howsoever caused arising directly or indirectly in connection with, in relation to or arising out of the use of
the Content.
This article may be used for research, teaching, and private study purposes. Any substantial or systematic
reproduction, redistribution, reselling, loan, sub-licensing, systematic supply, or distribution in any
form to anyone is expressly forbidden. Terms & Conditions of access and use can be found at
http://
www.tandfonline.com/page/terms-and-conditions
Copyright 2000 Air & Waste Management Association
Use of Two Different Acidic Aerosol Samplers To Measure
Acidic Aerosols in Hsinchu, Taiwan
Chuen-Jinn Tsai, Shie-Bong Perng, and Shin-Fu Chiou
Institute of Environmental Engineering, National Chiao Tung University, Hsinchu, Taiwan
ABSTRACT
Acidic aerosol concentrations measured by an annular denuder system (ADS) and a honeycomb denuder system (HDS) in Hsinchu, Taiwan, were compared. Aerosols were also sampled by a MOUDI (micro-orifice uniform deposit impactor) and analyzed by an ion chromatograph to de-termine the size distributions of different species. Using the measured aerosol size distribution, theoretical analy-sis showed that positive HNO3 artifact due to volatiliza-tion of NH4NO3 is generally negligible for both samplers. Comparing two different denuder samplers, the average concentration of HNO3 measured by the ADS was found to be lower than that measured by the HDS, while the difference between the two samplers for the average concentration of other species was found to be within
±15%. A possible cause of the difference in HNO3 con-centrations is due to a greater loss of HNO3 in the cyclone used by the ADS than in the impactor used by the HDS. The study also showed incomplete absorption of the evaporated HCl and HNO3 from the particles on the Teflon filter by the first nylon filter in the filter pack of the ADS. Collection efficiency and capacity of HCl and HNO3 by the nylon filters need further investigation.
INTRODUCTION
Acidic air pollutants have been associated with adverse health effects, mainly respiratory diseases. Spengler et al.
IMPLICATIONS
Measured concentrations of two commonly used acidic aerosol samplers—ADS and HDS—were compared in Hsinchu. Theoretical analysis showed that positive HNO3 artifact due to volatilization of NH4NO3 is generally negli-gible for both samplers. Experimental results showed that agreement between the measured acidic aerosol concen-tration is good, except for species which have a low con-centration, such as HNO3. A possible cause of the differ-ence in HNO3 concentration is due to a greater loss of HNO3 in the cyclone used by the ADS than in the impac-tor used by the HDS, leading to consistently higher HNO3
concentrations measured by the HDS.
reviewed extensively the health effect, health evidence, concentration ranges, and epidemiologic studies of acidic aerosols.1 Concentration ranges of SO
4
2– and H+ in selected
North American cities were shown to depend on sampling location and time of year. For example, in a 9-month study, from December 1985 to September 1986, the mean H+
concentrations in Kingston, TN, and St. Louis, MO, were found to be 36.1 and 10.3 nmol/m3, respectively.2 The
reason that acidity for Kingston was much higher than that for St. Louis is because the latter is more urban, and more aerosol neutralization by NH3 occurred.
Many different acidic aerosol samplers are commer-cially available. Possanzini et al. designed an annular de-nuder/filter pack system (ADS) that collects reactive atmospheric pollutants more efficiently per unit length than does a tubular denuder.3 An alternative system called
the honeycomb denuder system (HDS) was developed by Koutrakis et al.4 and improved by Sioutas et al.,5 whose
field studies indicated an excellent agreement between the HDS and HEADS (Harvard-EPA Annular Denuder Sys-tem) for determining the concentrations of particulate SO42–, NH
4
+, H+,and gas-phase HNO
3 and NH3.
In this study, we used an ADS (University Research Glassware Inc.) and an HDS (Ogawa & Co. Inc.) to com-pare the performance of these two different systems. Dur-ing the experiment, a 10-stage micro-orifice uniform deposit impactor (MOUDI) was collocated with the two denuder samplers to measure the size distributions of acidic aerosols in the atmosphere. The gas collection sec-tion of the HDS is a glass honeycomb consisting of 212 cylindrical tubes, and the i.d. and length of each tube are 0.2 and 3.8 cm, respectively.4,5 The gas collection section
of the ADS consists of 3 annuli, and the o.d. and i.d. are 19 and 17 mm, 14 and 12 mm, and 10 and 8 mm for the first, second, and third annuli, respectively, according to the manufacturer. The total flow rate and residence time, 10 L/min and 0.15 sec, are the same for both denuders.
In the following section, theoretical analysis will be presented to show if the positive HNO3 is severe for both denuder samplers. Experimental methods and results will follow.
Tsai, Perng, and Chiou
THEORETICAL ANALYSIS OF EVAPORATION LOSSOF NH4NO3 PARTICLES IN DENUDERS
For evaporative particulate species, such as NH4NO3 or NH4Cl, positive HNO3 artifact is formed due to particle evaporation. Bai et al.6 proposed a numerical method to
calculate the amount of such artifact, and an analytical method is proposed here. Only NH4NO3 particle is con-sidered. Gas penetration (or 1.0 – gas collection efficiency) of the HDS can be calculated as7
(1)
where µ = DL/Q, L is the length of the tube, D is the diffusivity of a gas or particle, and Q is the flow rate through each tube. Similarly, the gas penetration of the ADS can be calculated as7
(2)
where µ = πDL(o.d. + i.d.)/[Q(o.d. – i.d.)], and Q is the flow rate through each annular space.
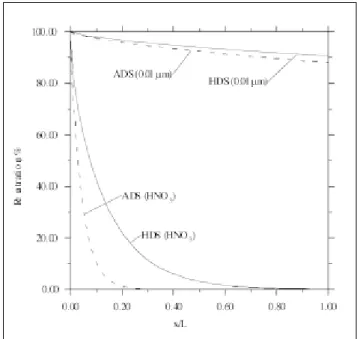
Figure 1 compares the penetration of HNO3 gas and a 0.01-µm particle at the different dimensionless lengths,
x/L, of the two denuders. Diffusivity of HNO3 is 0.118 cm2/sec at normal temperature and pressure.8 As can be
seen, HNO3 is depleted very quickly in both denuders. More than 80% of the nitric gas is absorbed in the first 7 or 20% of the length of the ADS or HDS, respectively. In comparison, particle diffusion loss is almost negligible due to much smaller diffusivity of particles compared with that of gases. For small 0.01-µm particles, the loss is only ~10% over the entire length of both denuders. Therefore, when calculating the evaporative loss of NH4NO3 particles, it is possible to assume that evapo-rated HNO3 gas is absorbed immediately to the denuder tubes (or annuli), resulting in positive HNO3 artifact, while the contribution of particle diffusion to HNO3 ar-tifact can be neglected.
To calculate evaporation loss of NH4NO3, the method described in Seinfeld and Pandis can be used.9 Mass
trans-fer flux, J (in g/sec), from a particle can be calculated as
(3)
where α is the accommodation coefficient of a gas spe-cies, Kn is the Knudsen number of the particle [Kn is de-fined as λ/(Dp/2), with λ the mean free path of gas molecules, and Dp the diam of the particle], and Jc is the mass transfer flux in the continuum regime, which can be calculated as
(4)
where C∞ and Cs are HNO3 acid concentrations in the air and over the particle surface, respectively. Since HNO3 is absorbed very quickly in the denuders, C∞ can be treated as zero. Cs can be calculated from the partial pressure of HNO3, P
HNO3, which is determined from the dissociation
constant of NH4NO3 particles, Kp (in ppb2, defined as the
product of and, the partial pressure of NH3). The relation-ship of Kp and ambient temperature T (in K) for dry NH4NO3 particles is10
(5)
Another formula, given by Mozurkewich,11 is
(6)
For particles in lognormal distribution, the total positive HNO3 artifact can be integrated from eq 3 over the entire particle distribution once the particle mass median aero-dynamic diameter (MMAD) and geometric standard de-viation (σg) are known. In this study, the particulate NO3–
measured is assumed to be entirely NH4NO3,and only evaporation loss in the fine particle mode is calculated, since coarse particles are removed by the impactor or cy-clone. The fine fraction of particulate NO3– averages 71%
of the total NO3– concentration, as found in this study.
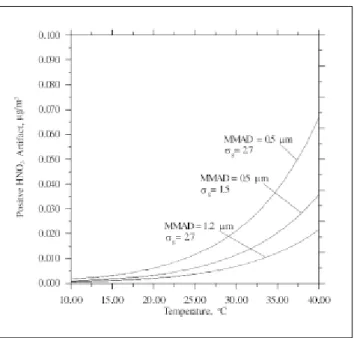
Both denuders have the same HNO3 artifact concen-tration since the airflow residence time is the same (0.15 sec). Theoretical predictions of positive HNO3 artifact are shown in Figures 2 and 3 using actual NO3– concentrations
Figure 1. Gas or particle penetration of the ADS and HDS vs.
dimensionless length.
and particle size distributions measured in this study. The accommodation coefficient of 0.52 is adopted.12 In Figure
2, the MMAD and sg in the fine mode are assumed to be 0.5 µm and 1.5, respectively. The HNO3 artifact is shown to be small and increases with increasing ambient tem-perature and particulate NO3– concentration. The
disso-ciation constant determined by Mozurkewich11 gives a
slightly higher HNO3 artifact concentration than that given by Stelson and Seinfeld.10 The maximum
concen-tration is only 0.038 µg/m3 at 40 °C when the NO 3
–
con-centration is 17.9 µg/m3, which is the maximum NO 3
–
concentration found in this study.
Size distribution of particulate NO3– influences the
HNO3 artifact concentration for a given particle NO3–
con-centration, 17.9 µg/m3 (see Figure 3). It is seen that a
smaller MMAD and larger σg results in a higher artifact concentration. However, the artifact HNO3 concentration is still small. In this study, the ambient temperature av-eraged 28 °C and the HNO3 concentration averaged 0.6 µg/m3; hence, it can be said that HNO
3 artifact due to
evaporation loss of NO3– particles is not a problem for
either denuder.
EXPERIMENTAL METHODS
A total of 15 ambient 24-hr-average samples were collected from December 1997 to May 1998 on the roof of the In-stitute of Environmental Engineering, National Chiao Tung University (~11 m above ground level), located in Hsinchu, Taiwan. Due to frequent rain in the winter sea-son, 11 of the 15 samples were collected in the spring season (March–May). The city has an area of 104 km2 and
a population of nearly 340,000. This typical urban city is crowded with cars and is renowned for its high-tech semi-conductor and computer industries. It is located in the northern part of Taiwan, near Taiwan’s western coast.
An ADS, an HDS, and a MOUDI (MSP model 100) were used to collect acidic aerosols. While there were 15 ADS and HDS samples, there were only 10 successful MOUDI samples collected. The ambient temperature and humidity were measured by a Q-Trak (model 8550/8551, TSI). The components of the HDS include an impactor with the 50% cut size at 2.5 µm, a glass-transition sec-tion, two honeycomb denuders, a spacer, and a filter pack.4,5 The flow rate of the HDS is 10 L/min. The first
denuder was coated with Na2CO3/glycerol to collect acidic gases, such as SO2, HNO3, and HNO2, whereas the second denuder was coated with 2% citric acid/1% glycerol in water:methanol solution to collect basic gases such as NH3. A three-stage filter pack was placed downstream of the denuders. The filter pack consists of a Teflon filter (Gelman Science, 2-µm pore size) to collect fine particles, a nylon filter (Gelman Science, 1-µm pore size) to collect HNO3 and HCl, and a glass fiber filter (AP40, Millipore Inc.) coated with citric acid to collect NH3 that volatilized from the collected particles on the Teflon filter. Particulate NO3–
and Cl– concentrations were determined as the sum of
those collected on the Teflon filter and the nylon filter, respectively.
Details of the ADS sampler were described by the U.S. Environmental Protection Agency (EPA).13 The ADS
con-sists of a 2.5-µm cut-size cyclone (10 L/min flow rate, model URG-2000-30EN) to remove fine particles and four
Figure 2. Positive HNO3 artifact vs. ambient temperature assuming two different particulate NO3 concentrations. MMAD and sg are assumed to be 0.5 µm and 1.5, respectively.
Figure 3. Positive HNO3 artifact vs. ambient temperature assuming different particle size distributions in the fine mode. Particulate NO3
concentration is assumed to be 17.9 µg/m3, and dissociation constant
is calculated from Mozurkewich.11
Tsai, Perng, and Chiou
denuders to collect acidic and basic gas species. As in the case of HDS, following the fourth denuder is a PTFE Teflon filter pack, containing a Teflon filter upstream of two ny-lon filters (to collect HNO3 and HCl) and a citric-acid-coated glass fiber filter (to collect NH3). Both nylon filters were analyzed for NO3– and Cl– concentrations.
The size distributions of airborne aerosols were mea-sured using the MOUDI. At the entrance of the MOUDI, air first passed through two citric-acid-coated denuders, which protected the collected acidic aerosol sample from being neutralized. The MOUDI has a high flow rate of 30 L/min. The impaction substrates and final filter are Teflon filters (Gelman Science, 2-µm pore size) chosen for low background species concentrations.
After sampling, the denuders and the glass fiber filters were extracted with 10 mL of ultrapure water (Millipore, Millie-Q water system). The nylon filters were extracted with 10 mL of anion eluent (1.8 mM Na2CO3 and 1.7 mM NaHCO3) to extract Cl– and NO
3
– efficiently.13 Teflon filters
were extracted with 3 mL of solution containing 10-4 N
HClO4 and 0.04 M KCl for pH analysis. The pH determina-tions were made using a pH meter. The use of a small vol-ume of extraction solution (3 mL) resulted in a satisfactory sensitivity for our analysis.4 Concentrations of H+ were then
calculated by the pH of the sample using a standard cali-bration curve determined from known concentrations of H2SO4. Finally, soluble ions such as NO3–, NO
2 –, Cl–, SO 4 2–, Na+, NH 4
+, and K+ were analyzed by ion chromatography
(model 4500i, Dionex Corp.) following the method de-scribed in Sioutas et al.5 The detection limits for H+, NO
3 –, NO2–, Cl–, SO 4 2–, Na+, NH 4
+, and K+ were found to be 0.003,
0.07, 0.03, 0.04, 0.08, 0.05, 0.001, and 0.05 µg/m3,
respec-tively, based on airborne species concentrations.
RESULTS AND DISCUSSION
Species Concentrations and Performance Comparison of ADS and HDS
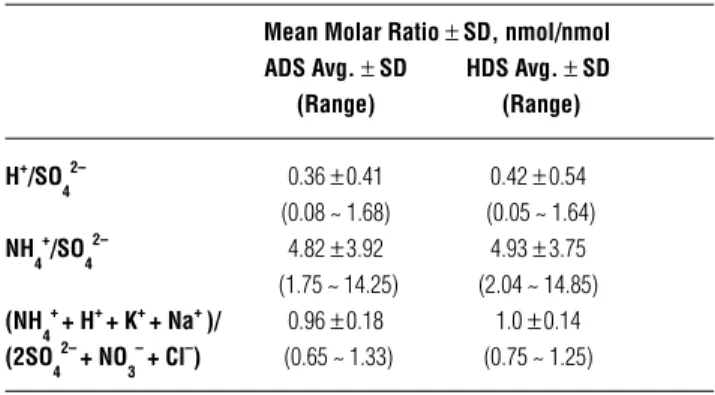
As shown in Table 1, ratios of the positive ion to the nega-tive ion concentrations [(H+ + NH
4
+ + Na+ + K+)/(NO 3
– + Cl–
+ 2SO42–)] for the ADS and the HDS found on the Teflon
filter average 0.96 ± 0.18 (range 0.65–1.33) and 1.01 ± 0.14 (range 0.75–1.25), respectively. The ratios are all near 1.0, suggesting that all anions associated with acidity have been accounted for and these ionic species are the major composition of ionic species in the fine mode.
Molar ratios of H+/SO 4
2– equal to 0.0, 0.5, 1.0, and 2.0
correspond to compositions of (NH4)2SO4, NH4HSO4–,
(NH3)3H(SO4)2 and H2SO4.4 The molar ratios of H+/SO 4
2–
measured by the ADS and HDS range from 0.08 to 1.68 (0.36 average) and from 0.05 to 1.64 (0.42 average), re-spectively, as shown in Table 1. Hence, acidic aerosols exist as a form distributed between (NH4)2SO4, (NH3)3H(SO4)2, and NH4HSO4– [mainly (NH
4)2SO4 and (NH3)3H(SO4)2].
This study has also used the thermodynamic prin-ciple to calculate the theoretical NH4NO3 dissociation con-stant, which is then compared with the experimental data. Analysis of the experimental data supports that particu-late NH4NO3 is in equilibrium with its precursors, NH3 and HNO3, in the atmosphere. The ionic species and gas-phase concentrations are shown in Table 2. On average, the concentrations (in µg/m3) of major ionic species measured
by ADS are 0.019 (average) ± 0.01 [standard deviation (SD)], 7.60 ± 5.08, 7.6 ± 5.50 and 5.27 ± 2.90 for H+, SO
4 2−, NO
3 −,
and NH4+, respectively. The major gas-phase concentrations
Table 1. The molar ratio of gaseous and particulate species for ADS and HDS.
Mean Molar Ratio ± SD, nmol/nmol ADS Avg. ± SD HDS Avg. ± SD
(Range) (Range) H+/SO 4 2– 0.36 ± 0.41 0.42 ± 0.54 (0.08 ~ 1.68) (0.05 ~ 1.64) NH 4 + /SO 4 2– 4.82 ± 3.92 4.93 ± 3.75 (1.75 ~ 14.25) (2.04 ~ 14.85) (NH 4 + + H+ + K+ + Na+ )/ 0.96 ± 0.18 1.0 ± 0.14 (2SO 4 2– + NO 3 – + Cl–) (0.65 ~ 1.33) (0.75 ~ 1.25)
Table 2. Comparison of species concentrations and mean concentration ratios (ADS/HDS).
Avg. Concentration ± SD, µg/m3 Avg. Concentration (Range) Ratio ± SD
Species ADS HDS ADS/HDS
HNO 3 0.44 ± 0.22 0.74 ± 0.30 0.52 ± 0.13 (0.13 ~ 1.06) (0.21 ~ 1.50) HNO 2 3.28 ± 2.61 3.61 ± 3.10 0.96 ± 0.27 (0.00 ~ 8.69) (0.00 ~ 10.65) SO 2 23.31 ± 4.35 26.92 ± 17.27 0.89 ± 0.20 (5.81 ~ 63.48) (6.79 ~ 71.05) NH 3 12.75 ± 6.65 12.35 ± 4.99 1.03 ± 0.24 (7.00 ~ 30.56) (6.40 ~ 27.56) Cl− 2.13 ± 2.63 1.86 ± 2.07 1.14 ± 0.25 (0.11 ~ 7.85) (0.09 ~ 8.08) NO 3 − 7.67 ± 5.50 6.80 ± 6.50 1.12 ± 0.16 (1.18 ~ 21.58) (1.05 ~ 17.78) SO 4 2− 7.60 ± 5.08 7.61 ± 5.26 1.05 ± 0.17 (1.37 ~ 16.54) (1.11 ~ 18.37) NH 4 + 5.27 ± 2.90 5.34 ± 3.12 1.08 ± 0.12 (1.14 ~ 9.42) (1.01 ~ 10.58) Na+ 1.30 ± 1.11 1.36 ± 1.14 0.94 ± 0.19 (0.00 ~ 4.12) (0.00 ~ 3.91) K+ 0.75 ± 0.31 0.75 ± 1.40 0.91 ± 0.13 (0.00 ~ 4.46) (0.00 ~ 4.96) H+ 0.019 ± 0.01 0.019 ± 0.01 1.11 ± 0.54 (0.00 ~ 0.34) (0.00 ~ 0.046)
in µg/m3 measured by the ADS are 0.44 ± 0.22, 3.28 ±
2.61, 23.31 ± 14.35, and 12.75 ± 6.65, for HNO3, HNO2, SO2, and NH3, respectively. The mean H+ concentration is
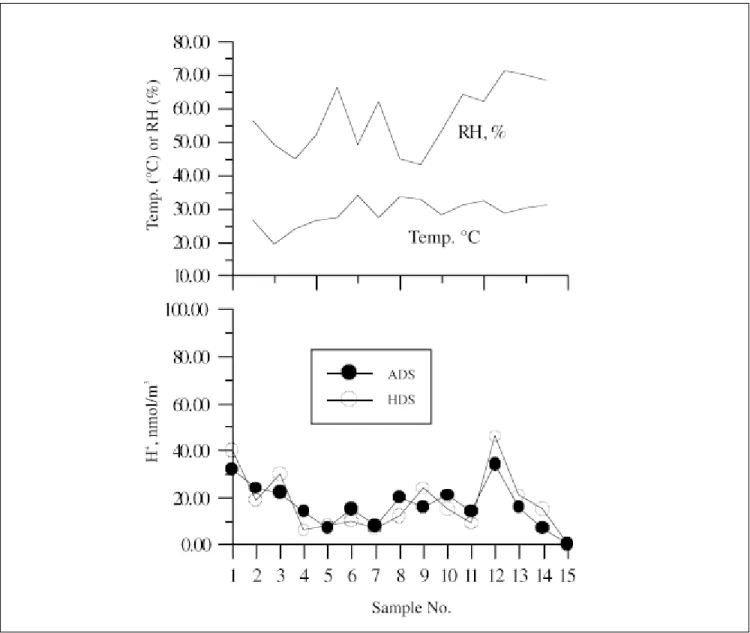
equivalent to 18.98 nmol/m3. In Figure 4, the
concentra-tion of H+ measured by both denuder samplers is shown
in the bottom panel, while the ambient condition is shown in the top panel. The first four data points were collected in the winter season, while the other points were collected in the spring season. Good correlation between the measured values by the two denuder samplers can be seen. In addition, aerosol acidity is seen not to depend on ambient temperature and relative humidity.
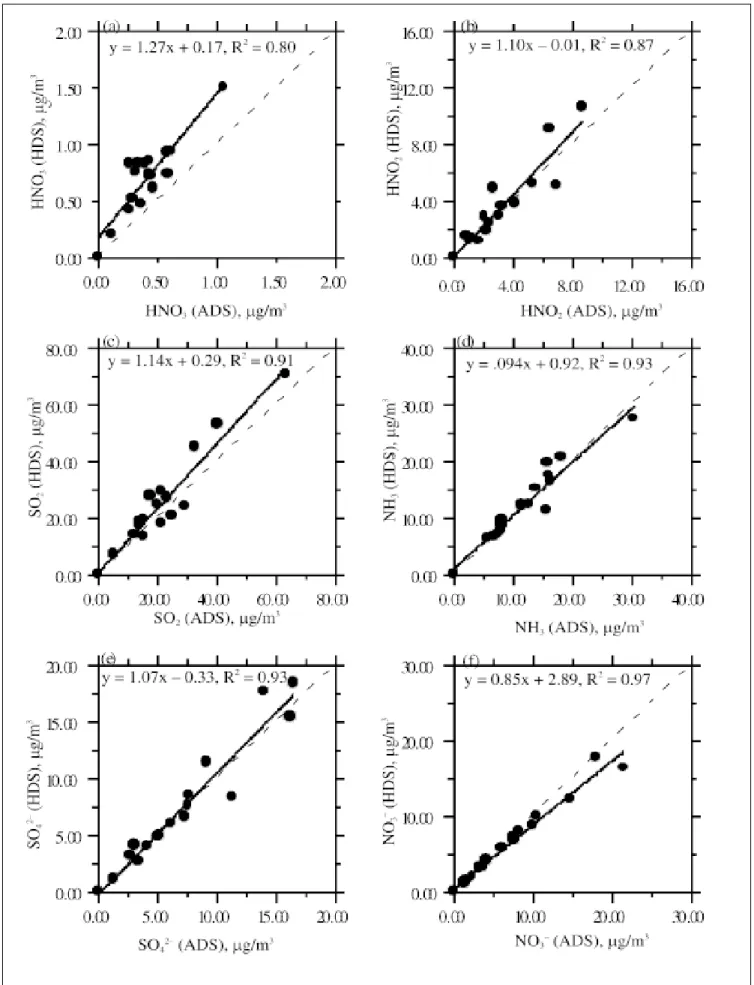
Comparison of major gas and particle species con-centrations between the two denuder samplers is shown in Figures 5a–5f. It can be seen that the correlation be-tween the concentrations measured by the two denuder samplers is generally very good. The difference between the concentrations measured by the ADS and the HDS for
particulate SO42−, NH 4
+, H+, K+, Na+, and gas-phase NH 3 is
within ±15%. However, the HNO3 concentration measured by the ADS is consistently lower than that measured by the HDS. Both the HDS and the ADS have a similar aero-sol retention time of 0.15 sec, and previous theoretical analysis showed that positive HNO3 artifact resulting from evaporation of NH4NO3 is negligibly small for both sam-plers. Therefore, there must be causes other than positive HNO3 artifact formation. Sioutas et al.5 found that HNO
3
loss in the improved HDS is smaller than that in the origi-nal HDS, since the impactor surface of the former is much smaller than that of the latter. The cyclone used by the ADS has a much larger surface area than that of the im-pactor used by the HDS and could also possibly result in a higher HNO3 loss in the ADS.
The filter pack in the ADS has two nylon filters, while the HDS has only one nylon filter to absorb HCl and HNO3 volatilized from the Teflon filter. As shown
Figure 4. H+ concentration measured by the two denuder samplers (bottom panel) and ambient condition (top panel).
Tsai, Perng, and Chiou
Figure 5. Comparison of concentrations of major gas and particle species measured by the two denuder samplers (conversion factor for gas
species: 1 ppb = 2.58 µg/m3 for HNO
3, 1.92 µg/m 3 for HNO 2, 2.62 µg/m 3 for SO 2, and 0.695 µg/m 3 for NH 3, at 1 atm and 20 °C).
in Table 3, the average concentrations of Cl– and NO 3
–
on the second nylon filter (NF2) of the ADS are 0.30 and 1.10 µg/m3, respectively, which are ~14% of the
total Cl– or NO 3
– concentrations. That is, breakthrough
of both HCl and HNO3 gases from the first nylon filter has occurred. Further study of the collection efficiency and capacity of these two gases by the nylon filter is important and necessary.
Size Distributions of Acidic Aerosols
As shown in Figures 6 and 7, H+ and NH 4
+ were found to
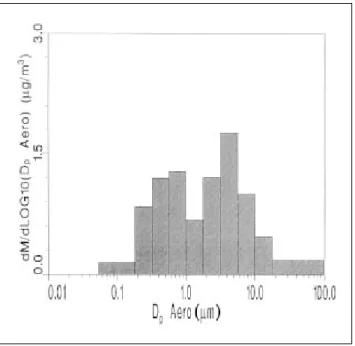
be in the single mode in the atmosphere, and the aver-age MMADs are 0.63 and 0.4 ~ 0.5 µm, respectively. The size distribution of NO3– is usually found to be bimodal.
A typical distribution is shown in Figure 8. There is a fine mode for size distributions of NO3–, and the MMAD
is from 0.5 ~ 1.2 µm. Fine NO3– is usually the result of
the HNO3/NH3 reaction for the formation of particulate NH4NO3, while coarse NO3– is the product of coarse
par-ticles/HNO3 reactions.
The size distribution of SO42– is usually found to be
bimodal, as shown in Figure 9 for a typical tion. There are two submicron modes for size distribu-tions of SO42–. The two modes are called the
condensation mode, with an MMAD of 0.18 ~ 0.32 µm, and the droplet mode, at 0.92 ~ 1.04 µm. However, there is only one supermicron mode for SO42–, and the
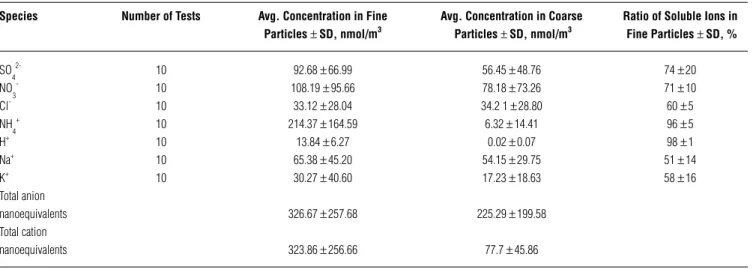
aver-age diameters are 7.00 ~ 7.95 mm. The ratios of SO42–, NO
3 –, NH
4
+, H+, Cl–, Na+, and K+ in
fine particles are 74 ±20%, 71± 10%, 96± 5%, 98± 1%, 60±
5%, 51± 14%, and58± 16%, respectively, as shown in Table 4. It indicates that SO42–, NO
3 –, NH
4
+,and H+ are
domi-nant in the fine fraction of particles, whereas Cl–, Na+,
and K+ are found in both fine and coarse particles. One
can also see in Table 4 that total anion (2 [SO42–] +
[NO3–] + [Cl–]) and cation ([H+] + [NH 4
+] + [Na+] + [K+])
nanoequivalents are nearly the same (326.67 vs. 323.86 nmol/m3) for fine particles, while that is not the case for
coarse particles (225.29 vs. 77.7 nmol/m3). This suggests
that neutralization by alkaline species other than Na+ and
K+ has occurred for coarse particles, but probably not for
fine particles. Whether or not alkaline species other than Na+ and K+ appear in significant amounts in fine particles
involves further chemical analysis of fine particle samples by atomic absorption spectrometry, but this is beyond the scope of the present work.
CONCLUSIONS
The acidic aerosols and the particle size distributions were measured with the ADS, HDS, and MOUDI simultaneously in Hsinchu. The samples were analyzed by ion chroma-tography for ionic and gas species concentrations. Theo-retical analysis of the problem of positive HNO3 artifact due to evaporation loss of NO3– particles can be neglected
for both denuder samplers. If the ambient temperature is below 28 °C, the maximum HNO3 artifact concentration is less than 0.01 µg/m3 when the maximum NO
3
–
concen-tration is 17.9 µg/m3.
Experimental results conclude that the HDS performs equally as well as the ADS for atmospheric aerosol
Table 3. The concentration ratio of NF2/ADS for particulate Cl- and NO
3
-.
Concentration Measured Concentration Measured Ratio of NF2/ADS by ADS, µg/m3 by the NF2 in ADS, µg/m3
Sample Cl– NO 3 – Cl– NO 3 – Cl– NO 3 – 1 1.11 7.69 0.28 1.15 0.25 0.15 2 4.96 1.18 0.55 0.19 0.11 0.16 3 6.91 6.11 0.63 0.79 0.09 0.13 4 7.85 8.37 1.10 1.00 0.14 0.12 5 0.21 9.99 0.02 1.10 0.07 0.11 6 0.54 1.37 1.08 0.19 0.07 0.14 7 0.41 3.90 0.07 0.66 0.13 0.17 8 0.59 17.93 0.10 3.05 0.10 0.17 9 2.13 21.58 0.45 3.02 0.15 0.14 10 0.85 10.43 0.12 1.25 0.09 0.13 11 3.42 14.70 0.58 2.65 0.12 0.19 12 0.53 2.40 0.08 0.26 0.17 0.11 13 0.11 1.76 0.03 0.21 0.13 0.12 14 0.87 3.43 0.16 0.45 0.10 0.13 15 1.43 4.14 0.25 0.53 0.17 0.13 Average 2.13 7.67 0.30 1.10 0.14 0.14
Tsai, Perng, and Chiou
sampling, except for the measurement of the gas-phase HNO3. For HNO3, the concentrations measured by the HDS are consistently higher than those measured by the ADS, possibly because there is a higher HNO3 loss in the cy-clone used by the ADS than in the impactor used by the HDS. About 14% of the total Cl– and NO
3
– were measured
in the second nylon filter of the filter pack of the ADS, suggesting that breakthrough of HCl and HNO3 from the first nylon filter is occurring. Further study of the collec-tion efficiency and capacity of HCl and HNO3 gases by the nylon filter is warranted. In this study, SO42–, NO
3 –,
Figure 6. A typical H+ size distribution (single mode). The x axis refers
to particle aerodynamic diameter.
Figure 7. A typical NH4+ size distribution (single mode). The x axis
refers to particle aerodynamic diameter.
Figure 8. A typical NO3
– size distribution (bimodal). The x axis refers
to particle aerodynamic diameter.
NH4+, and H+ were found to be dominant in the fine
frac-tion of particles, whereas Cl–, Na+, and K+ were found in
both fine and coarse particles. NH4+ and H+ have a single
fine particle mode, while SO42– and NO 3
– usually have both
fine and coarse particle modes.
ACKNOWLEDGMENT
The authors would like to thank the National Science Council, Taiwan, Republic of China, for the financial sup-port of this research under Contract No. NSC 87-2621-P-009-001.
Figure 9. A typical SO42– size distribution (bimodal). The x axis refers
to particle aerodynamic diameter.
REFERENCES
1. Spengler, J.D.; Brauer, M.; Koutrakis, P. Acid Air and Health; Environ.
Sci. Technol. 1990, 24, 946.
2. Koutrakis, P.; Wolfsan, M.; Spengler, J.D. An Improved Method for Measuring Aerosol Strong Acidity: Result from a Nine-Month Study in St. Louis, Missouri, and Kingston, Tennessee; Atmos. Environ. 1988,
22, 157.
3. Possanzini, M.; Febo, A.; Liberti, A. New Design of a High-Perfor-mance Denuder for the Sampling of Atmospheric Pollutants; Atmos.
Environ. 1983, 17, 2605.
4. Koutrakis, P.; Sioutas, C.; Ferguson, S.T.; Wolfsan, J.M. Development and Evaluation of a Glass Honeycomb Denuder/Filter Pack System To Collect Atmospheric Gases and Particles; Environ. Sci. Technol. 1993,
27, 2497.
5. Sioutas, C.; Wang, P.Y.; Ferguson, S.T.; Koutrakis, P. Laboratory and Field Evaluation of an Improved Glass Honeycomb Denuder/Filter Pack Sampler; Atmos. Environ. 1996, 30, 885.
6. Bai, H.; Lu, C.S.; Ling, Y.M. A Theoretical Study of the Evaporation of Dry Ammonium Chloride and Ammonium Nitrate Aerosols; Atmos.
Environ. 1995, 29, 313.
7. Hinds, W.C. Aerosol Technology, 2nd ed.; Wiley: New York, 1999; Chap-ter 7, pp 165-168.
8. Winiwater, W. A Calculation Procedure for the Determination of the Collection Efficiency in Annular Denuders; Atmos. Environ. 1989, 23, 1997.
9. Seinfeld, J.H.; Pandis, S.N. Atmospheric Chemistry and Physics; Wiley: New York, 1998; Chapter 11, pp 596-607.
Table 4. The ratio of soluble ions in particles collected by the MOUDI.
Species Number of Tests Avg. Concentration in Fine Avg. Concentration in Coarse Ratio of Soluble Ions in Particles ± SD, nmol/m3 Particles ± SD, nmol/m3 Fine Particles ± SD, %
SO 4 2-10 92.68 ± 66.99 56.45 ± 48.76 74 ± 20 NO 3 -10 108.19 ± 95.66 78.18 ± 73.26 71 ± 10 Cl- 10 33.12 ± 28.04 34.2 1 ± 28.80 60 ± 5 NH 4 + 10 214.37 ± 164.59 6.32 ± 14.41 96 ± 5 H+ 10 13.84 ± 6.27 0.02 ± 0.07 98 ± 1 Na+ 10 65.38 ± 45.20 54.15 ± 29.75 51 ± 14 K+ 10 30.27 ± 40.60 17.23 ± 18.63 58 ± 16 Total anion nanoequivalents 326.67 ± 257.68 225.29 ± 199.58 Total cation nanoequivalents 323.86 ± 256.66 77.7 ± 45.86
About the Authors
Dr. Chuen-Jinn Tsai (cjtsai@green.ev.nctu.edu.tw) is a pro-fessor and Shie-Bong Perng and Shin-Fu Chiou are gradu-ate students at the Institute of Environmental Engineering, National Chiao Tung University, No. 75, Poai St., 300 Hsinchu, Taiwan.
10. Stelson, A.W.; Seinfeld, J.H. Relative Humidity and Temperature De-pendence of the Ammonium Nitrate Dissociation Constant; Atmos.
Environ. 1982, 16, 983.
11. Mozurkewich, M. The Dissociation Constant of Ammonium Nitrate and Its Dependence on Temperature, Relative Humidity and Particle Size; Atmos. Environ. 1993, 27, 261.
12. Cheng, Y.H.; Tsai, C.J. Evaporation Loss of Ammonium Nitrate Par-ticles during Filter Sampling; J. Aerosol Sci. 1997, 28, 1553. 13. Determination of the Strong Acidity of Atmospheric Fine Particles (<2.5
mm) Using Annular Denuder Technology; EPA/600/R-93/037; U.S.
Envi-ronmental Protection Agency, U.S. Government Printing Office: Washington, DC, 1992.