Prediction and Evaluation of Non-point Source Loads in the
Reservoir Watershed using the GIS/GPS/RS Information
Technologies and Numerical Models
H. W. Chen, Ni-Bin Chang, K. Y. Jeng, S. K. Ning, and C. S. Lee
Department of Environmental Engineering
National Cheng-Kung University
Tainan, Taiwan, R.O.C.
Published in
Prediction and Evaluation of Non-point Source Loads in the
Reservoir Watershed using the GIS/GPS/RS Information
Technologies and Numerical Models
H. W. Chen, Ni-Bin Chang, K. Y. Jeng, S. K. Ning, and C. S. Lee Department of Environmental Engineering
National Cheng-Kung University Tainan, Taiwan, R.O.C.
Abstract
One of the recent concerns of reservoir eutrophication issues focuses on a fast assessment of the non-point sources pollution impact that frequently requires first evaluating the land use patterns in the watershed area. This information is useful for estimating the non-point source loads, assessing the proper uses of natural resources in the watershed, and generating the essential control strategies when required. To achieve this goal, the state-of-the-art 3S information technologies by properly integrating the skills of geographic information system (GIS), global positioning system (GPS) and remote sensing (RS), is viewed as an integrated means for reservoir land use assessment and watershed management. Substantial efforts of this study are then placed upon identifying seven types of land use patterns in the watershed of the Tseng-Wen Reservoir in Southern Taiwan, which would assist in the required estimation of non-point sources pollution impact directly. With the aid of SPOT satellite images, Erdas Imagine® image processing system and ArcView® GIS, the numerical model based on the export coefficient method yields an estimation of non-point source loads on a yearly basis with respect to four target constituents. These constituents of interest consist of total phosphorus (TP), total nitrogen (TN), biochemical oxygen demand (BOD), and total suspended solid (TSS). The analysis of assimilative capacity of the Tseng-Wen Reservoir based on various types of numerical models is also included for the evaluation of the eutrophication issue. Advanced management strategies with regard to the proper use of assimilative capacity of the Tseng-Wen Reservoir and the land resources in the watershed are then discussed in terms of three classified impact levels of non-point sources in the watershed. The methodology is proved practical, promising and effective for assessing the eutrophication issue in the reservoir watershed within a short period of time.
Keywords: eutrophication, reservoir, non-point sources pollution, sediment transport, watershed management, simulation model, information technology, GIS, GPS, RS
INTRODUCTION
Increasing population size and the motivation of economic growth are possibly the main reasons for different uses of the same tract of land within many reservoir watershed areas in Taiwan. Until the year 1999, due to the improper utilization of land, the situation of almost one-third of the reservoirs facing different levels of eutrophication makes the control strategy of non-point sources pollution in the reservoir watershed become more critical in Taiwan. One of the recent concerns of reservoir eutrophication issues, however, focuses on a fast assessment of the non-point sources pollution impact that frequently requires first evaluating the land use patterns in the watershed areas. This information is useful for estimating the non-point source loads, assessing the proper uses of natural resources in the watershed, and generating the essential control strategies when required.
Various types of non-point sources simulation models have been employed to account for the integrated impacts of hydrological cycle and land cover in relation to nutrient yield (Bailey et al., 1974; Donigian et al., 1996). Shoemaker et al. (1997) offered a thorough review with regard to compendium of tools for watershed assessment and total maximum daily load (TMDL) development. In particular, Haith et al. (1992) presented the mechanism of generalized watershed loading function (GWLF) and a successful implementation for dealing with sludge disposal issue. Dikshit and Loucks (1995 and 1996) presented the Cornell non-point sources simulation model (CNPS) to help planners identify, analyze, and simulate the impacts of alternative land use management policies and practices on non-point pollution control. With the aid of various environmental models, the improvement of the estimation and control of non-point sources in reservoir watershed was greatly enhanced in recent years (Safe and Choudhury, 1998; Yool, 1998; and Miller et al., 1998.). To assess the effectiveness of land use management policy, the present applications seek improved modeling approaches for predicting the water quality impacts of storm events as a function of land topography, land cover, and land use leading to the development of various applications, such as SWMM (Metcalf & Eddy, 1971), STORM (U.S. Army, 1977), and NPS (Donigian and Crawfords, 1976). These models for assessing non-point source loads in the agricultural field generally
simulate rainfall, erosion, run-off sediment, temperature, wind speed, atmospheric pressure, non-point source processes and estimate of pollutant loading at the watershed outlet. Existing examples include the ARM (Donigian and Davis, 1978), CREAMS (Knisel, 1980), ANSWERS (Beasley and Huggins, 1982), HSPF (Donigian et al., 1980), and AGNPS (Young et al., 1989). But a faster approach using simply the export coefficients for estimating the non-point pollutant loading sometimes exhibits higher application potentials in developing countries. Loading of organic matter in relation to total pesticide budgets have been studied in India based on the principle of export coefficients (Gajbhiye et al., 1995).
Previous experiences indicate that the state-of-the-art 3S information technologies by properly integrating the skills of geographic information system (GIS), global positioning system (GPS), remote sensing (RS), owns a timesaving merit when planners are required applying the land use classification program for the identification of non-point source loads. Liang and Chen (1995) emphasized a conjunctive use of GIS and watershed model for the adequate estimation of its potential impact of non-point sources to reservoir water quality. Dikshit and Loucks (1995 and 1996) also applied the CNPS model for assessing the nutrient yield using spatial data from Erdas GIS® and temporal data with respect to precipitation, temperature, wind speed and atmospheric pressure. The GIS expresses the geographic area as a matrix of grid cells of which each grid cell stands for a parcel of land of certain size and serves as the basic unit for quantification of various physical, topographical, meteorological, hydrological and geological features. The integration of each grid cell of the study area in GIS with various environmental models was fully discussed by Goodchild et al., (1996).
This paper represents a companion study of Chang et al, (1995), Chang et al. (1996a, 1996b) and Chen and Chang (1998). The specific series of studies were designed to deal with various types of water quality management issues in the Tseng-Wen River Basin in Southern Taiwan. The goal of this paper is to establish an applicable and quick procedure with the aid of 3S information technologies and export coefficients for estimating the non-point source loads in the reservoir watershed and for comparing that value with the predicted assimilative capacity of reservoir. This evaluation must be helpful for ensuring the consumption of natural resources in the watershed, evaluating sustainability issue and generating the essential control strategies in a timely manner. In the case study, 3S
information technologies are integrated as a means for land use identification in the Tseng-Wen Reservoir watershed that is selected as a study area as the conventional approach applied for land cover mapping is difficult to use due to rugged terrain, isolated areas and difficult access. With the aid of SPOT satellite images, Erdas Imagine® image processing system and ArcView® GIS, the numerical model based on the export coefficient method yields an estimation of non-point source loads with respect to four target constituents on a yearly basis. These constituents of interest consist of total phosphorus (TP), total nitrogen (TN), biochemical oxygen demand (BOD) and total suspended solid (TSS). In addition, the analysis of assimilative capacity of the Tseng-Wen Reservoir based on various types of numerical models is also included as baseline information for the evaluation of eutrophication impact.
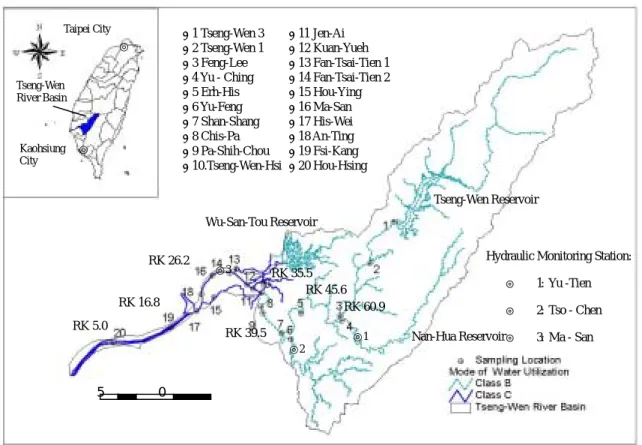
STUDY AREA AND BACKGROUND INFORMATION
The Tseng-Wen River Basin, located in Southern Taiwan, is a narrow and steep watershed. The main stream in this system is 138 Km in length and drains toward the Taiwan Strait. The Tweng-Wen Reservoir is a multipurpose reservoir designed for flood control, hydroelectric power generation, irrigation, water supply, recreation and flow augmentation. It is located in the upstream area of the Tweng-Wen River system. The geographical location of this reservoir is shown in Figure 1 (Chang et al., 1995, 1996a, 1996b). The entire watershed area of this river basin is 1,176 square kilometres, in which the Tseng-Wen Reservoir watershed covers 481 square kilometres. The Tweng-Wen Reservoir was designed to store 708,000,000 cubic meters of water with a surface area of 17 square kilometres. Average rainfall in this watershed area is close to 3,000 mm per year, which is a little higher than the average annual rainfall of 2,600 mm for the entire river basin. At present, the reservoir watershed is predominated by forest and agricultural land. The average slope of this river basin is about 1/57. The rich soils in the watershed have motivated a fast growth of the total number of fruit farm and tea farm in recent years. Non-point sources, thus, contribute the main portion of nutrient loads (i.e., over 90%) to the water body of the reservoir that is also ecologically and environmentally important. The total population is approximately 160,000 in this river basin, where most of the residents live in the middle and lower river
reaches. The Hoe-Chueh and Tsai-Loao tributaries are located near this region. Three smaller reservoirs in the river basin surround this area. The Wu-San-Tou Reservoir, a separate impoundment connected with Tseng-Wen Reservoir by tunnel, performs short-term water storage for agricultural irrigation for the largest irrigation area in Southern Taiwan, Chia-Yi and Tainan Counties. Because of insufficient stream flow, extremely uneven rainfall, seasonal run-off and pollution from residential and pig farming effluent, the water supply for the coastal cities is facing a severe challenge. The Nan-Hwa Reservoir is a reservoir designed and built for water supply purposes. The water is pumped from a river weir located on the neighbouring Kao-Ping River system into an associated tunnel and stored in the Nan-Hwa Reservoir temporarily for processing to support domestic use in both Kaohsiung and Tainan Cities. The Jing-Men Reservoir is the smallest reservoir in the Tseng-Wen River Basin designed only for local irrigation.
Reservoir water quality can be degraded through over-enrichment by wastewater and agricultural runoff, erosion, acid rain and contamination by toxic metals and pesticides (Reckhow and Stow 1990; Kaufman, 1992; Cooke, 1993; Bartodziej and Ludlow 1997). Of these various problems, the most common one is eutrophication. Eutrophication is defined as “the biological effects of an increase in concentration of plant nutrients -- usually nitrogen and phosphorus . . . -- on aquatic ecosystems (Harper 1992).” In Taiwan, a long-term monitoring program for reservoir water quality, which was routinely conducted by the Environmental Protection Administration (EPA), evidenced the eutrophication impact in the Tseng-Wen Reservoir (EPA, Republic of China, 1993-1998).
The Carlson’s Trophic State Index (TSI) (Carlson, 1977) may address the changing impact of eutrophication, which is associated with nutrient loads, transparency and algae blooms. Carlson’s TSI (Carlson, 1977) is a way of quantifying eutrophication within a reservoir or lake. The TSI is defined in terms of total phosphorus, chlorophyll-a, and Secchi disc measurements (transparency). Phosphorus is the growth-limiting nutrient for phytoplankton and plants in reservoirs or lakes (Schindler, 1977; Horne and Goldman, 1994). The chlorophyll-a provides a quantitative measure of the algal biomass by illustrating the amount of photosynthetic pigment present in the water body. The more the chlorophyll-a, the
larger the algal biomass appears. Secchi disc measures the depth of light penetration into the lake or reservoir, which is a function of the density of varying algal populations and suspended solids (Heiskary, 1989). Hence, the fewer the number of free floating algae, the deeper the Secchi depth reading. In other words, the Secchi depth is an indirect measurement of fertility and productivity in a lake or reservoir. A TSI number is derived for each of these three measurements and the three TSI values can also be averaged by equal weight to generate a unique value identifying the status of eutrophication in a lake or reservoir. Based on the average value of these three TSI, a reservoir or lake can be classified into three general categories of trophic status. The first category is oligotrophic condition that is defined for a clear water body with little phytoplankton and a low nutrient level. The second category is eutrophic condition that is defined for a more turbid and green water body due to dense phytoplankton growth. A mesotrophic condition, however, is intermediate between oligotrophic and eutrophic conditions (Harper, 1992).
The situation described for the eutrophication impact in the Tseng-Wen Reservoir by using average Carlson’s TSI values is shown in Figure 2(a) (EPA, Republic of China, 1993-1998). According to Figure 2(a), eutrophic condition is apparent in most of the years. In the year of 1995, the reservoir system turns out to be mesotrophic mainly due to that lower rainfall and runoff in this year cannot flush as many nutrients as it would be in the other years. Figure 2(b), recording the data of rainfall and runoff, verifies this observation (Ministry of Economics, Republic of China, 2001). Figure 2(c) lists the time series of seasonal total phosphorus loads entering the receiving water body of the Tseng-Wen Reservoir from both the point- and non-point-source within the last decade. Figure 2(d) illustrates the time series of seasonal chlorophyll-a in the water body of the Tseng-Wen Reservoir. Comparing the data in both figures above may discover that higher eutrophication impact appears within the years of 1997 and 1998. As the total phosphorus loads decrease, the concentrations of chlorophyll-a also decrease, as evidenced by the data in 1995. Besides, The intensive land use in this reservoir watershed also generates large inputs of water borne silts and clays that have a complex interaction in the receiving water leading to light-limited production rather than the more typical nutrient impacts. Figure 2(e) depicts the time series of seasonal shallowest Secchi disc value (transparency) measured in the last decade. It ranges from 0.9 m to 4.1 m. Worse transparency situation might result from that algal particles affect the penetration of
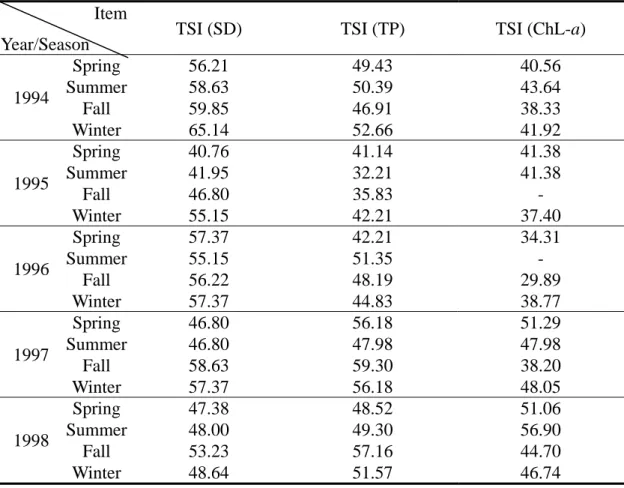
light into the water and therefore, the Secchi depth. In Figure 2 (e), the data in 1995 exhibits the highest transparency implying that the lower the total phosphorus loads, the smaller the amount of chlorophyll-a produces and the higher the transparency appears. Such internal consistency reveals the accuracy and genuineness of these measurements. Based on the time series observations of total phosphorus, chlorophyll-a and transparency, the TSI values associated with three indicators are summarized in Table 1. The critical value of 50 is usually selected for final justification. Comparing the critical value of eutrophication clearly verifies the presence of over-enrichment of total phosphorous and the deterioration of transparency in part of the seasons.
While the nature of the land use in the reservoir watershed varies greatly, an increase in public concern over environmental quality has brought many land use programs, such as the development of beetle nut farm, under intensive debate. Eating beetle nut has been very popular in Taiwan. It is vitally important to the local economy in Southern Taiwan although the beetle nut farms may create severe pressures to land and water resources conservation. Stock farming is another important factor that influences the reservoir water quality. Chang et al. (Chang et al., 1995) assessed the impact of non-point source pollution on reservoir water quality in a multi-objective framework with respect to a future land development program. Uncertainties in land use of reservoir watershed for meeting both economic and environmental goals via an optimization approach were fully discussed by Chang et al. (Chang et al., 1996a, 1996b). Although the planning of land use patterns for the future leading to an optimal balance between economic and environmental objectives in the watershed was fully discussed (Chang et al., 1995; Chang et al, 1996a, 1996b), there is still a need for ensuring whether an individual contribution of non-point source load associated with different land use pattern can be quickly identified. The methodology applicable for a fast assessment of the non-point source loads is thus initiated and developed for assessing the possible entrophication control strategies of the Tseng-Wen Reservoir in this paper.
ANALYTICAL APPROACH
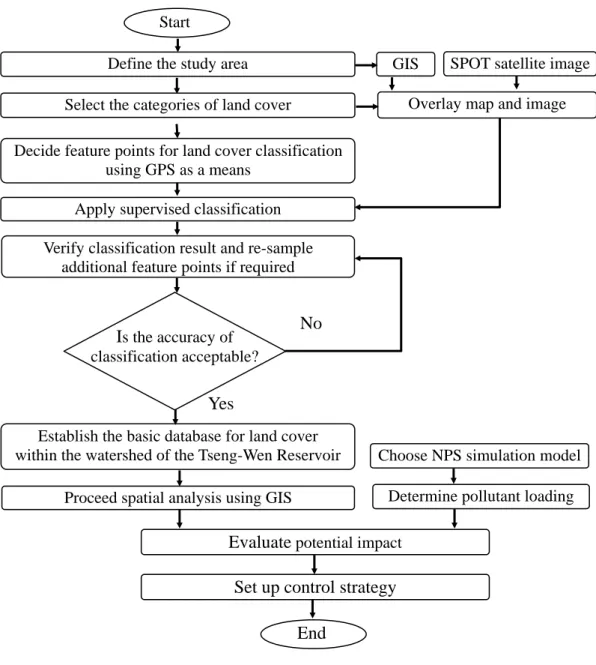
Figure 3 -- the analytical procedure of this study -- addresses the logics of identifying the physical characteristics of land cover by SPOT multi-spectral images in a GIS environment
and estimating the non-point pollutant loading in order for assessing eutrofication control option based on the predicted assimilative capacity of the reservoir. In the beginning, overlay of SPOT image and GIS themes of the study area has to be carried out in order to detect the geographical location of the study area based on the Thematic Mapper (TM) coordinates. The SPOT has high-resolution visible (HRV) imagery, which includes three bands with 20-m resolution color mode and 10-m resolution panchromatic mode. Colorful image includes infrared, red, and green bands corresponding to the wavelength of 0.79~0.89 µm, 0.61~0.68 µm, and 0.50~0.59 µm, respectively. Satellite image reception, archiving, and validation are normally carried out by the Center for Space and Remote Sensing Research before selling the final products to the end-user in Taiwan. Current HRV data precision (80bit) appears suitable for land-cover identification in this study. The entire analysis for land use identification and classification in the watershed of the Tseng-Wen Reservoir is designed based on a practical scale GIS framework. Land use has been further classified by the authors using three thematic raster layers of SPOT digital images that are generated during the time period of 1997-1998 (i.e., March, 1997, November, 1997, and January, 1998). These three SPOT scenes selected for identifying covering portions of the Tseng-Wen Reservoir in South Taiwan must be verified to a status of GICS level 10 by the staff in the Center for Space and Remote Sensing Research before proceeding with various applications. Automatically matching conjugate features in overlapped images is required in some applications. Various direct matching algorithms, including normalized cross correlation coefficient method (NCC), least square method with only horizontal displacement being considered (LSM1), and least square method with horizontal displacement and geometric deformation considered (LSM2), are all applicable methods for different purposes. Due to time differences when producing these three thematic raster layers, direct matching of them is impractical. Instead of using advanced direct matching algorithms, this study applied a different method in which three thematic raster layers were used for land use classification separately and individual outcomes were then integrated together as a whole for final evaluation. They are analyzed using the Erdas Imagine® image processing system in this study.
Application of GPS helps verify the effectiveness of land use classification based on SPOT satellite image. The information gained from GPS can be divided into two groups. One group is prepared as a set of feature points that is designed for a direct calibration of land use
classification in the Erdas Imagine® image processing system. The other group is designed as an additional set of feature points or ground-control points (GCPs) for validation purpose. The overall supervised ground truth classification process can therefore be trained based on the first set of feature points in the first stage and then be validated by the given condition of land use pattern in reservoir watershed with the aid of the second set of feature points in the second stage. Final accuracy can be improved by using available aerial photographs simultaneously within any of these two stages. The process can be manipulated entirely in a GIS environment. Overall, in the way to identifying and discriminating between different land cover classes in the first stage, the image processing system of Erdas Imagine® may classify each SPOT scene into seven unrelated and distinct classes, consisting of tea farm, forested land, barren land, water body, pasture, residential area, and vegetation/fruit farm and then combine each response into the study area as a whole. The information in relation to seven pre-specified land use patterns are then enhanced by a “sliding through” procedure via assigning each spectral class of interest a color and viewing it on the computer monitor within the ArcView® GIS environment in the first stage. The goal in second stage requires entering the second set of feature points for checking the effectiveness of land use classification, followed by image geo-correction and re-sampling through the use of GPS for enhancing the understanding of those unclear regions if required. In any circumstances, the location and spatial pattern have to noted and compared with the existing land use patterns by part of the feature points identified in advance or gained in the re-sampling procedure within the second stage.
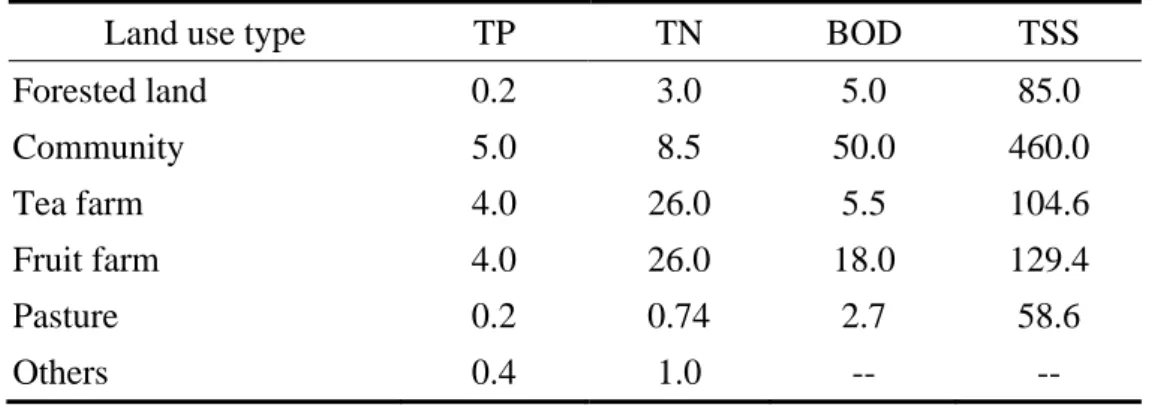
One of the possible applications using the classified land use patterns is to link the outputs of GIS/GPS/RS analysis with a non-point source model. The modeling approach of export coefficients with respect to different land use patterns is selected as a preliminary tool to estimate the pollutant loading in terms of four target constituents in the watershed of the Tseng-Wen Reservoir. In order to minimize the estimation error, several sources in relation to the modeling approach of export coefficients are collected and combined from different studies in Taiwan. They are summarized in Table 2 (Chang et al., 1996; Taipei Feitsui Reservoir Administration Bureau, 1990). With a proper integration of 3S information technologies, seven types of land use patterns can be identified and all data of SPOT digital images have eventually been integrated into the ArcView® system, of which different
calculations about the land use and cover information can be extracted from the GIS database to accomplish the estimation of non-point pollutant loading in the watershed of the Tseng-Wen Reservoir. Thereafter, the spatial analysis module in GIS can be applied for the prediction analysis with respect to each type of land use pattern in the reservoir watershed in the way to establishing the estimation of potential impact due to each type of non-point source. Total impacts of non-point sources can then be calculated with respect to all of the land use patterns identified by SPOT image and GIS operations and corresponding export coefficients. The target constituents of interest in this study include total phosphorus (TP), total nitrogen (TN), biochemical oxygen demand (BOD), and total suspended solid (TSS). For simplicity, specific procedures of the work is described as follow:
1) Import the study area of GIS map layer into Erdas Imagine® and identify useful SPOT image for the designated study area;
2) Classify land use from three SPOT images and verify land use based on part of the feature points identified by the GPS and aerial photographs;
3) Utilize the existing ground truth and verify land use by the supervised approach with the aid of the rest of feature points identified in advance by the GPS and aerial photographs; 4) Inventory agricultural and other land use patterns in the GIS environment and summarize
land use statistics; and
5) Estimate non-point pollutant loading and figure out control strategy.
LAND USE CLASSIFICATION
Figure 4 presents the seventeen natural drainage sub-basins in the watershed. The spatial analysis module embedded in the ArcView ® system is applied for computing the land use statistics corresponding to each drainage sub-basin. Table 3 records the outputs of the final estimation. Except the area covered by the cloud, the land use patterns being categorized include community, fruit farm, tea farm, pasture, forested land, barren land and water body in each sub-basin. Feature points must be used to verify and validate these land use patterns. Figure 5 illustrates the feature points identified by the GPS and aerial photographs. These feature points are applied for calibration and validation purposes when dealing with the land use classification as described in the preceding section. With the aid of information gained
from this supervised classification process, these land use patterns can be delineated as an ArcView® cartographic output as shown in Figure 6. Forested land, tea farm, and pasture constitute approximately 65%, 11%, and 7% of the total area in the watershed, respectively. Overall, the value of total area listed in Table 3 (i.e., 502.31 Km2) is not consistent with that reported in the section of “study area” (i.e., 462.8+22 Km2). This is properly due to the measurement error of the study area, the discrepancy among integration of three thematic raster layers, and the inaccuracy derived from the digitalization process of the GIS map layer.
ESTIMATION OF NON-POINT SOURCE LOADS
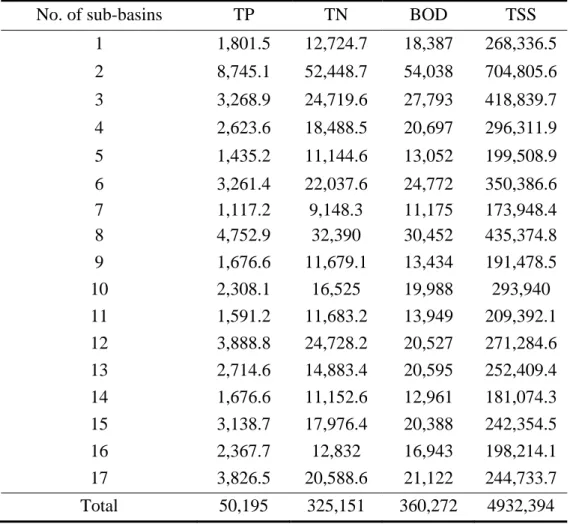
The final evaluation of eutrophication process relates the ambient nutrient loads predicted to the assimilative capacity of reservoir simulated. Since the information of land use patterns in different sub-basin in the Tseng-Wen Reservoir watershed is available in Table 3, simply summing up the individual non-point source impact in each sub-basin can generate final estimation of total nutrient loads in the entire watershed. Table 4 therefore presents the final estimation of the total non-point source loads based on the calibrated model of export coefficients. It appears that sub-basin 2, 3, 8, 12, and 17 generate 50% or more of the total phosphorous load to the Tseng-Wen Reservoir. Unique management policy for land use control is needed.
ESTIMATION OF RESERVOIR ASSIMILATIVECAPACITY
Lee (1992) estimated the assimilative capacity of the Tseng-Wen Reservoir with respect to TP, TN, and BOD based on three different numerical models: zero-dimensional, one-dimensional, and two-dimensional models. They are described as following:
(1) Zero-dimensional model (Reckhow and Chapra, 1983) :
1.2(Q/A) 11.6 /A W C p + = (for TP); Q Wn C= (for TN); V K Q W C 1 b + = (for BOD)
in which C is the concentration of water quality constitute of concern in the reservoir [M/L3]; Wp is the assimilative capacity of TP [M/T]; Wn is the assimilative capacity of TN [M/T]; Wb
is the assimilative capacity of BOD [M/T]; V is the volume of the reservoir or lake [L3]; A is the surface area of reservoir [L2]; K1 is the CBOD deoxygenation rate (T-1); and Q is the inflow of reservoir [L3/T]. (2) One-dimensional model: W C Q C Q X X C V A X X C A E t C V 2 X X i i o 2 X X ∆ + − ± ∂ ∂ − ∆ ∂ ∂ = ∂ ∂
in which C is the concentration of water quality constitute of concern in the reservoir[M/L3]; V is the volume of each stratum [L3]; EX is the dispersion coefficient in horizontal direction [L2/T]; AX is the water surface area of each stratum [L2]; VX is the horizontal velocity [L/T]; Qi is inflow of reservoir [L3/T]; Ci is of water quality constitute of concern in the inflow [M/L3]; Qo is outflow of reservoir [L3/T]; W is sink or source [M/T]; and ∆X is the length of each water stratum assigned [L].
(3) Two-dimensional model: W C Q C Q Z Z C V A X X C V A Z Z C A E X X C A E t C V 2 X X Z Z i i o 2 Z Z 2 2 X X ∂ ∆ + − ± ∂ − ∆ ∂ ∂ − ∆ ∂ ∂ + ∆ ∂ ∂ = ∂ ∂
in which EZ is the dispersion coefficient in vertical direction [L2/T]; VZ is the vertical velocity [L/T]; and ∆Z is the thickness of each water stratum assigned [L].
Overall, in the zero-dimensional simulation model, the whole reservoir is taken into account as a completely mixed reactor in which the concentrations of TP, TN, and BOD are uniform. To improve the prediction accuracy, linkage of water quality and hydrodynamic-biochemical model with higher dimensional consideration is required. In the way to constructing the one-dimensional model, the water body of the Tseng-Wen Reservoir is divided into five non-uniform elements along the horizontal axis of the reservoir in accordance with their respective hydraulic and water quality conditions. However, in the two-dimensional model designed for the Tseng-Wen Reservoir, five grids along the horizontal axis and three to four grids along the vertical axis of the reservoir are comprised of an integrated non-uniform grid system to carry out the water quality simulation practice. Finite
element method is applied for solving both the one-dimensional and two-dimensional models in this study.
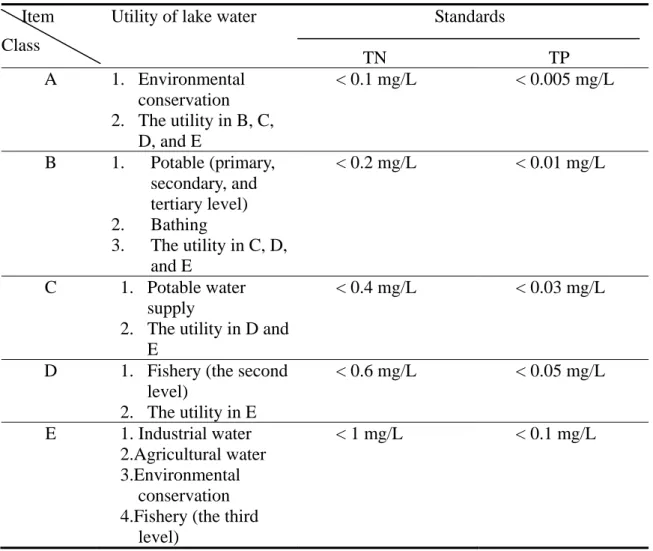
The output of one-dimensional model is considered as baseline information of assimilative capacity. Comparing the simulated nutrient loads to the simulated assimilatice capacity may ensure if the natural resource has been abused in this area. Since there are no control standards of eutrophication for lake or reservoir in Taiwan, the Japanese standards are employed for the estimation of assimilative capacity with respect to both total nitrogen and total phosphorous loads. These standards are shown in Table 5 that is designed particularly to prevent lake eutrophication. Based on the Japanese standards of class B, the maximum allowable total nitrogen concentration and total phosphorous concentration in a lake are 0.2 mg/L and 0.01 mg/L, respectively. Consequently, the assimilative capacity of total nitrogen and phosphorous loads identified with respect to the Japanese standards are 40×103 Kg/year
and 648×103 Kg/year, respectively, based on one-dimensional model (Lee, 1992). Besides, the
assimilative capacity of biochemical oxygen demand predicted based on the water quality standards of class B in Taiwan is predictable. These standards are shown in Table 6. The corresponding estimation is equivalent to 7.1×10⁶ Kg/year based on (Lee, 1992). The
information of estimated assimilative capacity based on one-dimensional model. To gain an overall insight, all of the outputs using these three numerical models as tools are summarized in Table 7.
MANAGEMENT POLICY
Obviously, within the time period of one-year, the estimated total phosphorous load is much higher than the predicted assimilative capacity of total phosphorous according to the one-dimensional model. This observation is quite consistent with the real world measurements, as shown in Figure 2 and Table 1. To further differentiate the discrepancy of potential impact of non-point sources among sub-basins, Figure 7 further classifies the Tseng-Wen Reservoir watershed in terms of three different impact levels or regions. Therefore, sub-basins 2, 8, 12 and 17 are recognized as the regions with the highest impact level due to the runoff from many independent fruit farms and tea farms in those regions. Among those sub-basins identified as the regions with the highest impact level of non-point source loads,
tea farm and fruit farm contribute a major portion of them. Proper management of these two land use patterns becomes crucial from managerial sense. Some other sub-basins, such as 3, 6 and 15 are differentiated as the regions with only the median impact level of non-point source loads. Actions must be taken in the future water quality management policy in order to improve the situation in the regions with highest and median impact levels. Those control scenarios might involve the limitation of pesticide and fertilizer consumption, the removal of stock farming, and the elimination of most beetle nut farms in these sub-basins. This may result in considering a more stringent management policy for land use control by the government agency in the future.
On the other hand, there are almost 5,000 tonnes of sediment yield annually, based on the estimation of total suspended solid in the watershed. This impact could lead to a dramatic reduction of the storage capacity in the Tseng-Wen Reservoir and therefore decrease the flood control capability in the river basin. The extent of sediment yield critically depends on the intensity of rainfall, slope, texture and porosity of soil, erosivity of rainwater, and erodibility of soil. Engineering programs for sediment control should be taken into account extensively to prevent further deterioration of flood control capability in the Tseng-Wen Reservoir.
However, the transfer of water resources from the neighboring Kao-Ping River system through a long distance pipeline will be commissioned formally at the year 2006. From long-term perspective, land use pattern in the Tseng-Wen Reservoir watershed could be intimately linked with the non-point source impact in the upstream area of the Kao-Ping River Basin. The potential impact of non-point source loads to the eutrophication problem in the Tseng-Wen Reservoir due to water transfer could be acute. To control this impact, sufficient attention was driven to consider how to change the farming practices, such as proper control of pesticide and fertilizer, and to reduce the non-point sources pollution on the farmland as part of the best management practice (BMP) program in the Kao-Ping River Basin. The idea using economic instrument as a policy tool to improve management efficiency was considered and discussed by the Environmental Protection Administration in Taiwan at the year 2000. The application of transferable permits between point- and non-point-source (i.e., permit trading) could be a feasible option.
CONCLUSION
Due to rapid economic and population growth in the last decade, the role of reservoir watershed management in Taiwan has evolved from the water resources conservation and utilization toward the maximization of land use potential that may further endanger the reservoir water quality. Like many other countries in the world, when enjoying the economic prosperity, Taiwan is experiencing serious water quality issue as a result of eutrophication. This paper addresses a fast assessment methodology for eutrophication control in the Tseng-Wen Reservoir. With the aid of GIS/GPS/RS information technologies as well as several calibrated numerical models, the management policy for land use control can be provided in terms of different impact levels of non-point sources in the watershed. The types of land use identified by Erdas GIS® include residential area, fruit farm, tea farm, pasture, forested land, barren land, and water body. Identification of land cover categories using SPOT satellite image as a tool associated with the modeling approach in terms of export coefficients is proven as an applicable procedure for the estimation of non-point source loads in a timely manner. Comparing the gross estimate the assimilative capacity of the Tseng-Wen Reservoir to the predicted non-point source load of total phosphorous helps verify why the eutrophic condition is apparent in most of the years in the last decade, when the rainfall and runoff are abundant. Overall, the current water quality management in the Tseng-Wen Reservoir requires providing essential phosphorus control strategy to ease the impact of eutrophication. The control scenarios might involve the limitation of pesticide and fertilizer consumption, the removal of stock farming, and the elimination of most beetle nut farms in this area. This may result in considering a more stringent policy for land use control by the government agency in the future.
However, the major problems encountered in this study are the difficulty in getting regular cloud free satellite data and the inefficiency when classifying special types of land use patterns, such as beetle nut farm, which might have greater impact to reservoir water quality. In addition, a color composite approach with different infrared or green light reflectance in different year may explore the implication of land use change over time. This could be significant for monitoring the long-term changes of non-point source loads in the reservoir watershed and for providing an early-warning message in policy decision-making of local
land use program in the future. In contrast to point sources, non-point-source-derived nutrient loads have to be characterized by large temporal and spatial variability. Using advanced non-point sources pollution model, such as AGNPS or HSPF model, instead of export coefficient method, along with high-resolution satellite image, such as Ikonos image, to assess the effectiveness of specific control strategy could be a valuable and challenging future work.
Acknowledgement
The authors deeply acknowledge the financial support from the National Science Council (NSC-87-2211-E-006-012) in Taiwan and the data report cited and used in this study.
References
Beasley, D. B. and Huggins, L. F., ANSWERS (Aerial Nonpoint Source Watershed
Environmental Response Simulation) User Manual, Agricultural Engineering Department, Purdue University, Indiana, 1982.
Bailey, G. W., Swank, R. R., Jr., and Nicholson, H. P., Predicting pesticide runoff from agricultural lands: a conceptual model, Journal of Environmental Quality, Vol. 3, 95-102, 1974.
Bartodziej, J. W. and Ludlow, J., Aquatic vegetation monitoring by natural resource agencies in the United States, Lake and Reservoir Management, Vol. 13, pp. 109-117, 1997.
Chang, J. K., Yu, J. S., and Hsu, M. L., Non-point pollutant loading assessment for the watershed of the Derchi Reservoir, Proceedings of the Ninth Annual Conference of
Environmental Planning and Management, National Central University, Chungli, Taiwan, 30-36,1996.
Chang. N. B., Wen, C. G., and Wu, S. L., Optimal management of environmental and land resources in a reservoir watershed by multi-objective programming, Journal of
Environmental Management, Vol. 44, 145-161, 1995.
Chang. N. B., Wen, C. G., Chen, Y. L., and Yong, Y. C., Optimal planning of the reservoir watershed by grey fuzzy multi-objective programming (I): theory, Water Research, Vol. 30, No. 10, pp. 2329-2334, 1996a.
Chang. N. B. Wen, C. G., Chen, Y. L. and Yong, Y. C. Optimal planning of the reservoir watershed by grey fuzzy multi-objective programming (II): application, Water Research, Vol. 30, No. 10, pp. 2335-2340, 1996b.
Chen, H.W. and Chang, N. B., Water pollution control in the river basin by genetic algorithm-based fuzzy multi-objective programming modeling, Water Science and
Technology, Vol. 37, No. 8, pp. 55-63,1998.
Carlson, R. E., A trophic state index for lakes, Limnology and Oceanography, Vol. 22, pp. 361-369, 1977.
Cooke, G. D., Welch, E. B., Peterson, S. A., Newroth, P. R., Restoration and Management of Lakes and Reservoirs, 2nd edition, Lewis Publishers, Boca Raton, 1993.
Dikshit, A. K. and Loucks, D. P., Estimating non-point pollutant loading I: a geographical-information-based non-point source simulation model, Journal of
Environmental Systems, Vol. 24, No. 4, 395-408, 1995.
Dikshit, A. K. and Loucks, D. P. Estimating non-point pollutant loading II: a case study in the Fall Creek Watershed, New York, Journal of Environmental Systems, Vol. 25, No. 1, 81-95, 1996.
Donigian, A. S. and Davis, H. H., User Manual for Agricultural Runoff Management (ARM)
Model, EPA-600/3-78-080, U.S.EPA, Washington, D.C., 1978.
Donigian, A. S. and Crawford, N. H., Modeling Non-point Pollution from the Land Surface, EPA-600/3-76-083, U.S.EPA, Washington, D.C., 1976.
Donigian, A. S., Imhoff, J., C., and Davis, H. H., Users Manual for Hydrological Simulation
Program – Fortran (HSPF), EPA-600/9-80-015, U.S.EPA, Washington, D.C., 1980. Donigian, Jr., A. S., Huber, W. C., and Barnwell, Jr., T. O., Models of non-point source water
quality for watershed assessment and management, Proceedings Watershed '96, Moving
ahead Together Technical Conference and Exposition, June 8 - 12, Baltimore, Maryland, USA, 1996.
Environmental Protection Administration, R.O.C., Annual Monitoring Statistics of Reservoir
Water Quality in Taiwan (1993-1998), EPA Reports, Taipei, Taiwan.
Goodchild, M. F., Steyaert, L. T., Parks, B. O, Johnston, C. J., Maidment, D., Crane, M., and Glendinning, S. (editors), GIS and Environmental Modeling: Progress and Recent
research, GIS World, Inc., Fort Collins, CO, USA, 1996.
Gajbhiye, V. T., Kalra, N., Mohapatra, S. P., and Agnihotri, N. P., Non-point pollution of Ganga River with pesticides: a quantitative approach. Journal of Environmental Systems, Vol. 24, No. 1, 95-110, 1995.
Haith, D. A., Reynolds, J. E., Landre, P. T., and Richard, T. L., Sludge loading rates for land,”
Journal of Environmental Engineering, ASCE, Vol. 118, No.2, 196-208, 1992.
Horne, A. J. and Goldman, C. R., Limnology, 2nd ed., McGraw-Hill, New York, USA, 1994. Heiskary, S.A., Lake assessment program: a cooperative lake study program, Lake and
Reservoir Management, Vol. 5, pp. 85-94, 1989.
Harper, D., Eutrophication of Freshwaters, Chapman and Hall, New York, USA, 1992. . Knisel, W. G., CREAMS: A Field Scale Model for Chemical, Runoff, and Erosion from
Agricultural Management Systems, Conservation Report 26, U.S. Department of Agriculture, Washington, D.C., 1980.
Kaufman, L., Catastrophic change in species-rich freshwater ecosystems: the lessons of Lake Victoria, Bioscience, Vol. 42, pp. 846-859, 1992.
Liang, S. and Chen, C. Y., Conjunctive use of GIS and watershed model for environmental protection, Proceedings of 1995 International Symposium on Geographic Information
System for Environmental Protection, March 16-17, Taipei, Taiwan, 188-207, 1995. Lee, C. S., The Prediction of Assimilative Capacity of Reservoir in Taiwan, Master Thesis,
National Cheng-Kung University, Tainan, Taiwan, 1992.
Miller, A. B., Bryant, E. S., and Birnie, R. W., An analysis of land changes in the Northern Forest of New England using multi-temporal Landsat MSS data, International Journal
of Remote Sensing, Vol.19, No. 2, 255-265, 1998.
Metcalf & Eddy, Inc., University of Florida and Water Resources Engineers, Inc., Storm Water
Management Model, Water Pollution Control Research Series, EPA Reports 11024-DOC-07/71 through 11024-DOC-10/71, U.S. EPA, Washington, D. C., 1971. Ministry of Economics, Republic of China, http://office.wca12.gov.tw/, 2001.
Reckhow, K.H. and Chapra, S. C., Engineering Approaches for Lake Management. Vol.1, Butterworths Publishers, South Africa,1983.
Reckhow, K.H. and Stow, C., Monitoring design and data Analysis for trend detection. Lake
and Reservoir Management, Vol. 6, pp. 49-60, 1990.
Safe, A. K. and Choudhury, P. R., Integrated remote sensing and GIS for groundwater exploration and identification of artificial recharge sites, International Journal of
Remote Sensing, Vol.19, No. 10, 1825-1841, 1998.
Schindler, D. W., Evolution of phosphorus limitation in lakes, Science, Vol. 195, pp. 260- 262, 1977.
Shoemaker, L. Lahlou, M. Bryer, M., Kumar, D. and Kratt, K., Compendium of tools for watershed assessment and TMDL development, USEPA, Washington, D. C., USA, May 1997.
Taipei Feitsui Reservoir Administration Bureau, Forecasting of Water Quality and Pollution
Control in Feitsui Reservoir, Taipei, Taiwan, 1990.
U.S. Army, Storage, Treatment, Overflow, Runoff Model “STORM”-Users Manual. Corps of Engineers, U.S. Army, 1977.
Yool, S. R., Land cover classification in rugged areas using simulated moderate-resolution remote sensor data and artificial neural network, International Journal of Remote
Sensing, Vol.19, No. 1, pp. 85-95, 1998.
Young, R. A., Onstad, C. A., Bosch, D. D., and Anderson, W. P., AGNPS: a non-point source pollution model for evaluating agricultural watersheds, Journal of Soil and Water
Table 1: The summary of TSI values in the Tseng-Wen Reservoir (EPA, Taiwan, 1993-1998) Item
Year/Season TSI (SD) TSI (TP) TSI (ChL-a)
1994 Spring 56.21 49.43 40.56 Summer 58.63 50.39 43.64 Fall 59.85 46.91 38.33 Winter 65.14 52.66 41.92 1995 Spring 40.76 41.14 41.38 Summer 41.95 32.21 41.38 Fall 46.80 35.83 - Winter 55.15 42.21 37.40 1996 Spring 57.37 42.21 34.31 Summer 55.15 51.35 - Fall 56.22 48.19 29.89 Winter 57.37 44.83 38.77 1997 Spring 46.80 56.18 51.29 Summer 46.80 47.98 47.98 Fall 58.63 59.30 38.20 Winter 57.37 56.18 48.05 1998 Spring 47.38 48.52 51.06 Summer 48.00 49.30 56.90 Fall 53.23 57.16 44.70 Winter 48.64 51.57 46.74
Table 2: Typical export coefficients for several types of land use patterns in Taiwan
Land use type TP TN BOD TSS
Forested land 0.2 3.0 5.0 85.0 Community 5.0 8.5 50.0 460.0 Tea farm 4.0 26.0 5.5 104.6 Fruit farm 4.0 26.0 18.0 129.4 Pasture 0.2 0.74 2.7 58.6 Others 0.4 1.0 -- -- Unit: kg/ha/yr
Table 3: Land use pattern in different sub-basin in the watershed of the Tseng-Wen Reservoir Category of
No. land use of Sub-basins A B C D E F G H Total (Km2 ) 1 1.05 0.42 1.55 2.37 21.67 0.37 0.88 0.06 28.40 2 4.32 3.57 10.74 5.67 37.07 0.87 1.55 0.97 64.78 3 0.99 1.25 3.75 2.88 35.41 0.02 0.90 0.40 45.65 4 0.98 1.25 2.83 1.77 22.94 0.00 0.40 1.10 31.31 5 0.42 0.52 1.57 1.65 17.29 0.00 0.35 0.37 22.21 6 1.34 1.46 3.58 3.31 25.05 0.71 0.68 0.22 36.38 7 0.32 0.33 1.19 1.05 16.01 0.00 0.37 0.00 19.30 8 1.40 2.21 6.22 4.05 29.90 0.13 1.01 0.00 44.93 9 0.69 0.74 1.79 1.09 14.71 0.10 1.34 0.00 20.48 10 0.98 0.72 2.53 2.18 23.57 0.51 0.85 0.00 31.35 11 0.59 0.51 1.76 2.20 16.98 0.15 0.49 0.00 22.70 12 1.20 2.18 5.21 1.97 14.37 0.14 2.96 0.00 28.05 13 2.05 1.22 2.28 1.23 13.10 0.48 6.71 0.11 27.21 14 0.75 0.78 1.74 1.75 12.70 0.08 0.83 0.05 18.71 15 1.80 2.12 2.84 0.74 11.50 0.09 3.89 0.10 23.13 16 1.70 1.46 1.83 0.57 9.22 0.00 3.44 0.00 18.25 17 2.22 1.95 4.36 2.14 6.5 0.30 0.87 0.56 19.40 Total (Km2) 22.87 22.76 55.85 36.68 328.53 4.00 27.60 3.98 502.31
Note: A: community; B: fruit farm; C: tea farm; D: pasture; E: forested land; F: barren land; G: water body; H: cloud
Table 4: The estimated non-point source loads in each sub-basin in the Tseng-Wen Reservoir watershed
No. of sub-basins TP TN BOD TSS
1 1,801.5 12,724.7 18,387 268,336.5 2 8,745.1 52,448.7 54,038 704,805.6 3 3,268.9 24,719.6 27,793 418,839.7 4 2,623.6 18,488.5 20,697 296,311.9 5 1,435.2 11,144.6 13,052 199,508.9 6 3,261.4 22,037.6 24,772 350,386.6 7 1,117.2 9,148.3 11,175 173,948.4 8 4,752.9 32,390 30,452 435,374.8 9 1,676.6 11,679.1 13,434 191,478.5 10 2,308.1 16,525 19,988 293,940 11 1,591.2 11,683.2 13,949 209,392.1 12 3,888.8 24,728.2 20,527 271,284.6 13 2,714.6 14,883.4 20,595 252,409.4 14 1,676.6 11,152.6 12,961 181,074.3 15 3,138.7 17,976.4 20,388 242,354.5 16 2,367.7 12,832 16,943 198,214.1 17 3,826.5 20,588.6 21,122 244,733.7 Total 50,195 325,151 360,272 4932,394 Unit: kg/yr
Table 5: The water quality standards designed for lake eutrophication control in Japan
Item Utility of lake water Standards
TN TP A 1. Environmental conservation 2. The utility in B, C, D, and E < 0.1 mg/L < 0.005 mg/L B 1. Potable (primary, secondary, and tertiary level) 2. Bathing 3. The utility in C, D, and E < 0.2 mg/L < 0.01 mg/L C 1. Potable water supply
2. The utility in D and E
< 0.4 mg/L < 0.03 mg/L
D 1. Fishery (the second level) 2. The utility in E < 0.6 mg/L < 0.05 mg/L E 1. Industrial water 2.Agricultural water 3.Environmental conservation 4.Fishery (the third
level)
< 1 mg/L < 0.1 mg/L Class
Table 6: The water quality standards designed for surface water quality control in Taiwan Class A B C D E Utility Standard Index
1.Public water supply (primary level) 2.Swimming
1.Public water supply (secondary level) 2.Fishery (primary level) 1.Potable water supply (third level) 2.Fishery (secondary level) 3.Industry water supply (primary level) 1.Irrigation 2.Industrial water supply (secondary level) Environmental conservation pH DO, mg/L Coliform, MPN/100ml BOD5 (20℃), mg/L SS, mg/L 6.5 ~ 8.5 >6.5 <50 <1 <25 6.0 ~ 9.0 >5.5 <5000 <2 <25 6.0 ~ 9.0 >4.5 <10000 <4 <40 6.0 ~ 9.0 >2.0 — — <100 6.0 ~ 9.0 >2.0 — — — Note: DO: Dissolved Oxygen; BOD5: Biochemical Oxygen Demand; SS: Suspended Solids
Table 7: The estimated assimilative capacity of the Tseng-Wen Reservoir. Water quality constitutes Zero-dimensional model One-dimensional model Two-dimensional model BOD5 (106 Kg/yr)* 7.1 7.2 - TP (103 Kg/yr)** 42.4 40.0 38.1 TN (103 Kg/yr)** 640.0 648.0 654.0 *
Based on the water quality standard of class B in Taiwan. **
Figure 1: The geographical location of the Tseng-Wen Reservoir and Tseng-Wen River Basin ⊕1 Tseng-Wen 3 ⊕11 Jen-Ai ⊕2 Tseng-Wen 1 ⊕12 Kuan-Yueh ⊕3 Feng-Lee ⊕13 Fan-Tsai-Tien 1 ⊕4 Yu - Ching ⊕14 Fan-Tsai-Tien 2 ⊕5 Erh-His ⊕15 Hou-Ying ⊕6 Yu-Feng ⊕16 Ma-San ⊕7 Shan-Shang ⊕17 His-Wei ⊕8 Chis-Pa ⊕18 An-Ting ⊕9 Pa-Shih-Chou ⊕19 Fsi-Kang ⊕10.Tseng-Wen-Hsi ⊕20 Hou-Hsing
Hydraulic Monitoring Station:
◎ 1: Yu -Tien ◎ 2: Tso - Chen ◎ 3: Ma - San ◎1 ◎2 ◎3 Tseng-Wen Reservoir Wu-San-Tou Reservoir Nan-Hua Reservoir Kaohsiung City Taipei City Tseng-Wen River Basin ◎ ◎ 5 0 RK 60.9 RK 45.6 RK 39.5 RK 35.5 RK 26.2 RK 16.8 RK 5.0
Figure 2(a): The eutrophicayion phenomena of the Tseng-Wen Reservoir in Taiwan (EPA, Republic of China, 1993-1998)
Figure 2(b): The annual average rainfall of the Tseng-Wen Reservoir in Taiwan (Ministry of Economics, Republic of China, 2001)
25 30 35 40 45 50 55 60 1992 1993 1994 1995 1996 1997 1998 1999 Year spring summer fall winter Oligotrophic Mesotrophic Eutrophic Carlson TSI 0 500 1,000 1,500 2,000 2,500 3,000 3,500 1992 1993 1994 1995 1996 1997 1998 1999 2000 Year 0 200 400 600 800 1,000 1,200 1,400 Annual Rainfall Reservoir Inflow
Annual Rainfall (mm) Reservoir Inflow (T
Figure 2(c): The annual average concentration of total phosphorous in the Tseng-Wen Reservoir (EPA, Republic of China, 1993-1998)
Figure 2(d): The annual average concentration of chlorophyll-a in the Tseng-Wen Reservoir (EPA, Republic of China, 1993-1998)
0 10 20 30 40 50 60 70 80 90 1992 1993 1994 1995 1996 1997 1998 1999 2000 Year spring summer fall winter TP (µg/L) 0 1 2 3 4 5 6 7 8 9 10 11 1992 1993 1994 1995 1996 1997 1998 1999 2000 Year spring summer fall winter Chloropp hyll -a ( µ g/L)
Figure 2(e): The annual average transparency in the Tseng-Wen Reservoir (EPA, Republic of China, 1993-1998) 0 1 2 3 4 5 1992 1993 1994 1995 1996 1997 1998 1999 2000 Year Spring Summer Fall Winter T ransparen cy (m)
SPOT satellite image Select the categories of land cover
Decide feature points for land cover classification using GPS as a means
Apply supervised classification Verify classification result and re-sample
additional feature points if required
Establish the basic database for land cover within the watershed of the Tseng-Wen Reservoir
GIS
Determine pollutant loading Proceed spatial analysis using GIS
Start
Define the study area
Overlay map and image
Is the accuracy of classification acceptable?
Yes
No
Evaluate potential impact
End
Choose NPS simulation model
Set up control strategy
Figure 5: The distribution of feature points for calibration in the Tseng-Wen Reservoir watershed
GPS river
reservoir sub-watershed
feature points(from aerial photograph) feature points(from GPS record) river
reservoir sub-watershed
Figure 4: The system environment of the Tseng-Wen Reservoir.
Legend: Legend: 29 1 2 3 4 5 6 7 8 9 10 11 12 13 14 15 16 17
Legend: cloud community fruit farm tea farm pasture forested lands barren land water body
Figure 6: The identified land use patterns in the watershed of the Tseng-Wen Reservoir wateshed
Figure 7: The impact levels of pollution loading in the watershed of the Tseng-Wen Reservoir wateshed
water body
low level of pollution load median level of pollution load high level of pollution load
Legend:
Bibliography of the Authors
Ni-Bin Chang received his B.S. degree from the Department of Civil Engineering, National Chiao-Tung University in 1983. After 4 years working as an engineer in the Navy and government agencies in Taiwan, he awards a prestigious government scholarship for overseas study, and, later on, he received his M.S. and Ph.D. degrees both in the field of Environmental Systems Engineering at Cornell University in 1989 and 1991, respectively. Between 1991 and 1992, he worked for American and German consultant firms as a deputy manager in Taipei, Taiwan. Dr. Chang affiliated with the Department of Environmental Engineering, National Cheng-Kung University as an associate professor since 1992, and he got promoted to a full professor position in 1997. Until 2001, he has published over 70 referred journal articles, over 140 papers in the international and domestic conferences, and 4 graduate level textbooks in Chinese. Dr. Chang was also awarded the “Best Research Award” by the National Science Council in Taiwan at the year of 1997 and 1999. His name was listed in the well-known surveys of “Who is Who in the World” twice (1999 and 2000) and “Who is Who in Science and Engineering” (1999).
K. Y. Jeng received his B.S. degree from the Department of Environmental Engineering, National Cheng-Kung University in 2000. He is currently a Master student in the Department of Environmental Engineering, National Cheng-Kung University
H. W. Chen received his B.S. degree from the Department of Environmental Science, Tung-Hai University in 1993. He further awards his M.S. and Ph.D. degrees in the Department of Environmental Engineering, National Cheng-Kung University in 1995 and 1999, respectively. He is currently working for the Army as a lieutenant in Taiwan.
S. K. Ning received his B.S. degree from the Department of Hydraulic and Oceanic Engineering, National Cheng-Kung University in 1986 and M.S. degree from the Department of Environmental Engineering, National Cheng-Kung University in 1988. He is currently a Ph.D. candidate in the Department of Environmental Engineering, National Cheng-Kung University and also affiliated with the Department of Environmental Engineering, Kun-Shan University of Technology in Taiwan.
C. S. Lee received his B.S. degree from the Department of Environmental Engineering, National Cheng-Kung University in 1992 and M.S. degree from the Department of Environmental Engineering, National Cheng-Kung University in 1994. He further awards a Ph.D. in the Department of Environmental Engineering, National Cheng-Kung University in 1998. After experiencing a two-year military service and a one-year post doctor program, he is currently affiliated with the Department of Environmental Engineering, Kun-Shan University of Technology in Taiwan as an assistant professor.