For the presentation at the Air and Waste Management Association’s 97th
Annual Meeting and Exhibition, June 22-25, Indianapolis, Indiana, USA
Characteristics of Volatile Organic Compounds in the
Atmosphere at the Surrounding Area of an
Oil-Contaminated Remediation Site
Control No. 648
Cho-Ching Lo, Wei-Chin Chen, and Chung-Shin Yuan
Institute of Environmental Engineering, National Sun Yat-Sen University, No. 70, Lian-Hai Road, Kaohsiung City, Taiwan, ROC
Ching Yuan
Department of Civil and Environmental Engineering, National University of Kaohsiung, 700, Kaohsiung University Road, Kaohsiung County, Taiwan, ROC
ABSTRACT
This study aims to investigate the characteristics of atmospheric volatile organic compounds (VOCs) emitted from an oil-contaminated remediation site. A sampling network including five sampling sites located at the surrounding area of the
oil-contaminated remediation site and nearby community was established for
sampling VOCs near ground level. In this study, VOCs were collected by carbontrap 300 packed multi-bed sampling tubes from February 2002 to April 2003. The tubes were then desorbed by a thermal desorption unit (TDU) and then analyzed by a gas chromatography with a flame ionization detector (GC/FID). In addition, methane and non-methane hydrocarbons (NMHC) were automatically monitored in-situ and correlated with the concentration of VOCs. Results from field measurements showed that the concentration of NMHC at the upwind of oil-contaminated
remediation site was generally lower than the downwind site at nearby community. Major VOCs observed in the atmosphere were n-octane, toluene, and m,p-xylene. The mass ratios of toluene to benzene (T/B) were similar to the tail pipe exhaust gas’s T/B of 2.0-2.3. Similar trend was observed for the mass ratio of benzene, toluene, ethylbenzene, and m,p-xylene (BTEX). The results suggested that the atmospheric VOCs at the surrounding area of the oil-contaminated remediation site was mainly emitted from automobiles on the highway rather than from soil gas emitted from oil-contaminated remediation site. Health risk assessment indicated that the cancer risk criteria ranged from 1.1x10⁻⁹ to 7.8x10⁻⁸, while the non-cancer hazard indexes ranged from 8.4x10⁻⁵ to 3.7x10⁻³. Both cancer and non-cancer hazard risks did not violate the regulation of 1.0x10⁻⁶ and unity, respectively.
INTRODUCTION
Accidental releases of petroleum products from underground storage tanks (USTs) or aboveground storage tanks (ASTs) are one of the most common causes of soil and groundwater contamination. Current attention focused on human health and safety concerning the release of hydrocarbons to the environment. Petroleum hydrocarbons
contain benzene, toluene, ethylbenzene, xylene isomers (BTEX), n-octane, and polycyclic aromatic hydrocarbons (PAHs), the major components of fuel oils, which are hazardous substances regulated by the Environmental Protection Agency of United States (USEPA).(1-2) Besides, methyl tert-butyl ether (MTBE) has been used as a gasoline additive to improve the combustion efficiency and to replace lead since 1978.(3) Currently, MTBE has been one of the prevalent groundwater contaminants because it is widely used and it has been disposed inappropriately. MTBE is a highly water- soluble compound and its biodegradation rate is low in many cases. Recent studies indicate that MTBE is a possible human carcinogen. Thus, USEPA has set its advisory level for drinking water at 20-40 µg/L.(3-5) In the past, cleanup goals were often established without regard to risk, mandating remediation of groundwater to background or non-detection levels, to maximum contaminant levels, or to some level of total petroleum hydrocarbons (TPH). However, there has been a significant regulatory shift toward risk-based standards and a growing acceptance of natural attenuation as an important component of petroleum site remediation since 1994.(5) Moreover, reacting with nitrogen oxides in the nitrogen dioxide photolytical cycles, VOCs could also form photochemical oxidants such as peroxyacetyl nitrates (PAN) during photochemical smog, which results in the deterioration of ambient air quality. Exposure to the ambient atmosphere containing VOCs and oxidants would cause severely adverse effects on human health.(6-7) In general, VOCs are emitted mainly from fugitive sources, especially from oil refinery and/or petrochemical plants, rather than stationary sources.(8-10) Recently, emission of VOCs to the ambient air from oil-contaminated sites has been paid more attention.
In order to prevent and control the emission of VOCs, Taiwan Environmental Protection Administration (TEPA) has passed an Act entitled “Volatile Organic Compounds Control and Emission Standards” on February 5th
, 1997. VOCs emitted from pumps, flanges, storage tanks, and flares are regulated by enforcement, which push the oil refineries and petrochemical plants to reduce the fugitive emission of VOCs in order to meet the VOCs Control and Emission Standards. Moreover, spilling of petroleum products from pipelines and storage tanks results in the deterioration of ambient air quality, which thus causes adverse effects on human health. However, the concentration and emission of VOCs at the surrounding atmosphere of oil-spilled sites before and after remediation process has not been thoroughly investigated in Taiwan. Thus, it is important to characterize ambient VOCs and to assess their health hazards at the oil-contaminated remediation site. The objective of this study was to investigate the characteristics of atmospheric VOCs at the surrounding area of an oil-contaminated site and to conduct the health risk assessment after remediation process. The results would be useful for further evaluating whether the remediation of the oil-contaminated site has been fully accomplished or not.
METHODOLOGIES
Oil-contaminated Remediation Site
An oil-contaminated remediation site located at the suburb of Chia-yi County, Taiwan was selected for this particular investigation. Farms with an oil transfer station and a nearby community surround the oil-contaminated remediation site. The community
has population of approximately 2,000 and is thought as the sensitive site. Besides, an intercity highway (national HW #1) and a local road (county road #163) are neighbored to the oil-contaminated remediation site. The location of the
oil-contaminated remediation site and its neighboring area is illustrated in Figure 1. According to the report of China Petroleum Company (CPC), the spilled oil from underground pipelines was gasoline. The remediation of the oil-contaminated site has been conducted by soil replacing method by CPC for more than two years.
Sampling Sites
In order to characterize the atmospheric VOCs at the surrounding area of the oil-contaminated remediation site, VOCs samples were collected once every three months from February 2002 to April 2003 (a total of six seasons). A sampling network was established to collect ground level VOCs for this particular study. As illustrated in Figure 1, the sampling network included five sampling sites located at the upwind site (site A), the oil-spilled site (site C), the nearby community (sites B and D), and the downwind site (site E), respectively. Among them, site B was located at the downwind of highway and the upwind of oil-spilled site. The location of these five sampling sites might vary with prevailing wind direction for different seasons.
Sampling Methods
In this study, the sampling of VOCs was conducted by collecting ambient air through a multi-bed stainless steel trapping tubes by an air-sampling pump with constant flow rate. Figure 2 illustrates the sampling and analytical procedures of ambient
hydrocarbons (i.e. methane and non-methane hydrocarbons), atmospheric VOCs, and meteorological parameters (i.e. wind speed and wind direction). Gas samples were collected at a sampling flow rate of 0.15 l/min by air-sampling pumps (SKC, model 222-3) for approximately three hours. The multi-bed stainless steel trapping tubes were packed with three various adsorbents: 125mg Carbosieve S-III, 200mg
Carbontrap B, and 300 mg Carbontrap C (USEPA Method TO-17). The types of VOCs further analyzed in this study included benzene, toluene, ethylbenzene, m,p-xylene, n-octane, and MTBE. Hydrocarbons and meteorological parameters were continuously monitored to correlate with the concentration of atmospheric VOCs at the surrounding area. Gas samples were collected by Tedlar bags using air-
sampling pumps of 0.1 l/min (BUCK, model IH) and further analyzed with a THC analyzer.
Analytical Methods
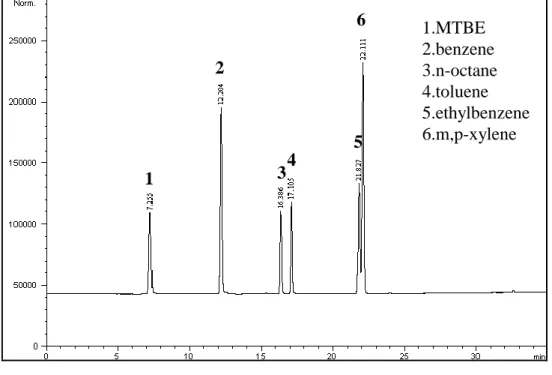
After being sampled by the multi-bed stainless steel trapping tubes, VOCs samples were further desorbed by a thermal desorption unit (TDU), separated with a capillary separation column (SUPELCO VOCOL), and then analyzed by a gas chromatography with a flame ionization detector (GC/FID). The gas chromatography (HP, model 5890 Series II) was equipped with a cryo-focussing inlet system connected to a single split/splitless injector and detector, to which the capillary separation column was connected. The capillary separation column was 60 m × 0.53 mm ID with the maximum temperature of 230℃. The analytical spectrum of VOCs standard gases detected by the GC/FID is illustrated in Figure 3.
Figure 1. Sampling location of VOCs at the oil-contamination remediation site in the
suburb of Chia-yi County, Taiwan.
Farm Transform CPC Station Oil-contaminated remediation site Hi gh way Farm Farm Farm 163 road N o rt h w ar d S o u th w ar d Community Farm Wind direction A▲ B▲ ▲C D ▲ ▲E ▲sampling site 6 China Taiwan Japan Korea Taiwan Strait Pacific Ocean Pencadores Taiwan Taipei Kaoshiung Green Island Lan Yu Island Chia-yi County
Figure 2. Flow chart for sampling and analysis of VOCs.
Figure 3. Analytical spectrum of VOCs standard gases measured with GC/FID.
Quality Assurance and Quality Control (QA/QC)
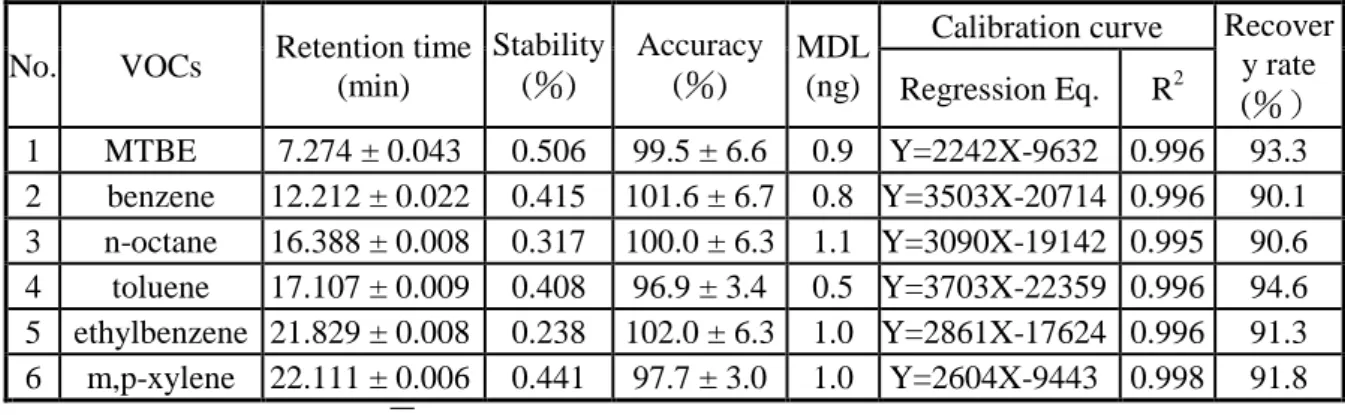
The quality assurance and quality control data for the chemical analysis of VOCs samples are summarized in Table 1. In this study, the error of retention time for the detectable VOCs as shown in the analytical spectrum of GC/FID ranged from 0.006 to 0.043 minutes. The accuracy of chemical analysis ranged from 95.5 to 102.0 %,
Volatile organic compounds (VOCs)
Multi-bed trapping tubes
In-situ samples Field blank
Thermal desorption GC/FID Tedlar sampling bags THC analyzer Meteorological parameters Meteorological instrument 1.MTBE 2.benzene 3.n-octane 4.toluene 5.ethylbenzene 6.m,p-xylene 1 2 3 4 5 6
while the analytical stability ranged from 0.238 to 0.506 %. The detection limit of the analytical method for each compound ranged from 0.5 to 1.1 ng. The R2 of calibration curves must be higher than 0.995 and the recovery rate ranged from 90.1 to 94.6 %. These results indicated that the analytical methods of VOCs (USEPA TO-17) were satisfied with the proposed quality assurance requirements.
Health Risk Assessment
Both cancer and non-cancer hazards were further assessed based on the field-
measured concentration of benzene, toluene, ethylene, and m,p-xylene (BTEX) during the sampling period. The cancer and non-cancer hazards were compared with cancer risk criteria of 1.0x10⁻⁶ and non-cancer hazard index of unity. The cancer and
non-cancer hazards were estimated by the following two equations, (a). Cancer hazard risk: R = CDI x SF (Criteria =1x10⁻⁶) (b). Non-cancer hazard isk: HI = I/RfD (Hazard index = 1.0)
where R is the cancer hazard risk; CDI is the cancer daily average exposure dosage (mg/kg-day); SF is the cancer hazard slope (kg-day/mg); HI is the non-cancer hazard risk; I is the non-cancer exposure dosage (mg/kg-day); RfD is the non-cancer
reference exposure dosage (mg/kg-day).
Table 1. Quality assurance and quality control results for VOCs analysis.
RESULTS AND DISCUSSION
Methane and Non-Methane Hydrocarbons
In this study, methane and non-methane hydrocarbons (MHC and NMHC) were continuously monitored in-situ at the surrounding area of the oil-contaminated remediation site. Field measurements of hydrocarbons indicated that methane concentration maintained almost constant and varied slightly with sampling location and season. Methane concentrations of approximately 2.5-2.7 ppm were observed in the ambient atmosphere since methane was mainly emitted from natural and
No. VOCs Retention time (min) Stability (%) Accuracy (%) MDL (ng)
Calibration curve Recover y rate (%) Regression Eq. R2 1 MTBE 7.274 ± 0.043 0.506 99.5 ± 6.6 0.9 Y=2242X-9632 0.996 93.3 2 benzene 12.212 ± 0.022 0.415 101.6 ± 6.7 0.8 Y=3503X-20714 0.996 90.1 3 n-octane 16.388 ± 0.008 0.317 100.0 ± 6.3 1.1 Y=3090X-19142 0.995 90.6 4 toluene 17.107 ± 0.009 0.408 96.9 ± 3.4 0.5 Y=3703X-22359 0.996 94.6 5 ethylbenzene 21.829 ± 0.008 0.238 102.0 ± 6.3 1.0 Y=2861X-17624 0.996 91.3 6 m,p-xylene 22.111 ± 0.006 0.441 97.7 ± 3.0 1.0 Y=2604X-9443 0.998 91.8 Note:1. Accuracy: (%)[ 2 ]100% C SD C X X n .
agricultural sources and evenly distributed in the atmosphere, which concurred with previous researches. However, non-methane hydrocarbons varied significantly with both sampling location and season, since they were emitted mainly from surrounding anthropogenic sources including stationary, mobile, and fugitive sources. Further investigation on NMHC concentration at various sampling sites showed that the lowest NMHC concentration was always observed at the upwind of the oil-
contaminated remediation site (site A), while the highest NMHC concentration was generally observed at sites B, C, and D, nearby the oil-spilled site. The concentration of NMHC at the downwind site (site E) was generally lower than sites B, C, and D. The results suggested that NMHC must be emitted from source(s) near sites B, C, and D. Consequently, it might be reasonable to assume that NMHC could be emitted from either oil-contaminated remediation site or automobile exhaust gas on the nearby highway.
The concentration contour of non-methane hydrocarbons for various wind direction cases is illustrated in Figure 4. The concentration contours were generally
perpendicular to wind direction and paralleled to the nearby highway. Moreover, a local maximum concentration appeared at locations around site C, the oil-
contaminated site, which indicated that ambient VOCs might be emitted from the spilled gasoline oil. However, the oil-spilled site was neighboring to the nearby highway on which automobile exhaust gas also contributed VOCs to ambient
atmosphere. Consequently, further analysis of VOCs’ characteristics and fingerprints is crucial for identifying major emission source(s) of atmospheric VOCs.
Characteristics of Atmospheric VOCs
In addition to the field measurements of methane and non-methane hydrocarbons, atmospheric VOCs were further sampled and analyzed at the surrounding area of the oil-contaminated remediation site. The analytical spectrum of field sampled
atmosphericVOCs measured by GC/FID is illustrated in Figure 5. Although a few atmospheric VOCs could be qualitatively detected with GC/FID, only six VOCs including benzene, toluene, ethylbenzene, m,p-xylene, n-octane, and MTBE were further quantified in this study since they were the major component of spilled gasoline. Measurement of these VOCs was highly required for identifying the influence of spilled gasoline on atmospheric VOCs in the atmosphere.
Sample number, concentration range and average of the measured VOCs during the investigation period are summarized in Table 2. Table 2 shows that m,p-xylene (in the first season) and n-octane and toluene (in the second season) were the major atmospheric VOCs observed in the ambient air. However, a few high boil-point hydrocarbons were also detected in some gas samples. It suggested that the nearby community was not only affected by the VOCs emitted from the oil-contaminated remediation site but also by other unidentified local sources. In comparison with other seasons, the first season demonstrated very high concentration of m,p-xylene, especially at sites B and C. Relatively high concentration of toluene and n-octane were found in the second and the third seasons. High concentrations of these VOCs were observed when as winds were blown from westward directions (i.e. northwest and southwest winds), which might migrate VOCs to the sampling region. The results concurred with the facts that two VOCs sources, both gasoline-contaminated sol gas and tail exhausts from highway, are located at the westward upwind of the sampling region.
Figure 4. Concentration contour of non-methane hydrocarbons for various wind
Figure 5. Analytical spectrum of atmospheric VOCs measured by GC/FID.
Table 2. Sample number, concentration range and average of VOCs at various seasons.
VOCs Season Sample No. (n) MTBE (ppbv) Benzene (ppbv) n-Octane (ppbv) Toluene (ppbv) Ethylbenzene (ppbv) m,p-Xylene (ppbv) First 5 0.11~0.71 (0.32) 0.18~0.29 (0.22) 0.15~0.30 (0.24) 0.16~0.24 (0.21) 0.13~0.16 (0.14) 0.13~7.97 (2.43) Second 5 0.15~0.36 (0.20) 0.24~0.48 (0.38) 0.19~1.80 (0.67) 1.09~1.57 (1.40) 0.23~0.27 (0.25) 0.35~0.44 (0.38) Third 5 0.10~0.29 (0.20) 0.16~0.35 (0.25) 0.12~0.36 (0.24) 0.17~0.58 (0.38) 0.12~0.19 (0.15) 0.20~0.35 (0.28) Fourth 5 0.10~0.19 (0.15) 0.14~0.32 (0.22) 0.12~0.34 (0.22) 0.15~0.55 (0.35) 0.10~0.18 (0.15) 0.15~0.33 (0.26) Fifth 5 0.03~0.06 (0.05) 0.06~0.15 (0.10) 0.04~0.08 (0.06) 0.05~0.21 (0.10) 0.04~0.08 (0.07) 0.02~0.05 (0.04) Sixth 5 0.04~0.31 (0.12) 0.08~0.41 (0.18) 0.06~0.15 (0.11) 0.08~0.80 (0.30) 0.04~0.21 (0.10) 0.09~0.55 (0.20) ( ) represents the average concentration
1.MTBE 2.benzene 3.n-octane 4.toluene 5.ethylbenzene 6.m,p-xylene 1 2 3 4 5 6
Fingerprints of Atmospheric VOCs
As mentioned earlier, agricultural fields surround the sampling region where nearby a traffic highway. In addition to the oil-contaminated site and traffic highway, there were only very few VOCs emission sources in the agricultural fields. Therefore, it wouldn’t be surprised that the concentrations of atmospheric VOCs in the sampling region were much lower than those in the metropolitan and industrial areas. Both soil gas emitted from the gasoline-contaminated remediation site and tail gas emitted from automobiles in the nearby highway were thought as two major VOCs sources. It can be further proved by the lowest VOCs concentration always found at the upwind site (site A) of sampling region for different seasons with wind directions varied from southwest to northeast. The results concurred quite well with the field measurements of non-methane hydrocarbons (NMHC).
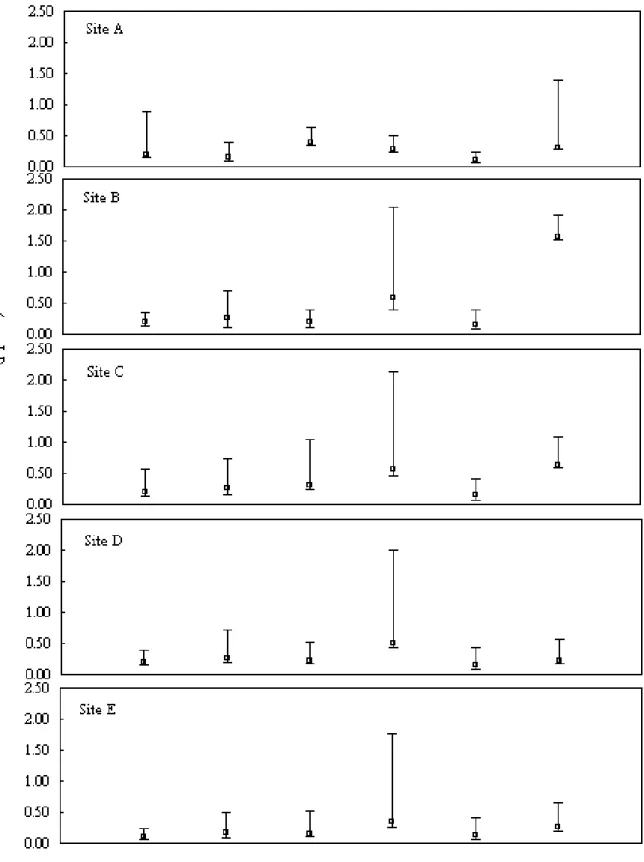
Despite of seasonal variation, the fingerprints of atmospheric VOCs at various sampling sites are illustrated in Figure 6. Similar to NMHC, VOCs were always higher at sampling sites B, C, and D whereas they were close to either oil-spilled site or highway. Although site A showed relatively low concentrations of atmospheric VOCs, the most abundant VOCs were n-octane and toluene. Sites B, C, and D demonstrated relatively high concentrations of m,p-xylene and toluene. Site E usually had the lowest concentration of atmospheric VOCs except for toluene. In comparison with various seasons, the first and the second seasons (Spring and
Summer of 2002) demonstrated relatively high concentrations of atmospheric VOCs. The distribution of atmospheric VOCs at various sampling sites and seasons is
illustrated in Figure 7. Overall speaking, the concentrations of atmospheric VOCs were relatively low except for the first and the second seasons. During the first and the second seasons, a consistent variation of VOCs at various sampling sites was observed. For instance, m,p-xylene was the major VOCs in the first season, while toluene and n-octane were the most abundant VOCs in the second season. The results were attributed to the transportation of VOCs from local and/or regional sources to the sampling region by the prevailing wind.
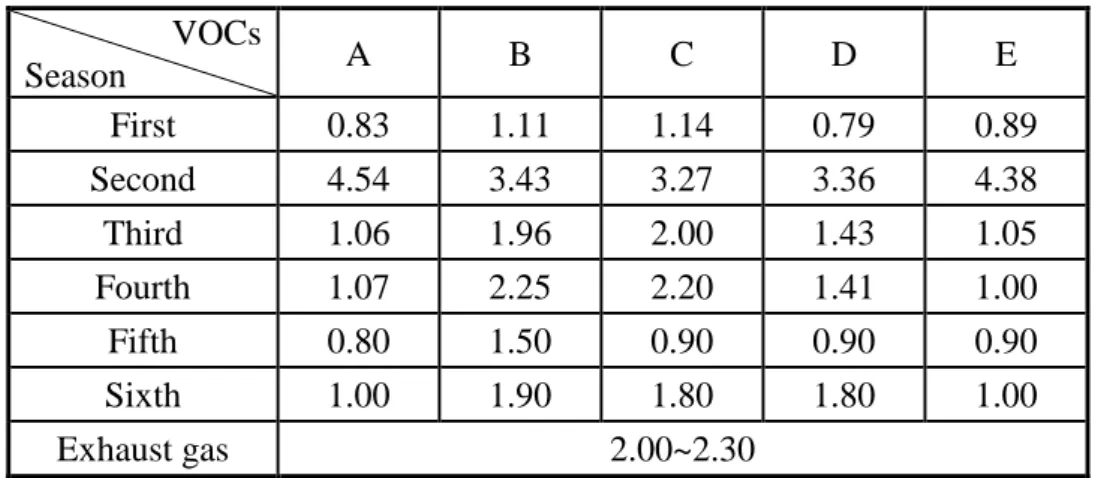
The concentration ratios of toluene and benzene (T/B)at various sampling locations and seasons are summarized in Table 3. Table 3 shows that T/B ratio varied significantly with seasons and locations. The T/B ratios in the first and the fifth seasons were relatively lower, while the T/B ratios in the second season were relatively higher, than other seasons. In addition to these three seasons, the T/B ratios at sites A, B, C, D, and E were in the range of 1.00-1.07, 1.90- 2.25, 1.80-2.20, 1.41-1.80, and 1.00-1.05, respectively. In comparison with the T/B ratio of tail-pipe exhaust gas (2.0-2.3), the characteristics of VOCs sampled at sites B and C were quite similar to the characteristics of VOCs emitted from tail-pipe exhaust gas. The results indicated that atmospheric VOCs sampled at site B (the downwind of highway and the upwind of oil-spilled site) and site C (the oil-spilled site) was mainly attributed to the tail-pipe exhaust gas emitted from automobiles driven on the nearby highway. However, the T/B ratios in the second season ranged from 3.27 to 4.54, which were quite similar to the T/B ratio of 3.8-4.2 for 92-unleaded gasoline. It suggested that, in the second season, the atmospheric VOCs were mainly attributed from the fugitive emission of spilled gasoline.
Figure 7. Distribution of atmospheric VOCs at various locations and seasons.
A. First season B. Second season
C. Third season D. Fourth season
Further investigation on the fingerprints of ambient VOCs was to determine the mass ratio of benzene, toluene, ethylbenzene, and m,p-xylene (BTEX). The mass ratios of BTEX for different seasons at various sampling locations are summarized in Table 4. In order to characterize the component of tail gas, VOCs were sampled and analyzed from tail pipes as well as on highway in this study. It was revealed that the BTEX ratio of tail gas was 1.6:3.2:1.0:2.5. Similar to T/B ratios, the BTEX ratios varied very much with seasons and locations. In spite of the first, the second, and the fifth seasons, the BTEX ratios at sites B, C, and D were similar to tail gas. Concurred with the T/B ratios, results from BTEX ratios suggested that ambient VOCs were mainly attributed to the exhaust of tail gas from the nearby highway. Moreover, the BTEX ratios at site A (upwind site) and site E (downwind site) were also quite similar with each other in three seasons. It suggested that background concentrations of VOCs in ambient atmosphere did not vary much although some VOCs might be emitted from tail gas and spilled oil.
Table 3. Concentration ratio of toluene and benzene (T/B) at various sampling
locations and seasons.
VOCs Season A B C D E First 0.83 1.11 1.14 0.79 0.89 Second 4.54 3.43 3.27 3.36 4.38 Third 1.06 1.96 2.00 1.43 1.05 Fourth 1.07 2.25 2.20 1.41 1.00 Fifth 0.80 1.50 0.90 0.90 0.90 Sixth 1.00 1.90 1.80 1.80 1.00 Exhaust gas 2.00~2.30
Table 4. Concentration ratio of benzene, toluene, ethylbenzene, and m,p-xylene
(BTEX) at various sampling locations and seasons.
VOCs Season A B C D E First 1.8:2.1:1.0:8.2 1.3:1.4:1.0:56.9 1.4:1.6:1.0:16.9 1.8:1.4:1.0:0.8 1.3:1.1:1.0:3.1 Second 1.0:4.5:1.0:1.5 1.8:6.3:1.0:1.5 1.9:6.3:1.0:1.8 1.7:5.6:1.0:1.3 1.2:5.2: 1.0:1.5 Third 1.3:1.4:1.0:1.7 1.6:3.1:1.0:2.0 1.7:3.4:1.0:2.0 1.8:2.6:1.0:1.8 1.4:1.4: 1.0:1.9 Fourth 1.4:1.5:1.0:1.5 1.3:3.0:1.0:1.6 1.4:3.1:1.0:1.7 1.8:2.5:1.0:1.8 1.3:1.3: 1.0:1.9 Fifth 1.5:1.3:1.0:0.5 1.9:2.6:1.0:0.6 1.3:1.1:1.0:0.6 1.3:1.2:1.0:0.7 1.3:1.1: 1.0:0.7 Sixth 2.0:2.0:1.0:2.3 2.0:3.8:1.0:2.6 1.8:3.0:1.0:1.5 1.5:2.8:1.0:1.6 1.7:1.7 :1.0:1.7 Exhaust gas 1.6:3.2:1.0:2.5
Health Risk Assessment
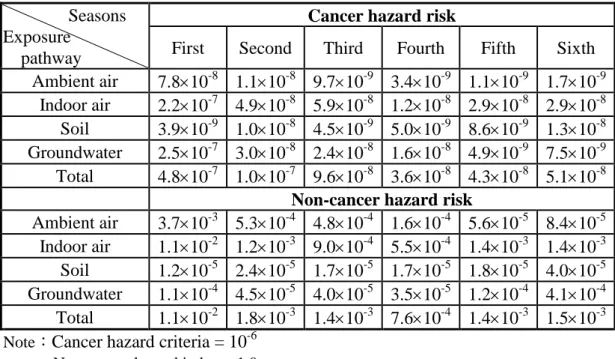
The health risks exerted by atmospheric VOCs for residences, who lived in the surrounding area of the oil-contaminated remediation site, were further assessed in this study. Based on the field measurements of benzene, toluene, ethylene, and m,p-xylene (BTEX) during the sampling seasons, cancer hazard risks ranged from 1.1x10⁻⁹ to 7.8x10⁻⁸, which were much lower than the criteria of once per million (1.0x10⁻⁶). Besides, the assessed non-cancer hazard risks ranged from 8.4x10⁻⁵ to 3.7x10⁻³, which were much less than the hazard index of unity (see Table 5). Compared with other exposure pathways through indoor air, soil, and groundwater, health risks for inhaling outdoor air were in the similar order of magnitude for other exposure pathways. The results indicated that the overall health risks of cancer and non-cancer hazards did not violate national regulation. This study concluded that the remediation of the oil-contaminated site has been successfully accomplished, which would not cause further health problems to neighboring residences.
Table 5. The health hazard index obtained from health risk assessment.(11)
Seasons Exposure
pathway
Cancer hazard risk
First Second Third Fourth Fifth Sixth Ambient air 7.810-8 1.110-8 9.710-9 3.410-9 1.110-9 1.710-9
Indoor air 2.210-7 4.910-8 5.910-8 1.210-8 2.910-8 2.910-8 Soil 3.910-9 1.010-8 4.510-9 5.010-9 8.610-9 1.310-8 Groundwater 2.510-7 3.010-8 2.410-8 1.610-8 4.910-9 7.510-9 Total 4.810-7 1.010-7 9.610-8 3.610-8 4.310-8 5.110-8
Non-cancer hazard risk
Ambient air 3.710-3 5.310-4 4.810-4 1.610-4 5.610-5 8.410-5 Indoor air 1.110-2 1.210-3 9.010-4 5.510-4 1.410-3 1.410-3 Soil 1.210-5 2.410-5 1.710-5 1.710-5 1.810-5 4.010-5 Groundwater 1.110-4 4.510-5 4.010-5 3.510-5 1.210-4 4.110-4 Total 1.110-2 1.810-3 1.410-3 7.610-4 1.410-3 1.510-3 Note:Cancer hazard criteria = 10-6
Non-cancer hazard index = 1.0
SUMMARY AND CONCLUSIONS
This study investigated the characteristics of ambient VOCs in the atmosphere at the surrounding area of an oil-contaminated remediation site by conducting a field measurement of protocol. Atmospheric VOCs were collected by carbontrap 300 packed multi-bed sampling tubes at a sampling network including five sampling sites, while methane and non-methane hydrocarbons were continuously detected in-situ. Results obtained from field measurements indicated that the concentration of NMHC at the upwind site was always lower than the downwind site. Major VOCs observed in the sampling region were n-octane, toluene, and m,p-xylene. However, the observation of some high boil-point organic compounds in several cases suggested
that the atmospheric VOCs at nearby community were not only emitted from the oil-contaminated remediation site but also from other unidentified local sources. This study revealed that the T/B ratios of atmospheric VOCs were similar to the T/B ratio of tail-pipe exhaust gas. It suggested that atmospheric VOCs were mainly attributed to tail-pipe exhaust gas rather than spilled gasoline. In addition to T/B ratios, similar trends were also observed for the BTEX ratios. Based on the field measurements of benzene, toluene, ethylene, and m,p-xylene (BTEX) during the sampling seasons, cancer hazard risks ranged from 1.1x10⁻⁹ to 7.8x10⁻⁸, which were much lower than the criteria of once per million (1.0x10⁻⁶). Besides, the assessed non-cancer hazard risks ranged from 8.4x10⁻⁵ to 3.7x10⁻³, which were much less than the hazard index of unity. This study revealed that both cancer and non-cancer hazard risks did not violate the national regulation. Moreover, based on the health risk assessment, this study concluded that the oil-contaminated site has been successfully remedied and would not cause further health problems on the neighboring residences.
ACKNOWLEDGEMENTS
This study was performed under the auspicious of Environmental Protection Bureau (EPB) of Chia-yi County, Taiwan. The authors would like to express their great appreciation to the EPB of Chia-yi County for its financial support. Special thanks also went to Central Technology Co., Ltd. for its constant assistance in monitoring of ambient hydrocarbons.
REFERENCES
1. US EPA. (1996). Soil Screening Guidance: User’s Guide. EPA/540/R-96/ 018. 2. Kao C.M. and Wang C.C. (2000). Control of BTEX Migration by Intrinsic
Bioremediation at a Gasoline Spill Site. Wat. Res., 34(13), 3413-3423.
3. US EPA. (1999). Achieving Clean Air and Clean Water: The Report of the Blue Ribbon Panel on Oxygenates in Gasoline. EPA420-R-99-021.
4. US EPA. (1997). Drinking Water Advisory: Consumer Acceptability Advice and Health Effects Analysis on Methyl tertiary-Butyl Ether (MTBE).
EPA-822-F-97-009.
5. US EPA. (1998). MTBE Fact Sheet #2, Remediation of MTBE Contaminated Soil and Groundwater. EPA 510-F-97-015.
6. Atkinson R. Atmos. Environ., 1990, 24A, 1-41.
7. Tso, Tai-Ly. Research Report of CPC in Taiwan, 87-CPC-M-007-004, National Tsing Hua University Chemistry (1998) (in Chinese).
8. Tsai, J.H.; Wu, Yee Y.L.; Chu, H. Research Report of Industrial Development Bureau, MOEA in Taiwan, (1994) (in Chinese).
9. Kao, A.S. J. A&WMA, 1994, 44, 683-696.
10. Smith, Deborah L.; Evans, G.F; Lumpkin, T.A. J. A&WMA, 1992, 42(10), 1319-1323.
11. Chia-yi EPB. (2003). Evaluation of Oil-Contaminated Remediation Site at 274.3K of Highway No. 1. Chia-yi EPB Report. (in Chinese)
Key Words
volatile organic compounds (VOCs) sampling and analysis
oil-contaminated remediation site toluene to benzene ratio (T/B) health risk assessment