J. Chow á J. S. Lee á R. Sun á C. S. Liu á N. Lundberg
Characteristics of the bottom simulating re¯ectors near mud diapirs:
offshore southwestern Taiwan
Received: 24 March 1999 / Revision accepted: 10 December 1999
Abstract Single-channel seismic recording was carried out o the southwestern coast of Taiwan. Six charac-teristic seismic facies associated with bottom simulating re¯ectors (BSRs) and mud diapirs are identi®ed. The existence of re¯ections which mimic the sea¯oor, the reverse polarity, weak amplitude blocks, and strong diraction patterns around the mud diapirs all suggest that gas hydrates exist in the deep-water regions. The bases of the hydrate stability zones upturn in the vicinity of mud volcanoes. The high heat ¯ows of mud volcanoes provide heat sources which destabilize the gas hydrates and upturn the BSRs.
Introduction
Deep-sea gas hydrates are ice-like solids (Singh et al. 1993) which are formed from water and naturally occurring gases, particularly methane species (Hyndman et al. 1992; Dickens et al. 1997). Gas hydrates usually occur in open-ocean waters at depths greater than 500 m in feather-edged, surface-parallel horizons up to 1100 m thick (Booth et al. 1995).
Hydrates in deep-sea sediments have been sampled by remotely operated vehicles in the Ocean Drilling Pro-gram (Brewer et al. 1997; Paull et al. 1998). However,
the presence of gas hydrates in sediments has usually been inferred from bottom simulating re¯ectors (BSRs) in seismic sections (e.g., Neben et al. 1998). The high amplitude associated with BSRs indicates seismic char-acteristics of bright spots in petroleum exploration (Sheri 1975; Hutchison et al. 1981).
The analysis of seismic re¯ection pro®les acquired during cruises 320 and 329 of the R/V Ocean Researcher I (Fig. 1) indicates the existence not only of gas hydrates and BSRs, but also of submarine mud volcanoes o-shore from southwestern Taiwan. This paper describes in detail (1) the general seismic facies in the vicinity of BSRs associated with mud diapirs; (2) the characteristics and existence of BSRs; (3) the relationship between the BSR burial depth and water depth; (4) the upturning of BSRs in the vicinity of mud diapirs; and (5) the existence of pockmarks.
Geological setting
The island of Taiwan was formed by the collision of the Luzon arc with the Chinese continental margin (Ho 1986; Teng 1990). The geological framework of the southwestern Taiwan region, including oshore areas, evolved during the Pliocene±Quaternary (Covey 1984). The arc-continent collision has resulted in the formation of a foreland basin ®lled with orogenic sediments up to 6000 m thick in southwestern Taiwan (Covey 1984).
The area oshore from southwestern Taiwan consists mainly of a narrow shelf and a deep broad slope (Yu and Wen 1992). Submarine mud diapiric intrusions and mud volcanoes are recognized as the most prominent under-sea features in the deep-water region (>700 m; Sun and Liu 1993; Chow et al. 1996).
General seismic facies around BSRs
A general interpretation of the seismic pro®les pro-vided essential information on the sedimentary
envi-Geo-Marine Letters (2000) 20: 3±9 ÓSpringer-Verlag 2000
J. Chow (&) á J. S. Lee Institute of Applied Geophysics, National Taiwan Ocean University, Keelung 202, Taiwan, Republic of China e-mail: [email protected]
R. Sun
Department of Earth Sciences, National Chengkung University, Tainan 701, Republic of China C. S. Liu
Institute of Oceanography, National Taiwan University, Taipei 106, Taiwan, Republic of China
N. Lundberg
Department of Geology, Florida State University, Tallahassee FL 32306, USA
ronments, and thus serves as the basis for further discussion of the seismic characteristics of BSRs. These seismic facies units are common features in the vicinity of BSRs with mud diapirs worldwide. The following seismic facies can provide a geological background for geochemical studies dealing with the relationships between the gas hydrates and mud diapirs.
Seismic facies S1 appears with parallel, continuous re¯ections of high amplitude (Figs. 2, 3). The facies frequently occurs in the uppermost portion of the sedi-mentary column in the study area. The facies of some areas are truncated by gullies or disturbed by submarine mud volcanoes. A lack of disturbance in these
well-strati®ed sedimentary deposits indicates calm hemipela-gic sedimentation (Basov et al. 1996).
Seismic facies S2 (Figs. 2, 3) is characterized by nearly transparent and white shaded re¯ection patterns. The distribution of S2 is restricted to local regions of the deep-water area studied. The geological signi®cance of this facies will be discussed below.
Seismic facies S3 (Fig. 3) exhibits features associated with the development of mud diapirs, i.e. it is a pro-gradational facies of debris which derived from the high land of mud diapirs, with inclined re¯ectors deformed by diapir uplift.
Seismic facies S4 (Figs. 3, 4) usually underlies S2 and S3. The appearance of S4 is a subparallel re¯ection
Fig. 1 Map showing the loca-tion of seismic survey lines in the area oshore from south-western Taiwan (record of ship's track for R/V Ocean Researcher I during cruises 320 and 329). Shaded areas Locations of BSRs
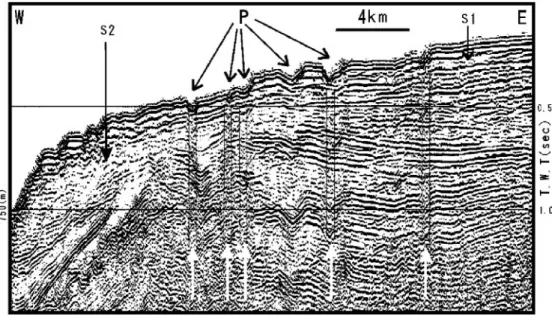
Fig. 2 V-shaped pockmarks (P) and acoustic disturbances of narrow vertical column below pockmarks. S1 and S2 are seismic facies units. The loca-tion of this seismic survey line is shown in Fig. 1
pattern of high amplitude. The seismic facies S4 is almost parallel to the sea¯oor at a sub-bottom depth of 200±500 ms two-way time (TWT), forming bottom simulating re¯ectors which frequently intersect the sedimentary layer re¯ectors. This facies will also be described in detail below.
Seismic facies S5 (Fig. 3) is recognized as a mud-diapir facies of gentle anticlinal outline and internal chaotic re¯ectors. This facies usually punctured the surrounding sedimentary beds when the mud diapirs extruded. The axial parts of the diapir facies are
frequently linked together with the nearby mud diapirs or the submarine mud volcanoes.
The whole external appearance of seismic facies S6 (Fig. 5) is a mud-volcano facies of triangular shape with two sides forming a steep slope. The mud-diapir facies S5 and the mud-volcano facies S6 are about 5 km wide with heights of about 0.5±1.0 s (TWT). The dierence is that the mud-volcano facies, surrounded by BSRs, often rises hundreds of meters from the sea bottom but the mud-diapir facies is located under the sea¯oor.
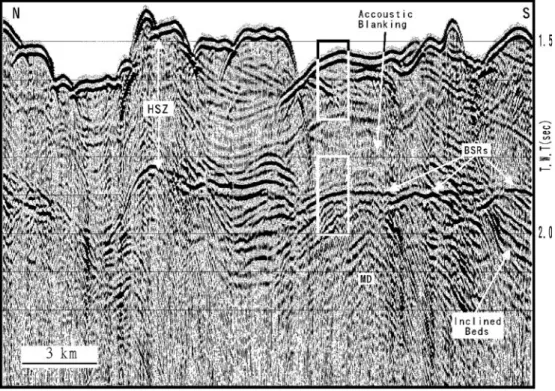
Fig. 3 Bottom simulating re¯ectors (BSRs) generally mimic the sea¯oor topography in the area oshore from southwestern Taiwan. Weak re¯ection blocks are normally found above BSRs. S1, S2, S3, S4, and S5 are seismic facies units. The location of this seismic survey line is shown in Fig. 1. HSZ Hydrate stability zone; MD mud diapir
Fig. 4 Reversed enlarged detail of the boxed area in Fig. 3. BSRs Bottom simulating re-¯ectors; HSZ hydrate stability zone; MD mud diapir
Existence and characteristics of gas hydrates
Single-channel seismic re¯ection pro®les (500 in3airgun) from the deep-water area studied show that some seismic re¯ections generally mimic the sea¯oor topography. In Fig. 4, one of these events at about 1.9 s (TWT) parallels the seabed, and is superimposed across the inclined sedimentary beds above mud diapirs. The sea-bottom depth of the seismic section is about 1.5 s (TWT), so a 1.9-s re¯ection cannot be a multiple re¯ection of the seabed since this would occur at about 3.0 s (TWT). These BSRs are the physical zones whose depths are determined by ambient pressures and temperatures (Max and Lowrie 1996; Willoughby and Edwards 1997). They are neither lithological nor stratigraphical inter-faces.
Furthermore, Fig. 6 (an enlarged detail of Fig. 4) clearly shows the reverse polarity of this re¯ection, i.e. from the peak-trough-peak of the sea-bottom re¯ection waveform to the trough-peak-trough of the BSR re¯ection. The phase shift of 180° is caused by a decrease in the interval velocity below the BSR which also forms a strong acoustic impedance. The impedance contrast is caused by the presence of methane in the pore space of marine sediments (Ecker et al. 1998). A level of free gas of only a few percent in the pore space can still cause the P-wave velocity to decrease markedly (Pecher et al. 1996). The amplitudes below the BSR decay rapidly. The decaying eect of high attenuation is probably due to the presence of dispersed free gas (Lee et al. 1994). BSRs of reverse polarity can also be observed in many parts of the seismic pro®les made in the deep-water region studied (Fig. 1). The shaded areas in Fig. 1 show
the distribution of the BSRs. The reasons why BSRs do not exist in some areas will be discussed below.
The seismic pro®les also show that the stratigraphic re¯ections above some BSRs are much weaker than those beneath them (S2 in Figs. 3 and 4). The facies S2 has acoustic blanking characteristics. This acoustic blanking (Holbrook et al. 1996) indicates the absence of any signal because of increased transmission and oblit-eration of sediment impedance structures owing to the general replacement of pore water by hydrate (Schmuck and Paull 1993). Therefore, the zone with the acoustic blanking characteristics is also referred to as the hydrate stability zone (HSZ; Sad et al. 1998) which is de®ned as the sedimentary package which contains the gas hydrates (Fig. 3). Some of the blanking is not obvious. Because the acoustic blanking is related to the hydrate cementation in the sediments, the degree of blanking is proportional to the amount of hydrate in the pore space (Lee et al. 1994). The amount of hydrate varies in the deep-water region studied.
BSRs are not always easy to identify in the deep-water area oshore from Taiwan's southwest coast. For ex-ample, sometimes the amplitude of the BSRs are low or the signals may be disturbed by other re¯ections. How-ever, even in the absence of BSRs, the acoustic blanking blocks are usually found in the seismic sections of the deep-water region. This suggests that gas hydrates are distributed widely in the deep-water regions of the study area. The attenuation and disappearance of the BSRs does not necessarily mean that the gas hydrates have also thinned and disappeared, but rather that not enough gas (if any at all) is con®ned under the gas hydrates to de-crease P-wave velocity markedly and give rise to the BSRs (Schmuck and Paull 1993; Lee et al. 1994). In the
Fig. 5 Strong diraction phe-nomenon above a mud diapir (MD), possibly due to gas-®lled sediments of dierent thicknesses under gas hydrates (enlarged detail of boxed area in Fig. 5). W.R. Weak re¯ection; S.R. strong re¯ection; D diraction
deep-water regions o southwestern Taiwan, the many submarine mud volcanoes which have extruded from the deep sedimentary beds through to the sea¯oor provide numerous conduits through which gas might ¯ow out to the sea¯oor (Prior et al. 1989; Roberts and Neurauter 1990), and these would result in the disappearance of BSRs in some areas. Thus, even in the absence of obvious BSRs, we nonetheless take the existence of weak re¯ec-tion blocks in the seismic pro®les to indicate the possible existence of gas hydrates in the sediments.
Numerous diractions are associated with the sea-¯oor shown in Fig. 4. Diractions are also observed in the block between the BSRs and the seabed. The dif-fractions associated with the sea¯oor are caused by three-dimensional sea¯oor features. The scatterings or sideswipes from the three-dimensional sea¯oor features interact constructively or destructively. Some of the diractions in the hydrate stability zone (Fig. 4) are possibly due to diraction by many large nodules of gas hydrates.
A few seismic sections show another strong diraction phenomenon below the acoustic blanking zone (Fig. 7). This may be due to gas-®lled sediments of highly variable thicknesses under gas-hydrate sediments. The highly variable sedimentary formation could generate pointed pinch-out edges. After the pinch-out edges are ®lled with gas, the low-velocity point edges could act as point sources to re¯ect the incoming seismic energy. The re-¯ections at the point sources would then create strong outward diractions. Therefore, although there are no identi®able BSRs in Fig. 7, the strong diraction pattern may possibly indicate the presence of gas hydrates.
BSR burial depth and water depth
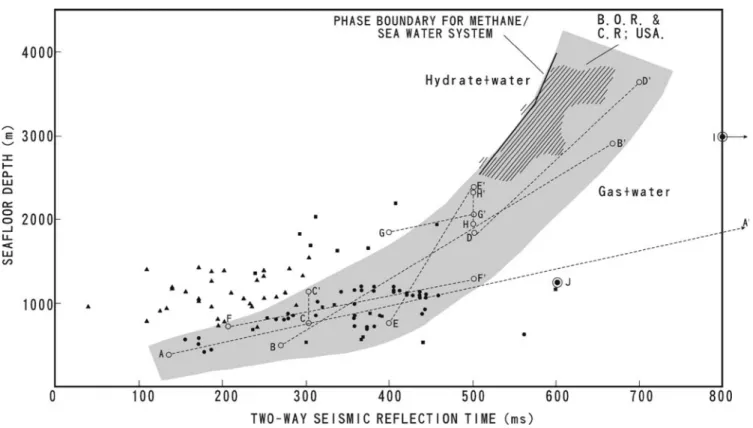
The bases of hydrate stability zones usually mimic the shape of the sea¯oor in the study area. However, as shown in pro®le 320-34 (Fig. 5), the BSRs change in depth around the mud volcanoes. In Fig. 8 we have plotted the subbottom re¯ection time of BSRs versus the water depth (the values were chosen every ten shot points along the seismic sections, or about every 400 m). For convenience in mapping the distribution patterns, we have subdivided the BSRs into two classes based on whether they have been ¯ipped by the mud diapirs or not. Thus, class A BSRs have been ¯ipped by mud diapirs (Fig. 5), those of class B have not (Fig. 3). Although there is considerable scatter in the subbottom re¯ection time of the BSRs (Fig. 8), it is clear that the BSR depth for class B increases with increasing sea¯oor depth. This is attributed to the following two factors. Firstly, the bottom-water temperature decreases with increasing sea¯oor depth and, therefore, gas hydrates are stable deeper in the sediments along a given thermal gradient. Secondly, increased hydrostatic pressure gives rise to stability in deeper gas hydrates (Kvenvolden 1993).
For a more complete picture of the worldwide dis-tribution of BSRs in a diagram of sea¯oor depth versus BSR burial depth, in Fig. 8 we have also plotted data for the Gulf of Mexico, Alaska, California, Nicaragua, Costa Rica, Mexico, Panama, the Indian Ocean, the Blake Outer Ridge area, the southeastern USA and India (data extracted from Tucholke et al. 1977;
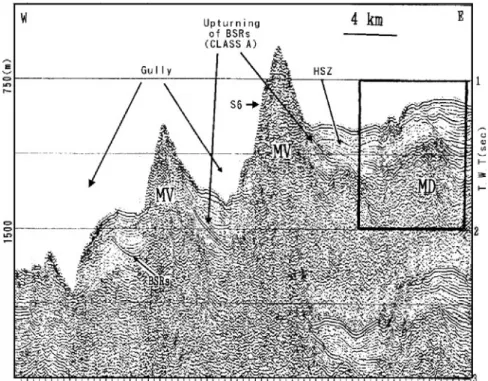
Fig. 7 The submarine mud volcanoes (MV) in the deep-water region. It is worth noting that the bottom simulating re¯ectors (BSRs) always upturn in the vicinity of submarine mud volcanoes. S6 is a seismic facies unit. The location of this seismic survey line is shown in Fig. 1. HSZ Hydrate stability zone; MD mud diapir
Fig. 6 Enlarged detail of the two boxed areas in Fig. 4, showing reverse polarity of the bottom simulating re¯ectors (BSRs), i.e. from the peak-trough-peak of the sea-bottom re¯ection waveform to the trough-peak-trough of the BSR re¯ection. S.B. Sea bottom; P peak; T trough
Kvenvolden and Barnard 1983; Kvenvolden 1993; Veerayya et al. 1998). This plot indicates that there is an anity between the class B BSRs in the present study area and those in the other areas mentioned above. This anity is illustrated in the form of a shaded fan in Fig. 8. The scatter of data in this shaded fan may re¯ect data resolution as well as variability of gas types, ther-mal gradients and/or other geological factors.
Upturning of BSRs
As shown in Fig. 5, the class A BSRs vary in depth dramatically, and their trajectories turn upwards next to mud volcanoes. The hydrostatic pressure of areas of similar depth cannot change suciently to result in the signi®cant upturning of the BSR. Rather, temperature seems to be the principal controlling factor. Submarine mud volcanoes are common in the area studied, and several submarine volcanoes were crossed along the seismic pro®les (Fig. 5). Excluding the tectonically active zone, the average heat ¯ow for the Taiwan southwestern oshore area is about 62 MW/m2 (Shyu et al. 1998). However, anomalously high heat ¯ows of ca. 110±
170 MW/m2were measured over the mud volcanoes, the highest value being nearly three times the mean heat-¯ow value of this oshore area. The high heat-heat-¯ow values over the mud volcanoes indicate recent mud ex-trusion, and continuing seepage of hot mud and water. The high mud volcanic activity can lead to local heat anomalies, providing heat sources which change the thermal gradient, thereby destabilizing the gas hydrates and upturning the BSRs around the mud volcanoes.
Pockmarks
On the outer shelf and upper slope, mostly at water depths of 250±510 ms TWT between 180 and 380 m, seismic pro®les showed V-shaped depressions resem-bling pockmarks in some places (Fig. 2; MacDonald et al. 1990). These depressions may have been formed as a result of the removal of sea¯oor sediments by escaping gas. Some pockmarks, located at water depths greater than 260 m, are underlain by acoustic blankings (Fig. 2). The acoustic blanking zones below the pock-marks are probably related to the source of the gas. One can observe acoustic disturbances in a narrow vertical column below almost every pockmark. These distur-bances may indicate the paths of the upward migration of gas and associated pore ¯uids.
Summary
Six seismic facies units are recognized in the area stud-ied. These seismic facies are also the general
character-Fig. 8 BSR sub-bottom depth (two-way time) versus sea¯oor depth for class A and class B BSRs in the present study (triangles class A, i.e. BSRs ¯ipped by mud diapirs; ®lled circles class B, i.e. BSRs not ¯ipped by mud diapirs), and values for India (squares data extracted from Veerayya et al. 1998) as well as for the Blake Outer Ridge (B.O.R.) and the continental rise (C.R.) o the southeastern coast of the USA (striped area data extracted from Tucholke et al. 1977). Open circles and dashed lines Ranges in BSRs for other regions (cf. text for more details; data extracted from Kvenvolden and Barnard 1983; Kvenvolden 1993; Veerayya et al. 1998)
istics in the areas of BSRs associated with mud diapirs worldwide.
The ubiquitous BSRs and weak re¯ection blocks provide strong evidence that gas hydrates are distributed widely in the deep-water region o southwestern Tai-wan. The evidence is that (1) re¯ections are parallel to the seabed and cut across inclined sedimentary bed re¯ections; (2) BSRs have reverse polarity; (3) weak re¯ection blocks are seen above the strong BSR re¯ec-tors; (4) strong diraction patterns are seen under weak re¯ection blocks; and (5) even in the absence of BSRs, the weak re¯ection blocks are found in many places of the deep-water region.
The depth of the HSZ base increases with increasing sea¯oor depth if the BSRs are not ¯ipped around the mud volcanoes. The high heat ¯ow of mud volcanoes can result in local temperature anomalies which destabilize the gas hydrates and then upturn the base of the HSZ towards the mud volcanoes. Some pockmarks with nar-row vertical migration of gas and ¯uids are also revealed in the seismic facies study of BSRs around mud diapirs.
Acknowledgements The authors are grateful for ®nancial support from the National Science Council in Taiwan.
References
Basov EI, van Weering TCE, Gaedike C, Baranov BV, Lelikov EP, Obzhirov AI, Belykh IN (1996) Seismic facies and speci®c character of the bottom simulating re¯ector on the western margin of Paramushir Island, Sea of Okhotsk. Geo-Mar Lett 16: 297±304
Booth JS, Fischer KM, Rowe MM (1995) Methane hydrate in marine sediments: de®ning the characteristics of an unclassic reservoir. Abstr Annu Meet Am Assoc Petrol Geol, Soc Econ Paleontol Mineral 4: 11
Brewer PG, Orr FM, Friederich G, Kvenvolden DL, Orange DL, McFarlane J, Kirkwood W (1997) Deep-ocean ®eld test of methane hydrate formation from a remotely operated vehicle. Geology 25: 407±410
Chow J, Lai TD, Liu CS, Yu HS (1996) Strike-slip deformation o southwestern Taiwan. Terr Atmos Ocean Sci 7: 523±533 Covey M (1984) Lithofacies analysis and basin reconstruction,
Plio-Pleistocene western Taiwan foredeep. Petrol Geol Taiwan 20: 53±83
Dickens GR, Paull CK, Wallace P, O.L.S. Party (1997) Direct measurement of in situ methane quantities in a large gas res-ervoir. Nature 385: 426±428
Ecker C, Dvorkin J, Nur A (1998) Sediments with gas hydrates: internal structure from seismic AVO. Geophysics 63: 1659±1669 Ho CS (1986) Tectonic evolution of Taiwan. Explanatory text of the tectonic map of Taiwan. The Ministry of Economic Aairs, Taiwan, Republic of China
Holbrook WS, Hoskins WT, Wood RA, Stephen D, Lizarralde D, Leg 164 Science Party (1996) Methane hydrate and free gas on the Blake Ridge from vertical seismic pro®ling. Science 273: 1840±1843
Hutchison I, Louden KE, White RS, Von Herzen RP (1981) Heat ¯ow and age of the Gulf of Oman. Earth Planet Sci Lett 56: 252±262
Hyndman RD, Foucher JP, Yamano M, Fisher A, Scienti®c Team Ocean Drilling Program Leg 131 (1992) Deep sea-bottom-sim-ulating-re¯ectors: calibration of the base of the hydrate stability ®eld as used for heat ¯ow estimates. Earth Planet Sci Lett 109: 289±301
Kvenvolden K (1993) Gas hydrates ± geological perspective and global change. Rev Geophys 31: 173±187
Kvenvolden KA, Barnard L (1983) Hydrates of natural gas in continental margins. In: Watkins JS, Drake CL (eds) Studies in continental margin geology. Am Assoc Petrol Geol Mem 34: 631±640
Lee MW, Hutchinson DR, Agena WF, Dillon WP, Miller JJ, Swift BA (1994) Seismic character of gas hydrates of the southeastern US continental margin. Mar Geophys Res 16: 163±184
MacDonald IR, Reilly I, Guinasso JF, Brooks JM, Carney RS, Bryant WA, Bright TJ (1990) Chemosynthetic mussels at a brine-®lled pockmark in the northern Gulf of Mexico. Science 248: 1096±1099
Max MD, Lowrie A (1996) Oceanic methane hydrate: a ``frontier'' gas resource. J Petrol Geol 19: 41±56
Neben S, Hinz K, Beiersdorf H (1998) Re¯ection characteristics, depth and geographical distribution of bottom simulating re-¯ectors within the accretionary wedge of Sulawesi. In: Henriet JP, Mienert J (eds) Gas hydrates: relevance to world margin stability and climate change. Geol Soc London Spec Publ 137: 255±265
Paull CK, Borowski WS, Rodrigues NM, ODP Leg 164 Shipboard Scienti®c Party (1998) Marine gas hydrate inventory: prelimi-nary results of ODP Leg 164 and implications for gas venting and slumping associated with the Blake Ridge gas hydrate ®eld. In: Henrient JP, Mienert J (eds) Gas hydrates: relevance to world margin stability and climate change. Geol Soc London Spec Publ 137: 153±160
Pecher IA, Minshull TA, Singh SC, von Huene R (1996) Velocity structure of a bottom simulating re¯ector oshore Peru: results from full waveform inversion. Earth Planet Sci Lett 139: 459±469
Prior DB, Doyle EH, Kaluza MJ (1989) Evidence for sediment eruption on the deep sea ¯oor, Gulf of Mexico. Science 243: 517±519
Roberts HH, Neurauter TW (1990) Direct observations of a large active mud vent on the Louisiana continental slope. Am Assoc Petrol Geol Bull 74: 1508
Sad AR, Silveira DP, Machado MA, Silva SR, Maciel RR (1998) Marine gas hydrates along the Brazilian coast. Am Assoc Petrol Geol Bull 82: 1961
Schmuck EA, Paull CK (1993) Evidence for gas accumulation associated with diapirism and gas hydrates at the head of the Cape Fear Slide. Geo-Mar Lett 13: 145±152
Sheri RE (1975) Factors aecting seismic amplitude. Geophysics 45: 968±992
Shyu CT, Hsu SK, Liu CS (1998) Heat ¯ows o southwest Taiwan: measurements over mud diapirs and estimations from bottom simulating re¯ectors. TAO 9: 795±812
Singh SC, Minshull TA, Spence GD (1993) Velocity structure of a gas hydrate layer. Science 260: 204±207
Sun SC, Liu CS (1993) Mud diapirs and submarine channel deposits in oshore Kaohsiung-Hengchun, southwest Taiwan. Petrol Geol Taiwan 28: 1±14
Teng LS (1990) Geotectonic evolution of late Cenozoic arc-conti-nent collision in Taiwan. Tectonophysics 183: 57±76
Tucholke B, Bryan G, Ewing L (1977) Gas hydrate horizons de-tected in seismic-pro®ler data from the western North Atlantic. Am Assoc Petrol Geol Bull 61: 698±707
Veerayya M, Karisiddaiah SM, Vora KH, Wagle BG, Almeida F (1998) Detection of gas-charged sediments and gas hydrate horizons along the western continental margin of India. In: Henriet JP, Mienert J (eds) Gas hydrates: relevance to world margin stability and climate change. Geol Soc Lond Spec Publ 137: 239±253
Willoughby EC, Edwards RN (1997) On the resource evaluation of marine gas-hydrate deposits using sea¯oor compliance meth-ods. Geophys J Int 131: 751±766
Yu HS, Wen YH (1992) Physiographic characteristics of the con-tinental margin o southwestern Taiwan. J Geol Soc China 36: 337±351