www.nature.com/jhh
ORIGINAL ARTICLE
Prevalence, awareness, treatment and
control of hypertension in Taiwan: results
of Nutrition and Health Survey in Taiwan
(NAHSIT) 1993–1996
W-H Pan
1,2, H-Y Chang
3, W-T Yeh
1, S-Y Hsiao
4, and Y-T Hung
51Institute of Biomedical Sciences, Academia Sinica, Taipei, Taiwan;2Graduate Institute of Epidemiology, College of Public Health, National Taiwan University, Taipei, Taiwan;3Division of Health Policy
Research, National Health Research Institute, Taipei, Taiwan;4Division of Endocrinology and Metabolism, Veterans General Hospital-Taipei, Taiwan;5Department of Politics, National Taiwan University, Taipei, Taiwan
The objective of this paper is to describe hypertension status in Taiwan using data from the Nutrition and Health Survey in Taiwan (NAHSIT) 1993–1996, which adopted a clustered stratified multistage sampling scheme. A total of 4838 males and 4876 females aged 4 years and above were interviewed and examined corre-sponding to a response rate of 74%. Almost all of them (97.5%) had blood pressures measured. The results show that the mean blood pressure of adult males was higher than that of adult females below 45 years of age. After that, the pattern was reversed. When defined by JNC IV criteria (SBP/DBP⭓160/95 mm Hg or taking anti-hypertensive drugs), the prevalence was 13% in adult males (⭓19 years) and 12% in adult females. When defined by JNC VI criteria (SBP/DBP⭓140/90 mm Hg or
Keywords: hypertension; prevalence; awareness; control; percentiles; Taiwan
Introduction
Stroke, heart diseases, diabetes mellitus and hyper-tension were the third, the fourth, the fifth, and the ninth major underlying causes of death in Taiwan, respectively.1Hypertension was strongly associated
with all of these chronic diseases.2In the past 10–
20 years, the economy has grown rapidly in Taiwan. The changing dietary patterns and lifestyles accompanying economic growth may have exerted great impact on the prevalence and incidence of atherosclerotic diseases. The purpose of this paper was to provide current statistics on the prevalence, awareness and control of hypertension in Taiwan as a whole and in various age-sex groups and regions.
Correspondence: W-H Pan, Institute of Biomedical Sciences, Academia Sinica, Taipei 115–29, Taiwan
E-mail: pan얀ibms.sinica.edu.tw
Received 27 March 2001; revised and accepted 14 June 2001
taking antihypertensive drugs), the prevalence was 26% in adult males and 19% in adult females. The prevalence in the mountainous area, was the highest among the seven survey strata. Under the JNC IV definition, 43% males and 53% females with hypertension knew their disease status, 31% of males and 45% of females took medicine for it, and 15% of males and 22% of females had their blood pressure under control. Percentages of awareness, treatment, and control were much lower with the JNC V definition, which was introduced toward the end of survey period. People in metropolitan areas had the highest rates of awareness, treatment, control, and compliance to medication.
Journal of Human Hypertension (2001) 15, 793–798
Materials and methods
Data of this study were from the Nutrition and Health Survey in Taiwan (NAHSIT 1993–1996) col-lected between 1993 and 1996. Taiwan is an island off the southeast coast of China that has an area of 35 563 km2(13 869 square miles). The NAHSIT
car-ried out from 1993 to 1996 was the third survey to examine the changes of nutrition and health status of the people in Taiwan, which was generated from a multi-stage, unequal probability survey sample of people aged 4 years and older in Taiwan. Data were collected on the nutrition status, lifestyles, nutrition-related knowledge/attitude/practice, and nutrition-related disease status.
The survey divided 359 townships of Taiwan into seven strata according to the dietary characteristics of the residents, urbanisation index, and geographi-cal locations. These seven strata were Hakka people areas, mountainous areas, East Coast area, Peng-Hu
794 Table 1 Means and standard errors of blood pressures and prevalence in Taiwan by sex and age groups. All values are weighted to reflect their representation in the population
Sex Age groups n SBP (mm Hg) DBP (mm Hg) JNC IV Standardisedb JNC V or VI Standardisedb
(years) % (CI)a JNC IV % (CI)a JNC V or VI
Mean s.e. Mean s.e.
Males 4 –6 464 96.3 0.8 57.3 1.1 – – 7–12 987 105.3 0.6 65.4 1.1 – – 13–18 953 117.9* 1.2 70.0* 1.4 – – 19– 44 988 121.3* 0.7 78.0* 1.1 6 (2, 10) 19 (13, 25)* 45–64 961 130.9* 1.2 84.4* 0.9 26 (22, 30) 40 (36, 44)* 65+ 485 138.1* 1.5 79.1 0.7 27 (23, 31)* 27 (21, 33) 48 (42, 54) 48 (40, 56) ⭓19 2434 124.9 0.6 79.4 1.0 13 (11, 15) 16 (14, 18) 26 (22, 30)* 30 (26, 34) ⭓45 1446 133.3 0.8 82.7 0.7 27 (25, 29) 26 (24, 28) 43 (39, 47)* 42 (40, 44) Females 4 –6 466 94.0 0.5 56.7 0.9 – – 7–12 989 104.7 0.7 64.1 0.9 – – 13–18 961 109.6 0.9 68.7 1.4 – – 19– 44 1013 110.4 0.8 71.5 0.9 3 (1, 5) 8 (4, 12) 45–64 961 128.3 0.7 81.2 0.6 20 (16, 24) 33 (31, 35) 65+ 486 145.6 2.0 79.5 1.2 47 (37, 57) 47 (37, 57) 60 (52, 68) 59 (51, 67) ⭓19 2460 118.2 0.7 74.5 0.8 12 (10, 14) 15 (13, 17) 19 (17, 21) 23 (21, 25) ⭓45 1447 133.9 1.0 80.6 0.7 29 (25, 33) 28 (24, 32) 42 (38, 46) 41 (37, 45)
a95% confidence interval,bStandardised to US 1980 population.
*Significantly different from females (P⭐ 0.05).
islands, metropolitan cities, provincial cities and urbanisation class I townships, and urbanisation class II townships.
People in Taiwan are predominantly descendants of the so-called Han people, an inclusive name for various ethnic groups that have lived in the central plains of China since 2000 BC. The Hakkas are coun-ted as Han, but are markedly distinguished from other people in Taiwan by their dialect, dietary pat-tern, and their strong tendency for intra-group mar-riage. The Hakka areas are located primarily in the northwest of Taiwan. Hakka residents migrated to Taiwan a few hundred years ago from a few counties of Guangdong province. They have been known for consuming more preserved vegetables and using a lot of lard in cooking. The other distinct group of people in Taiwan are the aborigines who are geneti-cally related to the Malayo-Polynesians. Most of them live in the mountainous areas that occupy three-fifths of Taiwan and that have low population density. The East Coast area is a region isolated from the affluent western part of the Taiwan island. The area is influenced by the large number of aborigines living there. Peng-Hu islands are the major offshore islands in Taiwan strait under Taiwan’s jurisdiction. The rest of the cities and townships were classified into three strata by their degree of urbanisation. They were metropolitan cities, provincial cities and urbanisation class I townships, and urbanisation class II townships.
After the strata were defined, three townships (or city districts) were selected from each stratum with selection probability proportional to population size (PPS). Three villages (or Li’s, the smallest adminis-trative unit) were selected within each of the 21 townships (or city districts). A pseudo-Latin square
design was used to allocate survey time for town-ship in order to balance the effects of season and year. One of the three villages was surveyed in each season and in each year, the season being determ-ined as February to May, June to September, October to January. A designated number of individuals (8 or 16 depending on the age groups), were recruited door to door from two randomly selected geographi-cal clusters within each village for each of the 14 age-sex groups (age groups of 4 –6, 7–12, 13–15, 16– 18, 19– 44, 45–64, and 65+, for men and women). The survey team consisted of five interviewers who stayed in a village for 3 weeks to interview the selec-ted individuals. A physical examination team con-sisting of eight well-trained medical examiners and two public health nurses performed the physical check-up on the third and fourth weekend. Details about the design and the operational techniques of the survey have been described elsewhere.3
Alto-gether, 9961 individuals were interviewed, which corresponded to a response rate of 74%. About 97.5% of those who responded to questionnaires had their blood pressures measured.
Variables used in this paper included blood press-ures taken by well-trained interviewers at home and those derived from questionnaires: gender, age, strata, self-reported medical history on hypertension and use of antihypertensive medicines. The blood pressure measurers were trained according to the Coronary Artery Risk Development in Young Adults (CARDIA) protocol.4 The trainer has been certified
in the CARDIA center in Northwestern University Medical School (Chicago, IL, USA). Blood pressures were measured after the subject had rested for at least 5 min, using a standard sphygmomanometer and cuffs of appropriate sizes. The subject’s arm was
795
placed at the same height as the heart. Two measure-ments were recorded. If the difference between the two measurements was greater than 10 mm Hg, the third measurement was made and the average of the closer two was used to represent the mean blood pressure.
Two definitions of hypertension were used in this paper. One was the definition of JNC IV,5,6 which
defined hypertension as having either systolic blood pressure (SBP) ⭓160 mm Hg or diastolic blood pressure (DBP)⭓95 mm Hg, or using antihyperten-sive drugs. The other one was the definition of JNC V7 and JNC VI,8 which defined hypertension as
either having SBP⭓140 mm Hg or DBP ⭓90 mm Hg, or using antihypertensive medication.
Sampling weights were calculated for each sub-ject, using post-stratification methods, to reflect the representation of the subject in the population. SAS version 6.129and SUDAAN version 7.510 were used
to estimate the weighted averages, standard errors and percentiles of blood pressure, prevalence, awareness, and control of hypertension for males and females in various age groups and regions (strata).
Results
Table 1 shows the average blood pressure of the population by gender and age groups. Those who were taking antihypertensive drugs were not excluded in the calculation. The mean SBP values of both males and females were similar before age 12 and both increased as the age increased. The SBP of males increased from 96.3 mm Hg of those aged between 4 and 6 years to 138.1 mm Hg of those older than 65 years. The SBP of females increased from 94.0 mm Hg of those aged between 4 and 6 years to 145.6 mm Hg of those older than 65 years. The SBP of people aged between 13–18 years and those aged 19– 44 years were similar, then increased sharply after 45 years old. Females had lower SBP than males between age 13 and 65 years, but they were higher after the age of 65 years. The largest discrep-ancy of SBP between males and females appeared at the ages between 13 and 44 years.
Table 1 also shows the average DBP of the popu-lation by gender and age groups. The DBP values for both males and females were similar before 12 years old and both increased with age, then decreased after the age of 65 years. The DBPs of females were always lower than those of males in almost all the adult age groups, except the oldest age group (⭓65 years). The largest differences occurred at age 19– 44 years.
The prevalence of hypertension according to the JNC IV and V (or VI) definition by gender and age groups is listed in Table 1. Since the definition of hypertension for children has not been clearly defined in Taiwan, only the prevalence of adults was presented in Table 1. The prevalence in adult males (⭓19 years) was 13%, and that of adult
females was 12%. The prevalence of middle-to-old age groups (⭓45 years) was 27% and 29% for men and women respectively. The prevalence increased as age increased in both males and females. The prevalence of people aged between 19 and 44 years was 6% for males and 3% for females. Then, it increased to 47% for females older than 65 years. This was the only age group where the prevalence of hypertension in females exceeded that of males by a large difference (20%). When standardised to the 1980 US population, the prevalence defined by JNC IV was 16% for adult males (⭓19 years) and 15% for females.
When defined by JNC VI, the prevalence in adult males (⭓19 years) was 26% and 19% in adult females. The prevalence in middle-to-old age males and females (⭓45 years) was 43% and 42%, respect-ively. The age trend was very apparent. For males, the proportion of hypertension increased from 19% in adults aged between 19 and 44 years, to 40% in the middle-age group (45–64 years), then to 48% in the elderly (⭓65 years). For females, it increased from 8% in women aged between 19 and 44 years, to 33% in the middle-age group (45–64 years), then to more than 60% in the elderly (⭓65 years). The prevalence in males was higher than females in almost all the age groups, except the oldest age group (⭓65 years). After being standardised to the 1980 US population, the prevalence defined by JNC VI was 30% and 23% for adult males and females, respectively.
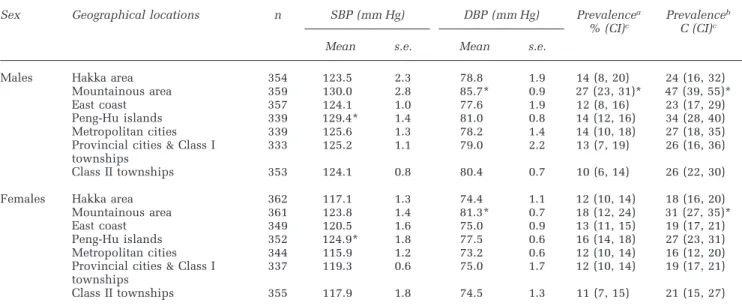
Table 2 presents the average BP and the preva-lence of hypertension of adults (⭓19 years) by sex and geographic locations. The mean SBP of males and females in Peng-Hu islands were significantly higher than those in Hakka areas, whereas adults in mountainous areas had higher DBP than Hakka areas. If the JNC-VI definition was used, the preva-lence in the mountainous areas was 47% and 31% for adult males and females respectively. The high-est prevalence occurred in the mountainous areas for both adult males and females.
Table 3 shows the awareness, medication and control of hypertension by age and gender groups. Using the JNC IV definition, 40% of the adult males (⭓19 years) and 58% of adult females were aware of their disease status. More mid- or old-aged (⭓45 years) females than males knew their disease status. The awareness was low in younger age groups (19– 44 years). Only 15% of males and 25% of females in this age group knew they had hypertension. The awareness increased in the middle age group (45– 64 years); 47% of males and 66% of females among those who had hypertension knew their disease status. When they reached the age beyond 65 years, 69% of males and 66% of females with hypertension knew their disease status. The proportion of aware-ness was 55% and 66% in middle-to-old age (⭓45 years) males and females respectively. Around 28% of the hypertensive adult males (⭓19 years) and 45% of hypertensive adult females were on
medi-796 Table 2 The mean and standard error of blood pressures of adults (⭓19 years) in Taiwan, by sex and geographical locations.
Sex Geographical locations n SBP (mm Hg) DBP (mm Hg) Prevalencea Prevalenceb
% (CI)c C (CI)c
Mean s.e. Mean s.e.
Males Hakka area 354 123.5 2.3 78.8 1.9 14 (8, 20) 24 (16, 32) Mountainous area 359 130.0 2.8 85.7* 0.9 27 (23, 31)* 47 (39, 55)* East coast 357 124.1 1.0 77.6 1.9 12 (8, 16) 23 (17, 29) Peng-Hu islands 339 129.4* 1.4 81.0 0.8 14 (12, 16) 34 (28, 40) Metropolitan cities 339 125.6 1.3 78.2 1.4 14 (10, 18) 27 (18, 35) Provincial cities & Class I 333 125.2 1.1 79.0 2.2 13 (7, 19) 26 (16, 36) townships
Class II townships 353 124.1 0.8 80.4 0.7 10 (6, 14) 26 (22, 30) Females Hakka area 362 117.1 1.3 74.4 1.1 12 (10, 14) 18 (16, 20) Mountainous area 361 123.8 1.4 81.3* 0.7 18 (12, 24) 31 (27, 35)* East coast 349 120.5 1.6 75.0 0.9 13 (11, 15) 19 (17, 21) Peng-Hu islands 352 124.9* 1.8 77.5 0.6 16 (14, 18) 27 (23, 31) Metropolitan cities 344 115.9 1.2 73.2 0.6 12 (10, 14) 16 (12, 20) Provincial cities & Class I 337 119.3 0.6 75.0 1.7 12 (10, 14) 19 (17, 21) townships
Class II townships 355 117.9 1.8 74.5 1.3 11 (7, 15) 21 (15, 27)
aJNC IV definition;bJNC VI definition;c95% confidence interval; *Significantly (P⬍ 0.05) different from people in Hakka areas.
Table 3 The awareness, medication and control of hypertension in Taiwan by sex and age groups
Sex Age groups JNC IV definition JNC VI definition
(years)
Awarenessa Medicationa Controla Control after Awarenessa Medicationa Controla Control after
% (CI)c % (CI)c % (CI)c medb % (CI)c % (CI)c % (CI)c medb
% (CI)c % (CI)c Males 19– 44 15 (5, 25) 3 (0, 7) 0 (–) 12 (0, 36) 7 (3, 11) 1 (–) 0 (–) 10 (0, 28) 45–64 47 (41, 53)* 36 (28, 44)* 14 (4, 24)* 38 (16, 50) 35 (27, 43)* 23 (17, 29)* 3 (0, 7)* 13 (0, 27) 65+ 69 (57, 81) 56 (40, 74) 36 (24, 48) 64 (54, 74) 45 (37, 53) 32 (24, 40) 8 (2, 14) 26 (10, 42) ⭓19 40 (32, 48)* 28 (18, 38)* 14 (6, 22) 49 (37, 61) 22 (18, 26)* 13 (9, 17)* 2 (0, 4)* 18 (10, 26) ⭓45 55 (51, 59)* 43 (35, 51)* 21 (13, 29) 50 (38, 62) 39 (35, 43)* 26 (22, 30)* 5 (3, 7) 18 (10, 26) Females 19– 44 25 (9, 41) 8 (0, 22) 0 (–) 4 (0, 12) 13 (3, 23) 3 (0, 9) 0 (–) 2 (0, 6) 45–64 66 (56, 76) 54 (44, 64) 30 (24, 36) 56 (40, 72) 46 (40, 52) 33 (29, 37) 8 (6, 10) 24 (16, 32) 65+ 65 (57, 73) 52 (42, 62) 22 (16, 28) 43 (23, 63)* 52 (48, 56) 40 (32, 48) 6 (4, 8) 15 (7, 23) ⭓ 19 58 (52, 64) 45 (39, 51) 21 (15, 27) 48 (36, 60) 39 (35, 43) 28 (24, 32) 5 (3, 7) 18 (12, 24) ⭓ 45 66 (60, 72) 53 (47, 59) 26 (20, 32) 49 (35, 63) 49 (43, 57) 36 (32, 40) 7 (5, 9) 19 (13, 25)
aThe proportions of awareness, treatment and control are the proportions of the hypertensive.bThe proportions of control after
medi-cation are proportions of those on medimedi-cation.c95% confidence interval. *Significantly different from females at the 5% level.
cation. The proportion of those taking medication increased to 56% in males and 52% in females when they reached 65 years or older.
The control of hypertension was far from ideal. Among the adults (⭓19 years) with hypertension, only 14% of males and 21% of females had it under control. The younger the age group, the lower the proportion keeping hypertension under control. Less than 1% of people aged between 19 and 44 years had their hypertension under control. Among middle-age (45–64 years) people, 14% of males and 30% of females had their hypertension under con-trol. The results showed that males over 65 years old had the highest proportion of awareness and control of hypertension among all the sex/age groups (Table 3).
When the JNC VI definition was used (Table 3),
the awareness of adult males (⭓19 years) was 22% and that for adult females was 39%. Only 13% of adult males and 28% of adult females were on medi-cation. The proportion of people with hypertension who had it under control dropped to less than 2% in adult males and 5% in adult females. More eld-erly (⭓65 years) knew their disease status (45% of males and 52% of females) than other age groups. However, their control of it was not ideal. Only 8% of elderly males and 6% of elderly females had their blood pressure under control.
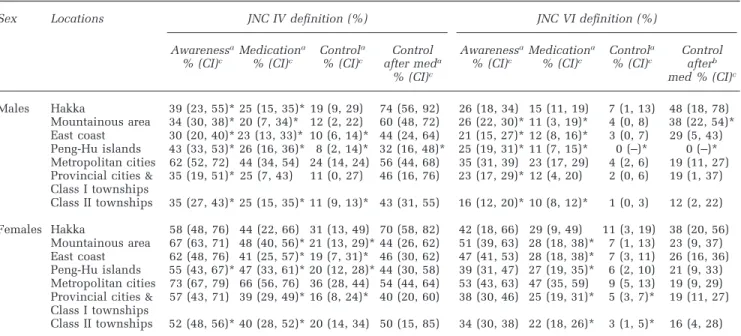
Table 4 presents the awareness, medication and control of hypertension in adults by sex and geo-graphic locations. Adult males and females in the metropolitan cities had the highest awareness of the disease under both definitions. Similarly, more people in the metropolitan cities were on
medi-797
Table 4 The awareness, medication and control of hypertension of adults (⭓19 years) in Taiwan by sex and geographical locations
Sex Locations JNC IV definition (%) JNC VI definition (%)
AwarenessaMedicationa Controla Control AwarenessaMedicationa Controla Control
% (CI)c % (CI)c % (CI)c after meda % (CI)c % (CI)c % (CI)c afterb
% (CI)c med % (CI)c
Males Hakka 39 (23, 55)* 25 (15, 35)* 19 (9, 29) 74 (56, 92) 26 (18, 34) 15 (11, 19) 7 (1, 13) 48 (18, 78) Mountainous area 34 (30, 38)* 20 (7, 34)* 12 (2, 22) 60 (48, 72) 26 (22, 30)* 11 (3, 19)* 4 (0, 8) 38 (22, 54)* East coast 30 (20, 40)* 23 (13, 33)* 10 (6, 14)* 44 (24, 64) 21 (15, 27)* 12 (8, 16)* 3 (0, 7) 29 (5, 43) Peng-Hu islands 43 (33, 53)* 26 (16, 36)* 8 (2, 14)* 32 (16, 48)* 25 (19, 31)* 11 (7, 15)* 0 (–)* 0 (–)* Metropolitan cities 62 (52, 72) 44 (34, 54) 24 (14, 24) 56 (44, 68) 35 (31, 39) 23 (17, 29) 4 (2, 6) 19 (11, 27) Provincial cities & 35 (19, 51)* 25 (7, 43) 11 (0, 27) 46 (16, 76) 23 (17, 29)* 12 (4, 20) 2 (0, 6) 19 (1, 37) Class I townships Class II townships 35 (27, 43)* 25 (15, 35)* 11 (9, 13)* 43 (31, 55) 16 (12, 20)* 10 (8, 12)* 1 (0, 3) 12 (2, 22) Females Hakka 58 (48, 76) 44 (22, 66) 31 (13, 49) 70 (58, 82) 42 (18, 66) 29 (9, 49) 11 (3, 19) 38 (20, 56) Mountainous area 67 (63, 71) 48 (40, 56)* 21 (13, 29)* 44 (26, 62) 51 (39, 63) 28 (18, 38)* 7 (1, 13) 23 (9, 37) East coast 62 (48, 76) 41 (25, 57)* 19 (7, 31)* 46 (30, 62) 47 (41, 53) 28 (18, 38)* 7 (3, 11) 26 (16, 36) Peng-Hu islands 55 (43, 67)* 47 (33, 61)* 20 (12, 28)* 44 (30, 58) 39 (31, 47) 27 (19, 35)* 6 (2, 10) 21 (9, 33) Metropolitan cities 73 (67, 79) 66 (56, 76) 36 (28, 44) 54 (44, 64) 53 (43, 63) 47 (35, 59) 9 (5, 13) 19 (9, 29) Provincial cities & 57 (43, 71) 39 (29, 49)* 16 (8, 24)* 40 (20, 60) 38 (30, 46) 25 (19, 31)* 5 (3, 7)* 19 (11, 27) Class I townships
Class II townships 52 (48, 56)* 40 (28, 52)* 20 (14, 34) 50 (15, 85) 34 (30, 38) 22 (18, 26)* 3 (1, 5)* 16 (4, 28)
aThe proportions of awareness, medication and control are the proportions of the hypertensive.bThe proportions of control after
medi-cation are proportions of those on medimedi-cation.c95% confidence interval. *Significantly different from metropolitan cities at the 5%
level.
cation and had their blood pressures under control than in other areas.
Discussion
This paper presents the hypertension status of people in Taiwan in 1993–1996. Starting from 1995, the Department of Health in Taiwan has adopted the JNC-V or VI7 definition for hypertension detection
and treatment.8About 26% of the adult males (⭓19
years) and 19% of adult females have hypertension defined by JNC V (VI) criteria. The prevalence in the middle-to-old (⭓45 years) age population could be as high as 43% in males and 42% in females. Almost half the elderly (⭓65 years) males (48%) and 60% of the elderly females were hypertensive. Hence, hypertension is a very common chronic disease in Taiwan.
When compared with earlier results11–17from
dif-ferent areas in Taiwan, the results of this survey were higher than past results, using the JNC IV definition. This implies that the prevalence of hypertension has increased (Figure 1). It has been speculated that the increase of hypertension is prim-arily related to the increase of obesity,18since mean
BMI has increased steadily in recent decades.19
Pre-vious studies showed that the average blood press-ures of people in Taiwan were lower than those of people in Europe or in the United States.17,19
Recently, hypertension prevention in the United States and many western European countries has been very effective. As a result, the prevalence of hypertension has started to decline.7The prevalence
of hypertension (using the JNC VI definition) in this
Figure 1 Comparison of prevalence of hypertension of different
studies in Taiwan by age groups. The definition of hypertension is either with SBP/DBP⭓160/95 mm Hg or taking antihyperten-sive drugs.
study for adults was 30% for males and 23% for females, after being standardised to the 1980s US population. The prevalence was higher than those of the NHANES II (1976–1980) and NHANES III (1991– 1994) studies.19
Before mid-1995, the JNC IV definition was widely used. The status of hypertension awareness was far from ideal under this definition. Only 40%
798
of adult males and 58% of adult females knew their disease status. Among the hypertensive, only 14% males and 21% females had their blood pressures under control. Males were worse than females in terms of awareness and on medication for hyperten-sion. In comparison with data from NHANES, the status of hypertension awareness and control in Tai-wan was much poorer. NHANES reported that 44% of males and 80% of females in the US knew that they had hypertension and that 25% of males and 45% of females controlled their blood pressure well. If the JNC VI definition (SBP/DBP ⭓140/90 mm Hg) is used, the situation is worse. Less than a quarter of the hypertensive adult males and 39% of the females knew that they had hypertension. Very few of them took antihypertensive drugs: 13% of hypertensive males and 28% of the hypertensive females. The status of hypertension control was very poor: 2% of hypertensive males and 5% of hyperten-sive females had their hypertension under control. This was in part due to the fact that Tawain was at the transition stage of switching from JNC IV to JNC VI. Nevertheless, education on hypertension control needs to be stressed more in Taiwan.
The highest prevalence occurred in the mountain-ous areas and Peng-Hu islands. Metropolitan cities had the highest proportion of hypertension aware-ness, using antihypertensive drugs, and hyperten-sion under control among the seven geographical locations. Whether this phenomenon was related to the accessibility of medical resources and infor-mation or due to a higher social economic status in metropolitan cities, requires further investigation.
In conclusion, hypertension prevalence is increas-ing in Taiwan. We have observed differences in rates of hypertension prevalence, awareness, treatment, control and compliance within the Taiwan region. The pattern of high prevalence rates in mountainous areas and Peng-Hu islands is consistent with that of obesity and alcohol intakes (data not shown). Metro-politan areas had the highest rates of awareness, treatment, control, and compliance to medication, pointing to the importance of public health edu-cation.
Acknowledgements
Appreciation should go to all the dedicated field workers and those who helped facilitate the field works in every survey site. This survey was spon-sored by the Department of Health in Taiwan (DOH FN8202, DOH-84-FS-11, DOH-85-FS-11, DOH-86-FS-11).
References
1 Department of Health. Health and Vital Statistics: (2)
Vital Statistics, Taiwan area, ROC, Taipei, Taiwan.
The Executive Yuan: Republic of China, 1998.
2 Laragh JH, Brenner BM. Hypertension:
Pathophysiol-ogy, Diagnosis, and Management. Raven Press: New
York, 1990; pp 101–117.
3 Pan W-H et al. Nutrition and Health Survey in Taiwan (NAHSIT) 1993–1996: design, contents, and operation.
Nutr Sci J 1999; 24: 11–39.
4 Ballew C et al. The utility of indirect measures of obes-ity in racial comparisons of blood pressure. CARDIA Study Group. J Clin Epidemiol 1990; 43: 799–804. 5 Hill MN, Russell RP. Revision of guidelines for high
blood pressure management: JNC IV. Joint National Com-mittee on Detection, Evaluation and Treatment of High Blood Pressure. Maryland Med J 1988; 37: 698–701. 6 Krishan I, Moser M. 1980 Recommendations of the
Joint National Committee on Detection, Evaluation, and Treatment of High Blood Pressure (editorial).
Hypertension 1980; 2: 821–822.
7 The Fifth Report of the Joint National Committee on Detection, Evaluation, and Treatment of High Blood Pressure (JNC V). Arch Intern Med 1993; 153: 154 –183. 8 National Institutes of Health, National Heart, Lung, and Blood Institute. The Sixth Report of the Joint
National Committee on Prevention, Detection, Evalu-ation, and Treatment of High Blood Pressure. NIH
Pub-lication No. 98– 4080, 1997.
9 SAS Institute Inc. SAS/STAT User’s Guide, Version 6,
4th edn, Vols 1 and 2. SAS Institute: Cary, NC, 1989.
10 Shah BV, Barnwell BG, Bieler GS. SUDAAN, User’s
Manual, Release 7.5. Research Triangle Institute:
Research Triangle Park, NC, 1997.
11 Hung TP. A study on the prevalence of elevated blood pressure among urban Chinese in Taiwan. Jap Circ J 1961; 25: 2084 –2100.
12 Lin C-Y, Hung J-P, Chen J-M, Hsu J-C. The first report of hypertension on metropolitan Chinese—the observed mean blood pressure [In Chinese]. J Form
Med Assoc 1956; 55: 150–161.
13 Chen C-H et al. Epidemiology of hypertension in Kin-Hu, Kinmen. Am J Hypertension 1995; 8: 395– 403. 14 Chen C-J et al. Six-community hypertension intervention
trial in Taiwan: epidemiological characteristics and treat-ment compliance [In Chinese; English abstract]. J Natl
Public Health Assoc (ROC) 1988; 8: 255–269.
15 Ko YC, Hu HT. Epidemiological survey of hyperten-sion in Taiwan [In Chinese; English abstract]. Chin
Med J 1981; 28: 14 –21.
16 Tseng W-P. Outcome of untreated hypertensives in an agricultural population, a 15-year follow-up study [In Chinese; English abstract]. J Form Med Assoc 1980; 79: 556–563.
17 Tseng W-P. Blood pressure and hypertension in an agricultural and a fishing population in Taiwan. Am J
Epidemiol 1976; 86: 513–525.
18 Kao MD et al. Prevalence of obesity and distributions of anthropometric parameters of Taiwan residents.
Report of The Nutrition and Health Survey in Taiwan (NAHSIT: 1993–1996). Department of Health, The
Executive Yuan: Republic of China, 1998.
19 Burt VL et al. Trends in the prevalence, awareness, treatment, and control of hypertension in the adult US population: data from the Health Examination Sur-veys, 1960–1991. Hypertension 1995; 26: 60–69.