Analysis of urinary nucleosides as potential tumor markers in human breast cancer
by high performance liquid chromatography/electrospray ionization tandem
mass spectrometry
Wei-Yi Hsu
a,b, Wei-De Lin
a, Yuhsin Tsai
c, Chiung-Tsung Lin
d, Hwei-Chung Wang
e, Long-Bin Jeng
e,
Ching-Chih Lee
e, Yu-Chiang Lin
e, Chien-Chen Lai
c,f,⁎
, Fuu-Jen Tsai
a,g,⁎⁎
a
Department of Medical Research, China Medical University Hospital, Taichung, Taiwan
b
Center for Molecular Medicine, China Medical University Hospital, Taichung, Taiwan
c
Graduate Institute of Chinese Medical Science, China Medical University, Taichung, Taiwan
dDepartment of Laboratory Medicine, China Medical University Hospital, Taichung, Taiwan e
Department of Surgery, China Medical University Hospital, Taichung, Taiwan
f
Institute of Molecular Biology, National Chung Hsing University, Taichung, Taiwan
g
Department of Health and Nutrition Biotechnology, Asia University, Taichung, Taiwan
a b s t r a c t
a r t i c l e i n f o
Article history:
Received 3 November 2010 Received in revised form 19 June 2011 Accepted 21 June 2011
Available online 30 June 2011 Keywords: Nucleosides Breast cancer HPLC/MS/MS Tumor markers Urine
Background: Breast cancer is the most common female cancer and the fourth leading cause of cancer death among women in Taiwan. We measured urinary nucleoside levels in female breast cancer patients (n = 36) to evaluate the diagnostic value of nucleosides as potential tumor markers.
Methods: Purification of urinary nucleosides was performed using a 96-well solid phase extraction (SPE, cation-exchange column) procedure to decrease the variation between the single column preparations and to shorten the pretreatment time. Cation-exchange allows for the comprehensive purification of modified nucleosides, such as 2-deoxynucleosides, that are not purifiable by phenylboronic acid-based SPE. High-performance liquid chromatography (HPLC) coupled with mass spectrometry (MS) in selected reaction monitoring (SRM) mode was used to quantify multiple nucleosides. Tubercidin was used as an internal standard. The qualitative parameters, retention time, and the parent and daughter ions used revealed that the method was more specific and sensitive than traditional UV detection.
Results: Urinary levels of 3 nucleosides, cytidine, 3-methylcytidine, and inosine were significantly higher in breast cancer patients than in normal controls (pb0.01). The discriminative powers of cytidine, 3-methylcytidine, and inosine were 58%, 58%, and 62%, respectively.
Conclusions: LC/MS/MS is a highly specific and sensitive method for rapidly screening a large number of urinary nucleosides that may be potential cancer markers. The 3-methylcytidine may be a candidate marker for breast cancer.
© 2011 Elsevier B.V. All rights reserved.
1. Introduction
The emergingfield of metabolomics is characterized by the study of metabolic intermediates, hormones, signaling molecules, and secondary metabolites. In any biological system, metabolites of high chemical
diversity are present in a dynamic range of concentrations that can exceed 10 orders of magnitude, thereby making quantitative analysis extremely challenging (Human Metabolome Database).
Mass spectrometry (MS) is a powerful tool in the field of
metabolomics. There are two approaches to using MS when searching for metabolic biomarkers. In the untargeted approach, high-resolution mass spectrometry is usually used. By combining accurate mass analysis and fragmentation patterns, the structures of the metabolites can be assigned with relative certainty[1–3]. Statistical analyses can then be applied to the results of MS data tofind significant differences in candidate biomarkers between disease and control groups. In the targeted approach, however, the candidate biomarkers are selected in advance to evaluate the discriminative power relative to the specific disease.
Nucleosides in urine are an important class of metabolites and have the potential of serving as tumor markers[4]. Modified nucleosides,
Abbreviations: HPLC/ESI-MS/MS, high performance liquid chromatography-electrospray/tandem mass spectrometry; SRM, selective reaction monitoring; MALDI-TOFMS, matrix-assisted laser desorption/ionization time offlight mass spectrometry; ISTD, internal standard; SPE, solid phase extraction.
⁎ Correspondence to: C-C. Lai, Institute of Molecular Biology, National Chung Hsing University, No. 250, Kuo-Kuang Road, Taichung, 402 Taiwan. Tel.: +886 4 22840485x235; fax: +886 4 22858163.
⁎⁎ Correspondence to: F-J. Tsai, Department of Medical Research, China Medical University Hospital, Taichung, Taiwan. Tel.: +886 4 22062121x7076; fax: +886 4 22033295.
E-mail addresses:[email protected](C.-C. Lai),[email protected] (F.-J. Tsai).
0009-8981/$– see front matter © 2011 Elsevier B.V. All rights reserved. doi:10.1016/j.cca.2011.06.027
Contents lists available atScienceDirect
Clinica Chimica Acta
regarded as indicators for the whole-body turnover of RNAs, are formed at the posttranscriptional stage by chemical modification of normal nucleosides. Modified nucleosides are excreted in abnormal amounts in the urine of patients with malignancies and several studies have shown a positive relation between nucleoside levels and cancer status[4–6]. Traditionally, analysis of urinary nucleosides has involved the use of liquid chromatography with ultraviolet detection (LC–UV)
[7]. By comparing the chromatographic retention and UV spectra with known standard references, the nucleosides can be identified and quantified. When performing multiple analyses of nucleosides in urine, however, a time-consuming separation step is needed to avoid coelution and erroneous identification of large similar compounds. In contrast, MS is a more efficient technique for analyzing urinary nucleosides. Many novel nucleosides have been identified using MS and tandem MS coupled with liquid chromatography[1–3]or capillary electrophoresis[8]in untargeted analysis. Furthermore, both MS and tandem MS allow for the specific detection of coeluted nucleosides as long as they are different in parent or daughter mass.
Preliminary purification of nucleosides is a very important step prior to instrumental analysis. In our experience, the matrix suppres-sion effect of urine causes poor ionization, especially of less hydro-phobic nucleosides. Solid phase extraction (SPE) is a common method in sample preparation and phenylboronic acid (PBA) is widely used as the stationary phase because of its affinity for the vicinal hydroxyl group contained in the structure of nucleosides. PBA, however, is not effective at purifying deoxynucleoside structures such as 8-hydroxy-2-deoxyguanosine and 5-hydroxymethyl-deoxyuridine, two nucleo-sides that have been shown to be potential markers of breast cancer
[9–11].
2. Materials and methods 2.1. Urine samples
Early morning urine samples were obtained from female breast cancer patients and healthy control subjects at the China Medical University Hospital (CMUH), Taichung, Taiwan and then immediately sent to the laboratory and stored at−80 °C until analysis. The clinical characteristics of the 36 breast cancer patients were according to the
TNM System (Tumor–Node–Metastasis) [12] (the supplementary
data Table S-1). Control subjects (n = 24) comprised healthy women who had undergone a routine annual health examination. There were no significant differences in weight, BMI, tobacco use, multivitamin supplement intake, age, or sex between the patients and the control subjects. Written and oral consents to participate in the study were obtained from all of the participants.
2.2. Chemicals
Nucleosides examine in this study were purchased from Sigma (St Louis, MO): cytidine (C), 3-methylcytidine (m3C), 1-methyladenosine (m1A), guanosine (G), 7-methylguanosine (m7G), adenosine (A), inosine (I), 2-deoxyguanosine (dG), 8-hydroxy-2-deoxyguanosine (8OHdG), N2,N2-dimethylguanine (NNGua) and tubercidin (internal
standard, ISTD). HPLC grade methanol and acetonitrile were obtained from LAB-SCAN Analytical Science (Labscan Ltd. Dublin, Ireland). Deionized water (Milli-Q water system, Millipore Inc., Bedford, MA) was used in the preparation of the samples and buffer solution. 2.3. Preparation of standard solutions and calibration curves
Stock solutions of the nucleoside standards and internal standard (tubercidin) were prepared at the concentration of 100–1000 μg/ml in methanol and kept in the dark at−80 °C until used. For the calibration curves, the concentrations of the calibration solutions of standard mixture were 0.1, 0.25, 0.5, 1, 5, 10 and 20μg/ml and the concentration
of the calibration solution of the internal standard mixture was 2μg/ml. These calibration solutions were prepared in HPLC mobile phase solution (2 mmol/l aqueous ammonium acetate, pH 5.0) instead of urine because all urine has nucleosides[11]. These standard solutions were also used for method validation. Both the intra- and inter-day precision and accuracy of the method were determined by triplicate analysis of standard samples containing nucleosides at the concen-trations used to construct the calibration curves.
2.4. Pre-purification of urinary nucleosides For nucleoside purification, the OASIS@
MCX 96-well plate, (Oasis@MCX, Waters), a vacuum manifold, and a vacuum source were
used. The plate was conditioned and equilibrated with 1 ml methanol and 1 ml water, respectively. Each urine sample was acidified using 2 mol/l HCl (adjust to 0.01 mol/l HCl) to pH 2–3. The acidified urine was centrifuged at 12,000 g for 15 min and a 1 ml aliquot of supernatant fluid was added to 100 μl of internal standard (ISTD) (2 μg/ml). This 1.1 ml sample solution was loaded onto the plate directly and then washed with 1.5 ml of 2% formic acid (in H2O). The plates were
thoroughly dried by vacuum (10–15 mm Hg) for 2 min. Finally, urine samples were eluted with 1 ml of 2.8% NH4OH in methanol in another
96-well plate. The eluate (1 ml) was evaporated to dryness in a vacuum system and reconstituted in 100μl of HPLC mobile phase solution (2 mmol/l aqueous ammonium acetate, pH 5.0).
2.5. HPLC/MS/MS analysis
Chromatography was performed using a Finnigan™ Surveyor™
HPLC system. HPLC analysis was performed on a 3-μm C18 column (Atlantis@dC18, 2.1 mm i.d. × 100 mm, Waters). A guard column
(Atlantis@dC18, 2.1 mm i.d.× 20 mm, Waters) was used to prolong the
life of HPLC column. The mobile phases used were (A) 2 mM aqueous ammonium acetate (pH 5.0) and (B) 50% methanolic 2 mmol/l
ammonium acetate. The flow rate was 0.2 ml/min. The gradient
conditions were as follows: isocratic elution (95% A) for 5 min, followed by 2 min gradient to 20% B, then a gradient to 30% B in 3 min, then the final gradient to 40% B in 10 min. Typically, the analysis lasted 20 min and additional 15 min was required to re-equilibrate the column. The autosampler was a Finnigan™ Surveyor™ autosampler fitted with a 2 μl loop. The HPLC and autosampler systems were all synchronized via Xcalibur software (Xcalibur™, Finnigan Corp.). A Finnigan LCQ DECA XPPLUSquadrupole ion trap mass spectrometer (Finnigan Corp., San Jose,
CA), equipped with a pneumatically assisted electrospray ionization
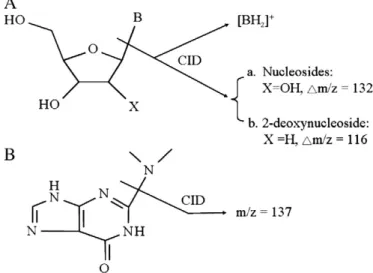
Fig. 1. Schematic diagrams of (A) nucleosides and (B) N2
,N2
-dimethylguanine after the CID process.“B” corresponds to the purine/pyridine moiety.
source, was used. The mass spectrometer was operated in positive ion mode by applying a voltage of 3.5 kV to the ESI needle. The temperature of the heated capillary in the ESI source was set at 295 °C. To avoid space charge effects, the number of ions stored in the trap was regulated by the automatic gain control, which was set at 1 × 10⁸ions for full scan mode,
4 × 10⁷for MS/MS mode, and 2 × 10⁷for selective reaction monitoring
(SRM) mode. Theflow rate of the sheath gas of nitrogen was set at 30 (arbitrary units). Helium was used as the damping gas at a pressure of 10− 3Torr. Voltages across the capillary and the octapole lenses were tuned by an automated procedure to maximize signal for the ion of interest. In MS/MS analysis, typical values for the relative collision energy (peak-to-peak amplitude of the resonance excitation) ranged from 0.4 to 0.8 eV. For quantitative experiments with SRM mode, the maximum ion collection time was 0.15 s for each step and 3 scans were added for each spectrum. We used the following SRM transitions for the quantification: cytidine, m/z 244 → 112; 3-methylcytidine, m/z
258→126; 1-methyladenosine, m/z 282→150; 7-methylguanosine,
m/z 298→166; guanosine, 284→152; adenosine, m/z 268→136;
inosine, m/z 269→137; 2-deoxyguanosine, m/z 268→152; 8-hydroxy-2-deoxyguanosine, m/z 284→ 168; N2,N2-dimethylguanine, m/z
180→137; tubercidin, m/z 267→135. Isolation width was set from 1 to 2 and the activation Q value was set at 0.25–0.45. The experi-mental programs were performed with the software package Xcalibur (Xcalibur™, Finnigan Corp.). The data processes of quantification were performed with the software, LCquan (Xcalibur™, Finnigan Corp.). The areas under the peaks were integrated to calculate the concentration of nucleosides.
2.6. Quantification of the urinary nucleosides
To compensate for variations in urine concentration, all nucleoside concentrations were indexed against creatinine and expressed as μmol nucleoside/mmol creatinine[10,11,14,15,17]. Urinary creatinine levels were determined by a modified Jaffe method, the principle of which is the reaction between creatinine and picric acid using colorimetric detection[13].
2.7. Statistical analyses
Creatinine-corrected concentrations of nucleosides in the breast cancer group and in the control group were plotted in a box plot diagram. The Student's t-test was used to measure differences in nucleoside levels between the 2 groups.
3. Results
In the MS/MS analysis, we monitored the separated nucleosides using positive ionization tandem mass spectrometry in selective reaction monitoring (SRM) mode. The protonated precursor ion [M + H]+was the most abundant ion of all nucleosides and the protonated base ion [BH2]+was the most abundant ion after collision-induced dissociation
(CID). Previous studies[1–3]have shown that the glycosidic bond that connects the base moiety and the ribose moiety tends to breakdown in the CID process. With the exception of pseudouridine, the major fragmentation ion was the loss of two water molecules [MH-2H2O]+
[11]. The m/z differences after CID were 132 Da and 116 Da for nucleosides and deoxynucleosides, respectively. Besides, N2,N2
-dimethylguanine, a modified nitrogen base, fragmented into a N2,N2
-dimethyl group and a guanine base (Fig. 1).
In this study, tubercidin was used as the internal standard for the quantification of urinary nucleosides. Although the retention time of tubercidin was different from other nucleosides, accuracy and precision of this method was of acceptable. The linearity of the calibration curve was evaluated via the R2regression coefficient of determination the
valuesN0.995 (Table 1). The accuracy of the method was measured by determining the mean concentration at various concentrations of analyte and was calculated as percentage error of theoretical versus measured concentrations. Precision was estimated as the CV of the analyses. The inter-assay and intra-assay CVs wereb15%. Accuracy
Table 1
Calibration curve for quantification of nucleosides.
Nucleoside Abbreviation Linearity (R2)
Cytidine C 0.9989 3-Methylcytidine m3C 0.9982 1-Methyladenosine m1A 0.9965 7-Methylguanosine m7G 0.9998 Inosine I 0.9966 Guanosine G 0.9988 2-Deoxyguanosine dG 0.9946 8-Hydroxy-2-deoxyguanosin 8OHdG 0.9987 N2 ,N2 -dimethylguanine NNGua 0.9997 Adenosine A 0.9992 Table 2
Intra- and inter-day precision and accuracy for nucleosides.
Nucleosides Specified amount Intra-day test Inter-day test
Average Precision (CV, %) Accuracy (%) Average Precision (CV, %) Accuracy (%)
C 5 4.88 4.24 2.45 5.02 2.01 0.49 1 1.07 11.53 7.06 0.97 8.11 3.02 m3C 5 4.84 9.19 3.17 4.95 3.96 1.06 1 1.04 14.86 4.41 0.98 1.04 1.59 m1A 5 4.60 9.82 7.90 4.93 3.68 1.34 1 1.06 11.90 6.35 1.01 1.60 1.26 m7G 5 5.10 8.66 1.95 5.02 4.37 0.46 1 0.92 11.58 8.06 1.04 7.66 4.01 I 5 4.62 6.57 7.56 4.71 8.34 0.85 1 1.07 11.89 6.64 1.04 11.43 4.00 G 5 4.60 6.64 7.96 4.67 7.42 6.59 1 0.97 9.56 3.41 1.04 7.06 3.53 dG 5 4.63 8.46 7.44 4.91 7.81 1.89 1 1.08 10.39 7.84 0.92 4.50 8.06 8OHdG 5 4.96 8.64 0.90 4.93 1.90 1.36 1 0.94 5.72 6.32 1.03 4.87 2.97 NNGua 5 4.98 7.86 0.33 4.95 2.19 0.92 1 1.04 2.24 4.27 0.99 11.12 0.99 A 5 5.04 5.11 0.86 4.99 4.64 0.27 1 0.97 5.37 2.61 0.97 1.30 3.08
varied with concentration but was generallyb10% (Table 2). It was found that the quantification of nucleosides performed by LC/MS/MS, using tubercidin as an internal standard, was of acceptable accuracy and precision.
In this study, the OASIS@ MCX 96-well plate was used to
pre-purification of urinary nucleosides. The OASIS@MCX plate contained
a mixed-mode sorbent with reversed-phase and cation-exchange functionalities. A standard solution of nucleoside mixture was repeat-edly analyzed with OASIS@MCX 96-well plate for isolation followed by
reversed-phase HPLC, as described above, for quantification. Extraction yields ranged from 81 to 108% for one microgram of each nucleoside placed on the affinity plate and the CVs were lower than 15% (Table 3). The cation-exchange function of OASIS@MCX was suitable to extract
both nucleosides, deoxynucleosides (dG and 8-OHdG) and nitrogen base (NNGua).
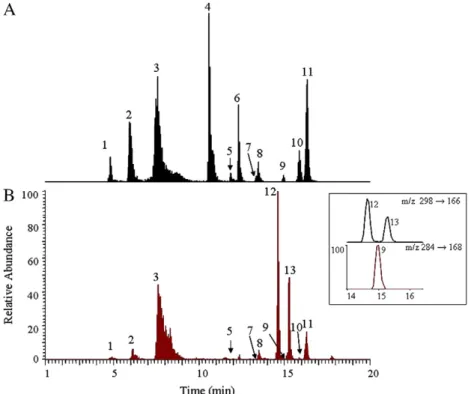
HPLC-MS/MS chromatograms represented the nucleoside standards and urinary nucleosides in a breast cancer patient are shown inFig. 2. The chromatograms show the total ion current (TIC) chromatogram with the relative abundance set at a scale of 2 × 10⁷. With the SRM
detection mode, the inset inFig. 2B was the mass chromatogram of peaks labeled with 9, 12 and 13. The unknown peaks 12 and 13 contained a base peak at m/z 298 which yielded a daughter ion at m/z 166. So the unknown peaks 12 and 13 could be detected in the SRM transition of the 7-methylguanosine. However, peaks 12 and 13 were not the nucleoside 7-methylguanosine due to the different retention
time. InFig. 2B, the obstacle of the partially coelution of peak 9 with peaks 12 and 13 in HPLC could be overcome by the MS/MS (SRM) detection. The specificity of detecting these nucleosides was greatly elevated with the SRM detection. Besides,Fig. 2confirms the importance of using a standard in order to minimize the false detection rate.
The distribution patterns of all the nucleosides in the patients and normal controls are summarized in a box plot format (Fig. 3). As seen in thefigure, the levels of all eight nucleosides were higher in patients than in controls. Of the ten nucleosides analyzed in this study, two nucleosides, namely guanosine and 7-methylguanosine, were not detected in urine and only three nucleosides were significantly elevated in patients relative to controls, namely cytidine (p = 0.0003), 3-methylcytidine (p = 0.0001), and inosine (p = 0.00007). The per-centage of patients with higher urinary nucleoside (Nthe normal mean value + 1 × S.D.) was further calculated, and it was 58%, 58% and 62% for cytidine, 3-methylcytidine and inosine.
4. Discussion
Using our method, we were able to separate 11 nucleosides (including the internal standard, tubercidin) in one HPLC cycle. The 10 nucleosides were screened from among those used in previous studies and only the nucleosides with available standards were selected. In our experience, false identification of metabolites in complex urine samples is common, especially when high resolution MS is not used. The standards provide more detailed information such as retention time in HPLC and provided more accurate tandem MS patterns, thereby increasing the reliability of thefindings.
In this study, purification of nucleosides in complex urine matrix from 36 breast cancer patients and 24 normal controls was performed with a cation exchange SPE and a 96-well SPE plate at the same time. The 96-well SPE plate allowed for large amounts of sample to be purified in a timely manner and decreased the variation between single column preparations.
Table 3
Extraction yield of nucleosides from OASIS@MCX 96-well plate.
Nucleosides and extraction yield, %
C m3C m1A m7G I G dG 8OHdG NNNGua A Average 101.1 97.6 99.6 81.0 85.4 92.0 82.5 108.7 106.9 93.4 STDEV 0.5 0.9 0.4 0.3 0.8 0.9 1.2 0.5 0.7 0.5 CV,% 5.4 9.4 3.7 3.4 9.0 9.5 15.0 4.8 6.6 5.4 One microgram of each nucleoside was added.
Fig. 2. HPLC-MS/MS chromatograms of (A) nucleoside standards and (B) urinary nucleosides in a breast cancer patient. The data are presented as the total ion chromatogram. 1. Cytidine, 2. 3-methylcytidine, 3. 1-methyladenosine, 4. 7-methylguanosine, 5. Inosine, 6. Guanosine, 7. 2-deoxyduanosine, 8. Tubercidin, 9. 8-hydroxy-2-deoxyguanosine, 10. N2
, N2
Our findings support those obtained in previous studies that cytidine and inosine are potential tumor markers for breast cancer
[14,15]or other cancers[16,17]. Our most interestingfinding, how-ever, is that 3-methylcytidine is also a potential biomarker. That nucleoside wasfirst isolated from soluble-ribonucleic acid (RNA)[18]
and subsequently isolated from the ribosomal and transfer RNA in HeLa cells[19,20]. The N3-position of the pyridine base of cytidine is the nuclephilic center and is most reactive to alkylation agents[21]. 3-Methylcytidine shows both mutagenic and toxic properties in single-stranded DNA[22]. Although urinary levels of 5-methylcytidin or 5-methylcytosine have been shown to be elevated in patients with breast cancer[1,10,11,23–26], no studies, to the best of our knowl-edge, have shown an association between 3-methylcytidine and cancer. Although 5-methylcytidin and 3-methylcytidine have the same parent ion and daughter ion in MS, the retention times differ in the HPLC analysis (supplementary data, Fig. S-1). This indicates that false identification was avoided in our study. Kammerer et al. reported that methylcytidine in urine was a potential diagnostic marker of breast cancer, although they did not identify the specific methylcy-tidine isomer, the specific daughter ions in MS/MS (m/z 69, 83, 95, 109 and 126) have been shown[27]. Until the CID patterns of cytidine and its derivates were reported by Jensen et al. [28], isomers were discriminated through sequential product ion spectra. Using the discriminated MSnpattern (specific m/z 69, 95 for m3C but not for
m5C), the methylcytidine isomer reported by Kammerer et al. would be defined as 3-methylcytidine. Our study is, therefore, the first to identify 3-methylcytidine as an abundant nucleoside in breast cancer urine. The MS and MS/MS (fragmentation pattern) of peak 2 were shown to be identical for the suspected nucleosides 3-methylcytidine
standard in this study. These bits of information provide the qualitative evidences. Besides, the different retention time of 3-and 5-methylcytidine has been added in the supplementary data as Fig. S-1. We also showed that 3-methylcytidine is a potential marker in breast cancer with a discriminative power of 58% in Taiwanese.
Multiple nucleosides rather than one nucleoside were evaluated in cancer disease in several reports. In such a multi-component alteration of the nucleosides levels, a bioinformatics pattern recognition method could reveal more information on the differences between healthy individuals and cancer patients than the evaluation of a single component solely [29–31]. According to our results, it is strongly recommended to incorporate urinary cytidine, 3-methylcytidine and inodine as multiplexed biomarkers to elevate the diagnostic sensitiv-ity. Combination of these potential nucleoside biomarkers or other possible biomarkers for evaluation of the diagnostic sensitivity is valuable in the further studies.
Acknowledgments
The study was funded by a grant from the China Medical University (CMU-94-017), Department of Health (DOH100-TD-C-111-005) and the National Research Council of the Republic of China.
Appendix A. Supplementary data
Supplementary data to this article can be found online atdoi:10. 1016/j.cca.2011.06.027.
References
[1] Bond A, Dudley E, Lemiere F, et al. Analysis of urinary nucleosides. V. Identification of urinary pyrimidine nucleosides by liquid chromatography/electrospray mass spectrometry. Rapid Commun Mass Spectrom 2006;20:137–50.
[2] Dudley E, Lemiere F, Van Dongen W, et al. Analysis of urinary nucleosides. IV. Identification of urinary purine nucleosides by liquid chromatography/electro-spray mass spectrometry. Rapid Commun Mass Spectrom 2004;18:2730–8. [3] Li HY, Wang SM, Liu HM, et al. Separation and identification of purine nucleosides
in the urine of patients with malignant cancer by reverse phase liquid chromatography/electrospray tandem mass spectrometry. J Mass Spectrom 2009;44:641–51.
[4] Gehrke CW, Kuo KC, Waalkes TP, Borek E. Patterns of urinary excretion of modified nucleosides. Cancer Res 1979;39:1150–3.
[5] Speer J, Gehrke CW, Kuo KC, Waalkes TP, Borek E. tRNA breakdown products as markers for cancer. Cancer 1979;44:2120–3.
[6] Nakano K, Nakao T, Schram KH, et al. Urinary excretion of modified nucleosides as biological marker of RNA turnover in patients with cancer and AIDS. Clin Chim Acta 1993;218:169–83.
[7] Gehrke CW, Kuo KC. Ribonucleoside analysis by reversed-phase high-performance liquid chromatography. J Chromatogr 1989;471:3–36.
[8] Simionato AV, Carrilho E, Maggi Tavares MF. CE–MS and related techniques as a valuable tool in tumor biomarkers research. Electrophoresis 2010;31:1214–26. [9] Sova H, Jukkola-Vuorinen A, Puistola U, Kauppila S, Karihtala P.
8-Hydroxydeox-yguanosine: a new potential independent prognostic factor in breast cancer. Br J Cancer 2010;102:1018–23.
[10] Cho SH, Choi MH, Lee WY, Chung BC. Evaluation of urinary nucleosides in breast cancer patients before and after tumor removal. Clin Biochem 2009;42:540–3. [11] Cho SH, Jung BH, Lee SH, Lee WY, Kong G, Chung BC. Direct determination of
nucleosides in the urine of patients with breast cancer using column-switching liquid chromatography–tandem mass spectrometry. Biomed Chromatogr 2006;20:1229–36.
[12] Marvel CC, Del Rowe J, Bremer EG, Moskal JR. Altered RNA turnover in carcinogenesis. The diagnostic potential of modified base excretion. Mol Chem Neuropathol 1994;21:353–68.
[13] Bartels H, Bohmer M, Heierli C. Serum creatinine determination without protein precipitation. Clin Chim Acta 1972;37:193–7.
[14] Seidel A, Brunner S, Seidel P, Fritz GI, Herbarth O. Modified nucleosides: an accurate tumour marker for clinical diagnosis of cancer, early detection and therapy control. Br J Cancer 2006;94:1726–33.
[15] Zheng YF, Kong HW, Xiong JH, Lv S, Xu GW. Clinical significance and prognostic value of urinary nucleosides in breast cancer patients. Clin Biochem 2005;38: 24–30.
[16] Zheng YF, Xu GW, Liu DY, et al. Study of urinary nucleosides as biological marker in cancer patients analyzed by micellar electrokinetic capillary chromatography. Electrophoresis 2002;23:4104–9.
[17] Feng B, Zheng MH, Zheng YF, et al. Normal and modified urinary nucleosides represent novel biomarkers for colorectal cancer diagnosis and surgery monitor-ing. J Gastroenterol Hepatol 2005;20:1913–9.
Fig. 3. Box plots of urinary nucleosides (A) cytidine, 3-methylcytidine, 1-methyladenosine, adenosine and (B) 2-deoxyguanosine, 8-hydroxy-2-deoxyguanosine, N2
,N2
-dimethyladenine, inosine. The bottom and top of the box represent the 25th and 75th percentile (the lower and upper quartiles, respectively), the band near the middle of the box is the 50th percentile and the square circle represents the average. In addition, the ends of the whiskers represent the maximum and minimum values.
[18] Hall RH. Isolation of 3-methyluridine and 3-methylcytidine from solubleribonu-cleic acid. Biochem Biophys Res Commun 1963;12:361–4.
[19] Iwanami Y, Brown GM. Methylated bases of ribosomal ribonucleic acid from HeLa cells. Arch Biochem Biophys 1968;126:8–15.
[20] Iwanami Y, Brown GM. Methylated bases of transfer ribonucleic acid from HeLa and L cells. Arch Biochem Biophys 1968;124:472–82.
[21] Leiros I, Nabong MP, Grosvik K, et al. Structural basis for enzymatic excision of N1-methyladenine and N3-methylcytosine from DNA. EMBO J 2007;26:2206–17. [22] Delaney JC, Essigmann JM. Mutagenesis, genotoxicity, and repair of 1-methyladenine,
3-alkylcytosines, 1-methylguanine, and 3-methylthymine in alkB Escherichia coli. Proc Natl Acad Sci USA 2004;101:14051–6.
[23] Feinberg AP, Gehrke CW, Kuo KC, Ehrlich M. Reduced genomic 5-methylcytosine content in human colonic neoplasia. Cancer Res 1988;48:1159–61.
[24] Zuo S, Boorstein RJ, Teebor GW. Oxidative damage to 5-methylcytosine in DNA. Nucleic Acids Res 1995;23:3239–43.
[25] Barciszewska AM, Murawa D, Gawronska I, Murawa P, Nowak S, Barciszewska MZ. Analysis of 5-methylcytosine in DNA of breast and colon cancer tissues. IUBMB Life 2007;59:765–70.
[26] Sasco AJ, Rey F, Reynaud C, Bobin JY, Clavel M, Niveleau A. Breast cancer prognostic significance of some modified urinary nucleosides. Cancer Lett 1996;108:157–62. [27] Kammerer B, Frickenschmidt A, Muller CE, Laufer S, Gleiter CH, Liebich H. Mass spectrometric identification of modified urinary nucleosides used as potential biomedical markers by LC–ITMS coupling. Anal Bioanal Chem 2005;382:1017–26. [28] Jensen SS, Ariza X, Nielsen P, Vilarrasa J, Kirpekar F. Collision-induced dissociation
of cytidine and its derivatives. J Mass Spectrom 2007;42:49–57.
[29] Xu G, Schmid HR, Lu X, Liebich HM, Lu P. Excretion pattern investigation of urinary normal and modified nucleosides of breast cancer patients by RP-HPLC and factor analysis method. Biomed Chromatogr 2000;14:459–63.
[30] Bullinger D, Frohlich H, Klaus F, et al. Bioinformatical evaluation of modified nucleosides as biomedical markers in diagnosis of breast cancer. Anal Chim Acta 2008;618:29–34.
[31] Cho J, Kim J, Kim K. Capillary electrophoretic profiling and pattern recognition analysis of urinary nucleosides from thyroid cancer patients. Anal Chim Acta 2003;486:171–82.