Abstract—The Electroencephalogram (EEG) dynamics which relate to motion sickness are studied in this paper. Instead of providing visual or motion stimuli to the subjects to induce motion sickness, we employed a dynamic virtual-reality (VR) environment in our research. The environment consisted of a 3D surrounding VR scene and a motion platform providing a realistic situation. This environment provided the advantages of safety, low cost, and the realistic stimuli to induce motion sickness. The Motion Sickness Questionnaire (MSQ) was used to assess the sickness level, and the EEG effects on the subjects with high sickness levels were investigated using the independent component analysis (ICA). The fake-epoch extraction was then applied to the nausea-related independent components. Finally we employed the Event-Related Spectral Perturbation (ERSP) technology on the fake-epochs in order to determine the EEG dynamics during motion sickness. The experimental results show that most subjects experienced an 8-10 Hz power increase to their motion sickness-related phenomena in the parietal and motor areas. Moreover, some subjects experienced an EEG power increase of 18-20 Hz in
their synchronized responses recorded in the same areas. The
motion sickness-related effects and regions can be successfully obtained from our experimental results.
I. INTRODUCTION
otion sickness can occur in various situations, especially when humans are exposed to real or apparent motion stimuli. The types of sickness are usually defined in relation to their related vehicles or situations, such as car sickness, sea sickness, air sickness and space sickness. Motion sickness can be induced by a number of symptoms including eye strain, headache, pallor, sweating, vertigo, ataxia, nausea, and vomiting. A study by R. S. Kellog et al. [1] describes that
Manuscript received April 16, 2007. This work was supported in part by the Brain Research Center, National Chiao-Tung University (NCTU), Hsinchu, Taiwan.
C.-T. Lin is with the Department of Electrical and Control Engineering, the Department of Computer Science, and the Brain Research Center, National Chiao-Tung University (NCTU), Hsinchu 300, Taiwan, R.O.C. (e-mail: ctlin@mail.nctu.edu.tw).
S.-W. Chuang is with the Department of Computer Science, and the Brain Research Center, National Chiao-Tung University (NCTU), Hsinchu 300, Taiwan, R.O.C. (e-mail: swchuang@csie.nctu.edu.tw).
Y.-C. Chen, and L.-W. Ko are with the Department of Electrical and Control Engineering and the Brain Research Center, National Chiao-Tung University (NCTU), Hsinchu 300, Taiwan, R.O.C. (e-mail: mandychen.ece92g@nctu.edu.tw, lwko@mail.nctu.edu.tw).
S.-F. Liang is with the Department of Computer Science and Information Engineering, National Cheng Kung University, Tainan 701, Taiwan, R.O.C., and also with the Brain Research Center, NCTU, Hsinchu 300, Taiwan, R.O.C. (e-mail: sfliang@mail2000.com.tw).
T.-P. Jung is with the Institute for Neural Computation, University of California, San Diego, CA 92037 USA, and also with the Department of Computer Science and the Brain Research Center, National Chiao-Tung University (NCTU), Hsinchu 300, Taiwan, R.O.C. (e-mail: jung@sccn.ucsd.edu).
the malaise of all motion-related sicknesses may last more than one hour, and D. W. Gower et al. [2] further proved that the duration of the sickness can even last for one day. Many previous studies [3] have indicated that the malaise of sickness can sometimes induce a decline in the speed of thought and response time. Thus, there have been numerous attempts [4-6] made by scholars to understand motion sickness and its symptoms. Among these motion sickness studies, various methods have been employed to induce motion sickness, such as a rotary chair [7], a circular vection drum [8] and an off-axis yaw oscillator [9]. Other studies [10-12] have used VR scenes to visually induce a sickness that is not the effect of movement and, therefore, it can only be regarded as an imitation of motion sickness. This kind of sickness is called cyber-sickness because it is the result of conflict between the vestibular and visual organs. Hence, in this study, we have used a Virtual Reality (VR)-based 3D environment to imitate a real-world situation.. We put a car on a motion platform to mimic realistic motion stimuli and surrounded it with 3D VR scenes: an unprecedented combination in studies of this kind. Subjects were asked to sit in the car to receive the 3D VR scenes. It was found that these scenes were sufficient to induce motion sickness symptoms almost identical to real motion sickness. The electroencephalogram (EEG) dynamics are then observed in the motion sickness subjects in the experiments.
The paper is organized as follows. The experimental setup is given in section II. The analysis procedures are given in Section III. Section IV describes the analysis EEG results corresponding to motion sickness. The discussions of experimental results are summarized in Section V. Finally, the conclusions are given in the closing section.
II. EXPERIMENTAL SETUP A. Virtual-Reality-based Dynamic 3D Environment
Some previous works indicated that the malaise of motion sickness can cause self-control ability decline and lead to serious traffic accident fatalities [13]. For the purpose of safety, a VR-based dynamic 3D environment was developed for the motion sickness experiments. In the 3D environment, the VR scene combined with the Stewart dynamic motion platform can provide the realistic kinesthetic stimuli to the subjects. The developed VR-based 3D dynamic system mainly consists of three elements: (1) a six-degree-of-freedom motion platform; (2) a real car; and (3) a 360-degree 3D VR scene consisting seven projectors. The movements of the platform are according to the car dynamics and the condition of the road surface. The 360-degree VR-based dynamic 3D environment is shown in Fig. 1.
EEG Effects of Motion Sickness Induced in a Dynamic Virtual
Reality Environment
Chin-Teng Lin, Fellow, IEEE, Shang-Wen Chuang, Yu-Chieh Chen, Li-Wei Ko, Sheng-Fu Liang, and Tzyy-Ping Jung
M
Proceedings of the 29th Annual International Conference of the IEEE EMBS
Cité Internationale, Lyon, France August 23-26, 2007.
FrD02.4
Fig. 1. The 360-degree VR-based dynamic 3D environment. B. Protocol of the Experiment
A three-stage experimental protocol is designed for this study. Before each experiment, a 10-minute practice session was hold to ensure the subjects are used to the environment. After the practice session, subjects were asked to wear an EEG electrode cap and then begin the first stage of the experimental protocol, a 10-minute straight road, which is called “the Baseline Stage”. Next, “the Motion Sickness Stage”, which consists of a 40-minute consecutive-curve road, is aimed to induce motion sickness, and the final stage is a 15-minute straight road for rest. The experimental scheme is shown in Fig. 2.
Fig. 2. Protocol of the designed virtual reality scene to induce motion sickness.
The famous motion sickness questionnaire (MSQ) developed by Kennedy et al. [14] in 1993 is a commonly used MSQ in the studies of the related research field. In this study, we also designed a motion sickness questionnaire (MSQ) according to the reference for subjective evaluation of motion sickness. Our MSQ composes of 10 items, and each of which has six score levels (0-‘not at all’, 5-‘very much’). The total motion sickness score was the aggregate score of the 10 items. The full range of total motion sickness score was hence within 0-50 points.
C. Subjects
A total of nine healthy volunteers (including five males and four females) with no history of gastrointestinal, cardiovascular, or vestibular disorders, no drug or alcohol abuse, and no current medication, and had normal or corrected-to-normal vision participated in the experiments of the motion sickness study. The ages of these subjects are from 18 to 26 years-old with an average of 22. Each subject was instructed to sit relax in the car and pay attention to the VR scene to ensure the inducement of motion sickness. All subjects were informed about the scope and design of the study and gave their written consent for participation.
D. EEG recording
A 32-channel Neuroscan Nuamps system was used to record the EEG dynamic in this study. Silver chloride electrodes will be mounted inside a cap, and the locations of the electrodes will be determined using the International 10-20 Electrode Placement System. The impedances on all electrodes should be less than 5 KΩ. The sampling rate of the EEG data was 500 Hz. The EEG data recorded in the experimental period were used for further analysis.
III. ANALYSIS PROCEDURE
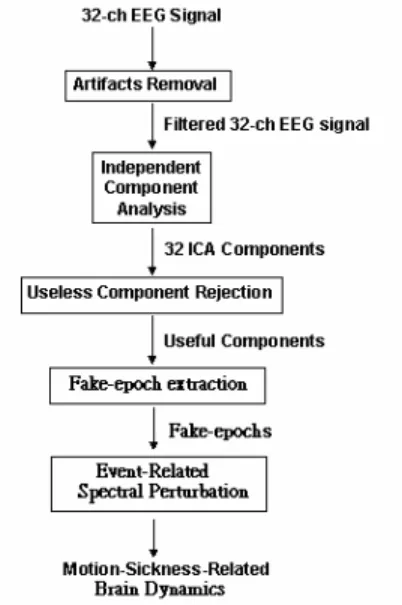
Flowchart of the EEG signal processing procedure is show in Fig. 3. It consists of artifacts removal, independent component analysis, useless component rejection, fake-epoch extraction, and event-related spectral perturbation (ERSP).
Fig. 3. Flowchart of the EEG signal analysis procedure.
A 500-pt high pass filter with a cut-off frequency at 1 Hz is used to remove breathing artifacts, and the DC drifts. The width of the transition band of the high pass filter is 0.2 Hz. A 30-pt low pass filter is then applied to the signal with the cut-off frequency at 50 Hz to remove muscle artifacts and line noise. The transition band width of the low pass filter is 7 Hz. The independent component analysis (ICA) is applied to the filtered EEG signals to obtain the independent components. Some artifacts can be rejected in the process of useless components rejection. The effectiveness of eye blinking and other artifacts removal by using ICA had been demonstrated in the Jung et al.’s study [15]. Then we employed the ERSP technology, which can measures average dynamic changes in amplitude of the broad band EEG frequency spectrum as a function of time relative to an experimental event [16], on the fake epochs of useful components to calculate their frequency response. Start Baseline (10-min) Motion sickness (40-min) Rest (15-min) Motion Sickness Questionnaire 3873
A. Independent Component Analysis
The first application of ICA to biomedical time series analysis was presented by Makeig et al. [17]. This report showed segregation of eye movements from brain EEG phenomena, and separation of EEG data into constituent components defined by spatial stability and temporal independence. Subsequent technical reports by Ghahremani, Makeig, and Jung et al. [18-21] demonstrated that ICA could also be used to remove artifacts from continuous or event-related (single-trial) EEG data prior to averaging. In our experiment, we used the infomax ICA to separate N sources from N EEG channels. The conduction of the EEG sensors is assumed to be instantaneous and linear such that the measured mixing signals are linear and the propagation delays are negligible. We also assume that the signal sources of muscle activity, eye, and, cardiac signals are not time locked to the sources of EEG activity which is regarded as reflecting synaptic activity of cortical neurons. Therefore, the time courses of the sources are assumed to be independent. The task of the infomax ICA algorithm is to recover a version, of the original sources S by finding a square matrix W that inverts the mixing process linearly and save the identical scale and permutation [21]. For EEG analysis, the rows of the input matrix X are the EEG signals recorded at different electrodes, the rows of the output data matrix U = WX are time courses of activation of the ICA components, and the columns of the inverse matrix W-1 give the projection strengths of the
respective components onto the scalp sensors. The scalp topographies of the components provide information about the location of the sources (e.g., eye activity should project mainly to frontal sites, and the visual event-related potential is on the center to posterior area, etc.). Discarding the sources of muscle activity, eye movement, eye blinking, and single electrode noises, we obtained useful components to do fake-epochs extraction and ERSP analysis.
B. Fake-epochs extraction for ERSP analysis
Since "epoch" is a parameter of ERSP analysis, fake-epoch extraction was applied after useful ICA components were found. Five of 2-min periods of signal were cut from useful ICA component signals according to Fig. 4. The period A was the last two minutes of the Baseline Stage. And the period B and C were cut from the first and last two minutes of the Motion Sickness Stage, respectively. We regarded the first two minutes of the Rest Stage as the period D, and the period E was cut from the last two minutes the whole experiment. Each period was equally divided into 100 epochs and then rearranged to form 100 fake epochs (6 second each) for further analysis. ERSP technology [16] was applied to all fake epochs, and the power spectrum density of each fake epoch was calculated. We took the power spectrum density of period A as the baseline power of each fake epoch, and baseline power was removed to acquire the difference. Then we can observe the sickness-related phenomenon after averaging all fake-epochs.
Fig.4. Fake epochs extraction for ERSP analysis
IV. EXPERIMENTAL RESULTS
Each subject reported their sickness level is above to the score of 3, and the average score of all subjects is 3.8. The MSQ demonstrates that the VR-based dynamic 3D environment is successful in inducing motion sickness. The figures shown in Fig. 5(a) and 5(b) are the ERSP results of two different subjects. The nausea-related ICA components of the two subjects are in the parietal area with clear frequency response in 8~10 Hz when the subjects are sick, as shown in Fig.5 (b). The EEG power of some subjects even had a synchronized response in 18~20 Hz. This sickness-related phenomenon is observed in parietal area and sometimes in motor area. In Fig.5 (b), there is a power-suppression from section A to section B (from straight road to curve), which indicate a Mu-blocking occurred when the subject sense the movement of the motion platform. In section C, the Mu-blocking disappear and the power increase when the subjects got motion sickness.
Fig.5. Sickness-related ICA components and their spectral analysis results. Star t A B C D E 1 0 … 1 0 … 1 0 … 1 0 … 1 0 …
…
Fake epochs 100 fake epochs 2 mins 100 epochs, 1.2 sec each (a) (b) A B C D E A B C D E 3874V. DISCUSSION
The EEG dynamics which relate to motion sickness are studied in this paper with using a virtual-reality based dynamic 3D environment. A VR-based dynamic 3D environment with the proposed experimental design can successfully induce real motion sickness with syndromes similar to those found in a real world situation. The individual responses to the MSQ were used as the index and they show that all the subjects experienced motion sickness which was induced physiologically and realistically. The recorded EEG data were analyzed with the ICA algorithm, fake-epoch extraction, and ERSP technology. The experimental results show that the motion sickness-related phenomena in the parietal and motor areas with an 8-10 Hz power increase. Moreover, the EEG power of some subjects had a synchronized response increase of 18-20 Hz. The significant power increase in those specific frequency bands of ICA components has been suggested to be a common phenomenon during motion sickness. In addition, the EEG effects on some subjects even last during the Rest Stage. These results also indicate that the regions of the human cortex which are influenced by motion sickness are the parietal and motor areas. The parietal and the motor areas play important roles in integrating sensory information from various senses. It was thought originally that the EEG power of some subjects would gradually decrease in the Rest Stage. However, most of our subjects reported that their symptoms lasted for hours after the experiment.
VI. CONCLUSION
In this study, VR technology and motion platform are integrated to create a realistic environment. Subjects who were seated in a car received almost the same perceptions as those received in a real environment. Accordingly, our VR-based dynamic 3D environment can physiologically and realistically induce motion sickness, which is supposed to be the same symptom as what are induced in the real world. In our experimental results, Strong 8~10 Hz power increase are observed in parietal and motor areas of high-sickness-level subjects; even more, some subjects even had synchronized 18~20 Hz power increases in those areas. These results are almost the same real brain phenomena as those induced in the real environment. The true motion sickness-related effects and regions can be successfully obtained with our experimental results.
REFERENCES
[1] R. S. Kellog, et al., “Psychophysiological Effects of Training in a Full Vision Simulator”. Annual Scientific Meeting of the Aerospace Medical
Association, 1980.
[2] D. W. Gower and J. E. Fowlkes. “Simulator Sickness in the UH-60 (Black Hawk) Flight Simulator”, U.S. Army Aeromedical Research
Laboratory, September, 1989.
[3] Joseph J. LaViola, “A discussion of cybersickness in virtual environments,” ACM SIGCHI Bulletin, vol.32, no.1, 2000.
[4] S. Hu, K.A. McChesney, K.A. Player, A.M. Bahl, J.B. Buchanan, J.E. Scozzafava, “ Systematic investigation of physiological correlates of motion sickness induced by viewing an optokinetic rotating drum,”
Aviation, space, and environmental medicine, vol.70, no.8, pp.759-765,
1999.
[5] H. Wan, S. Hu and J. Wang, “Correlation of phasic and tonic skin-conductance responses with severity of motion sickness induced by viewing an optokinetic rotating drum, ” Perceptual and motor skills, vol.97, no.3, pp.1051-1057, 2003.
[6] Bob Cheung and Peter Vaitkus, “Perspectives of electrogastrography and motion sickness,” Brain research bulletin, vol.47, no.5, pp.421-431, 1998.
[7] T. Russomano, D.F.G. de Azevedo, L. Piedade, F.S. Glock, M. Tello, M.A. dos Santos, F.P. Falcao, J.L. Giongo, “Development and Validation of an Electrically Controlled Rotatory Chair to be Used as a Simulator for Spatial Disorientation and Motion Sickness,”
Proceedings of the 25th Annual International Conference of the IEEE Engineering in Medicine and Biology Society, 2003.
[8] M. J. Williamson, M. J. Thomas and R. M. Stern, “The contribution of expectations to motion sickness symptoms and gastric activity,”
Journal of Psychosomatic Research, vol.56, no.6, pp.721-726, 2004.
[9] S. J. Wood, “Human otolith-ocular reflexes during off-vertical axis rotation: effect of frequency on tilt-translation ambiguity and motion sickness,” Neuroscience Letters, vol.323, no.1, pp.41-44, 2002. [10] B.C. Min, S.C. Chung, Y.K. Min and K. Sakamoto,
“Psychophysiological evaluation of simulator sickness evoked by a graphic simulator,” Applied ergonomics, vol.35, no.6, pp.549-556, 2004.
[11] N. Sugita, M. Yoshizawa, A. Tanaka, K. Abe, T. Yambe, S. Nitta and S. Chiba, “Evaluation of the Effect of Visually-Induced Motion Sickness Based on Pulse Transmission Time and Heart Rate,” SICE 2004 Annual Conference, vol.3, pp.2473-2476, 2004.
[12] H. Ujike, T. Yokoi, S. Saida, “Effects of virtual body motion on visually-induced motion sickness,” 26th Annual International Conference of the Engineering in Medicine and Biology Society, pp.2399-2402, 2004.
[13] J. T. Reason and J. J. Brand, “Motion Sickness,” London: Academic press, 1975.
[14] Kennedy, et al., “Simulator Sickness Questionnaire: An Enhanced Method for Quantifying Simulator Sickness.”, International Journal of Aviation Psychology, 3, p.203-220, 1993.
[15] T.P. Jung, et al., ”Extended ICA removes artifacts from electroencephalographic recordings.”, Advances in Neural Information Processing System, 10, p.894-900, 1998.
[16] S. Makeig, “Auditory event-related dynamics of the EEG spectrum and effects of exposure to tones,” Electroencephalogr. Clin. Neurophysiol., 86: 283-93, 1993.
[17] S. Makeig and M. Inlow, “Lapses in Alertness: Coherence of Fluctuations in Performance and EEG Spectrum,” Electroencephalogy.
Clin. Neurophysiol., Vol. 86, pp. 23-35, 1993.
[18] T. P. Jung, S. Makeig, C. Humphries, T. W. Lee, M. J. McKeown, V. Iragui, T. J. Sejnowski, “Removing electroencephalographic artifacts by blind source separation,” Psychophysiology, Vol. 37, pp. 163-78, 2000.
[19] T. P. Jung, S. Makeig, W. Westerfield, J. Townsend, E. Courchesne, and T. J. Sejnowski, “Analysis and visulization of single-trial event-related potentials,” Human Brain Mapping, 14(3), pp. 166-85, 2001.
[20] M. Girolami, “An alternative perspective on adaptive independent component analysis,” Neural Computation, vol. 10, pp. 2103–2114, 1998.
[21] T. W. Lee, M. Girolami, and T. J. Sejnowski, “Independent component analysis using an extended infomax algorithm for mixed sub -Gaussian and super-Gaussian sources,” Neural Computation, vol. 11, pp. 606–633, 1999.