A Jointed Mode Detection and Symbol Detection Scheme
for DVB-T
Ting-Chen Wei, Wei-Chang Liu, and Shyh-Jye Jou
Abstract — This work proposes a jointed mode detection
and symbol detection scheme for DVB-T. To reduce hardware complexity, the division operation of normalized maximum correlation (NMC) is removed and the delay line which uses twisted memory access methodlowers the hardware cost. In addition, the proposed detection procedure does not need to refill or replenish the received data samples; as the result, the longest latency of the detection is only 17280 samples and is comparable with the parallel method. To lower the hardware cost, the memory is released for channel estimation after completing the Mode/GI detection and symbol detection. Total complexity of Mode/GI/symbol detection and channel estimation is about 200 Kgates (including memory).1
Index Terms — DVB-T, Mode Detection, OFDM, Symbol Detection
I. INTRODUCTION
The DVB-T was presented by ETSI in 1997 [1] to replace traditional analog TV broadcasting. DVB-T uses orthogonal frequency division multiplexing (OFDM) to provide the high data rate requirement for video broadcasting. The symbol length (Mode) and guard interval (GI) of OFDM in DVB-T can be adjustable in order to survive different channel conditions. The length of an OFDM symbol can be either 2048 (2K mode) or 8192 (8K mode) when considering different broadcasting distances or Doppler spreads. Four GI lengths, namely 1/32, 1/16, 1/8 and 1/4, are selected to conquer different inter symbol interference (ISI) effects due to multi-path phenomenon. However, DVB-T does not send preamble signals in time domain; therefore, the receiver requires the Mode/GI detection process before the location of an OFDM symbol is detected. For channel estimation and synchronization, the DVB-T inserts pilots in the frequency domain. This system has two types of pilot, namely continual pilots and scattered pilots. The number of scattered pilots is 172 in 2K mode and 568 in 8K mode. The ETSI presented the DVB-H [2] for handheld device, with a new 4K transmission mode in 2004. The proposed scheme also considers this new mode.
In general, the Mode/GI detection and symbol detection algorithms are correlation-based methods [3]-[5]. These operations need a delay line to store one OFDM symbol. The
1This work is supported by National Science Council and MediaTek of
Taiwan, R.O.C., under grant number NSC 95-2220-E-009-008.
T. C. Wei, W. C. Liu and S. S. Jou are with the Department of Electronics Engineering, National Chiao Tung University, Hsinchu City, Taiwan 300, and R.O.C.
longest symbol length in DVB-T is 8192. Therefore, the storage complexity is critical to its implementation. Besides, four different channel estimation algorithms [3], [6]-[8] which need to store scattered pilots of 3-8 OFDM symbols have been reported. To reduce implementation cost, this work presents an efficient memory usage architecture. The Mode/GI/symbol detection and channel estimation share the same memory bank. Furthermore, this work also presents a Mode/GI detecting scheme which sequentially detects the Mode/GI by using efficient memory access and data arrangement, thus lowering the detection latency.
The rest of this paper is organized as follows: In Section II, the overall baseband receiver architecture is introduced. Then, a jointed Mode/GI and symbol detection architecture is proposed in Section III. Section IV gives the design result with memory sharing. Section V is the conclusions. Finally, an appendix gives the details of channel estimation architecture.
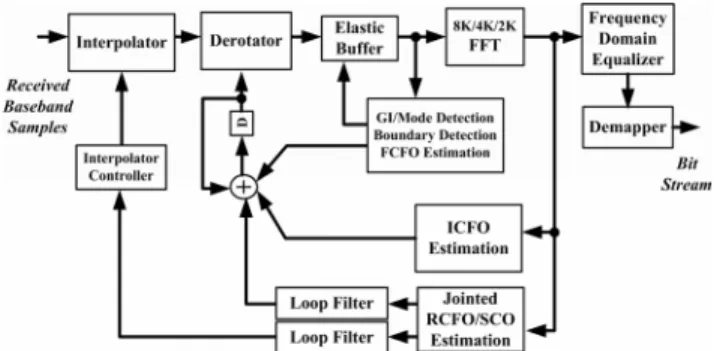
Fig. 1 DVB-T baseband receiver architecture
II. SYSTEM ARCHITECTURE
Fig.1 shows the proposed DVB-T baseband receiver architecture [9]. This receiver contains a timing synchronization loop, a carrier frequency synchronization loop, a 2K/4K/8K multi-modes FFT and a frequency domain channel equalizer. Timing synchronization is used to detect the symbol boundary and to compensate the sampling clock offset (SCO) caused by clock frequency mismatch between receiver and transmitter. SCO is compensated by a cubic interpolator [10] and an elastic buffer. Carrier frequency synchronization is used to compensates the carrier frequency offset (CFO) caused by carrier frequency mismatch between the transmitter and the receiver. In the OFDM system, the CFO is divided into two parts, namely integer and fractional. A three steps carrier frequency estimation [4] is used in the receiver. A coordinate rotation digital computer (CORDIC) based derotator [11] is used to compensate the estimated CFO.
Contributed Paper
The demodulation process in the proposed architecture has three steps. In the first step, the system begins to find transmission types of Mode/GI and detecting the boundary of an OFDM symbol. Then, the system goes to the second step. The major objective of this step is to identify the integer CFO (ICFO). Finally, in the last step, the system tracks the remainder CFO and SCO and performs channel estimation.
III. MODE/GIDETECTION AND SYMBOL DETECTION
A. Mode/GI Detection
The Mode/GI detection algorithm [5] adopts the cyclic prefix (CP) based correlation algorithm to identify the symbol mode. Equation (1) is a mode detection algorithm which is called the maximum correlation (MC) [4].
∑
− = − − × − = 1 32 0 *( ) ( ) ) ( Nsc i MC n r n i rn i Nsc x (1)where r(n) is the received signal, Nsc is the number of sub-carriers of tested symbol mode and Nsc/32 is the shortest guard interval length of tested symbol mode. The correlation result xMC(n) will form a peak or plateau if the tested mode
equals to the transmitted symbol mode. The simulation results of MC are shown in Fig.2 (a). However, defining the threshold and detecting the plateau are difficult due to glitches along sample index. Equation (2) is a modified form of (1) and is called the normalized maximum correlation (NMC).
∑
∑
− = − = − × − − − × − = 1 32 0 * 1 32 0 * ) ( ) ( ) ( ) ( ) ( Nsc i Nsc i NMC i n r i n r Nsc i n r i n r n x (2)The denominator denotes the power term integration of received signal r(n) and is employed to normalize the flat plateau to “1” as shown in Fig.2 (b). The symbol mode is detected after the first plateau and the GI is detected by calculating the plateau length. Unlike MC method, NMC method has more flat plateau and is easy to detect the GI length; however, the NMC method requires division operation. To reduce the division operation of NMC, the plateau threshold is defined as ‘Th’ as given by (3). Consequently, the
Mode/GI detection equation can be modified as shown in (4). A division operation is removed by moving the denominator to the right side and adopting a pre-determined threshold, Th.
Moreover, the square-root operation in the absolute operation of a complex number is also not required by squaring both sides. 0 1000 2000 3000 4000 5000 0 0.5 1 1.5 2 Am pl itude Sample Index 2K tested mode 4K/8K tested mode (a) 0 1000 2000 3000 4000 5000 0 0.2 0.4 0.6 0.8 1 A m plitu de Sample Index 2K tested mode 4K/8K tested mode (b) Fig. 2 (a) MC correlation results of 2K transmission modes. (b) NMC correlation results of 2K transmission modes
h NMC NMC plateau if xn T n x( ) ∈ ( ) ≥ (3) 0 ) ( ) ( ) ( ) ( ) ( 2 1 32 0 * 2 2 1 32 0 * − ⋅ − − − ×
∑
− ⋅ − ≥∑
− = − = Nsc i h Nsc i i n r i n r T N i n r i n r (4)Determine an accurate detection is important in reducing the detection error. Using low threshold, the non-plateau region will be regarded as a plateau region and it causes incorrect GI length detection. Using high threshold, glitches on the plateau will decrease the estimated plateau length and cause incorrect GI detection. Fig.3 (a) and Fig.3 (b) are GI detection error rate simulations results for 2k and 8k mode. In theses simulation results, the detection rate at 8K mode is better than that at 2K mode. This is because 8K mode has the longest symbol length. Except the case of 1/32 GI length, the detection error rate has similar behavior at the low and high threshold. In the case of 1/32 GI length, at low threshold, miscalculated plateau decreases the GI detection error rate. At high threshold, due to the decision boundary of 1/32 GI case, the decreased plateau length does not cause the detection error in these simulations.
For detection error rate to be lower than 0.01, the threshold is chosen to be 0.5. In 1/32 GI and 2K mode case, the performance is very close to 0.01. The multiplication operation in (4) can be replaced with displacement of wiring in the hard implementation.
(a)
(b)
Fig. 3 GI detection error rate vs. threshold under (a) 8K and (b) 2K transmission mode, AWGN level = 5dB and Rayleigh channel [1]
B. Symbol Boundary Detection Algorithm
Since a divider is replaced by a subtractor, the modified NMC can not generate exactly value for symbol boundary detection. Therefore, this work adopts the MC algorithm for symbol boundary detection. The algorithm shown in (5) are similar to the numerator of mode/GI detection function shown in (2) but with different integration lengths.
) ( ) ( max arg 1 0 * n i rn i Nsc r K g N i n est=
∑
− × − − − = (5) where Ng is the GI length.C. Proposed Mode/GI Detection and Symbol Detection Jointed Scheme
Because the Mode/GI detection and the symbol boundary detection are similar while the operation times are different, a single hardware for Mode/GI detection and symbol detection jointed scheme is proposed. Fig.4 illustrates the state diagrams of the proposed scheme.
Fig.4 State diagrams of Mode/GI and symbol detection
The procedure listed below describes the operation of the proposed scheme in detail.
1) Set tested_mode to 2K and fill the delay-line with 2K samples.
2) Fill the moving sum with tested_mode/32 samples. 3) Detect the tested mode for a period of (1+1/32) ×
tested_mode. If a peak or plateau occurs, jump to Step 4. Otherwise, jump to Step 2 and set the tested mode as tested_mode × 2.
4) Compute the plateau length and set detected GI length to moving sum length.
5) Fill the moving sum and then set the symbol boundary to the maximum correlation result.
6) Derive the next boundaries by using the detected mode, GI length and boundary information.
Fig.5 Architecture of the proposed detection scheme
D. Memory-based Delay Line
Fig.5 is the architecture of the proposed detection scheme. This architecture can estimate Mode/GI and symbol boundary and it requires three different length delay lines. The delay line can be implemented by using registers or memory. Because delay line has to write a new coming sample and to read an old sample simultaneously, a dual-port memory that performs read-write operations at different ports simultaneously can be selected in memory-based architecture. Table I presents the areas of different implementation methods. The length and width of each of these three methods is 8K and 12 bits respectively. The area of the shift registers method is three times larger than the memory methods. In
memory-based methods, a single large dual-port memory or a composition of several small single-port memories with interleaving access can fulfill the delay line operation requirement. Table I indicates that the area of an 8K dual port-port SRAM is larger than that of eight 1K single port-port SRAM. This is because a dual port memory cell is generally larger than a single port memory cell.
To share the storage elements with the channel estimation and to improve read-write ability, the 2K/4K/8K delay line in the proposed architecture comprises eight 1K SRAM blocks. The length and width of 1K SRAM block is 8K and 12 bits. To achieve efficient memory access, this work proposes a twisted memory access procedure. Fig.6 presents the operating of the access procedure. Only two of eight 1K SRAM are simultaneously active while the others are shut down to save power. By performing the read and write accesses in turn, the delay line can be realized by single port memory rather than dual port memory. The write operation uses entire 8K regardless of the tested mode. Therefore, the oldest possible signal in the delay line could be r(n-8K). The previous samples are still stored in the memory when detection mode is changed, eliminating the need of refill the delay line. Thus, the proposed twisted memory access method reduces the memory area by 33% according to Table I. Fig.5 shows the architecture of the proposed detection scheme. The 2K/4K/8K delay line is composed of eight 1K SRAM blocks. The upper Moving Sum delay-line is composed of four 1K SRAM blocks and the under Moving Sum delay-line is composed of two 1K SRAM blocks. These three delay-lines are realized with proposed twisted memory access.
TABLE I
THREE IMPLEMENTATION METHODS OF DELAY LINE AND AREA COST 0.18m Process Shift Register ( W/O Wire) 8K Dual Port SRAM 8 × 1K Single
Port SRAM
Area 5.56 mm × mm 1.56 mm × mm 1.04 mm × mm
Fig.6 R/W Operation of twisted memory access
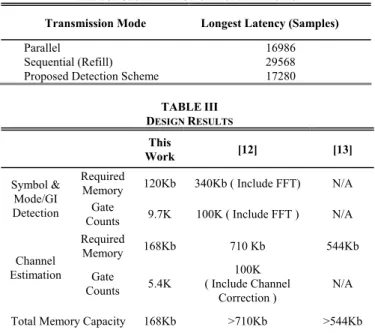
Fig.7 illustrates the mode detection timing of the parallel, sequential and proposed detection schemes. As shown in Fig.7 (e), r(n-4K)/r(n-8K) is already stored by twisted memory access for the 4K/8K mode detection. Therefore, the proposed scheme does not need to refill or replenish the Nsc delay-line. Table II lists the longest latency requirements of the proposed scheme, parallel and sequential mode detection schemes. The proposed scheme is at most 5% percent (384 samples) slower than the parallel detection scheme. However, the required
multiply-accumulates (MAC) hardware of the proposed detection scheme is one-third of the parallel scheme.
Fig.7 Mode detection time of (a) parallel detection of 2K (b) parallel detection of 4K (c) parallel detection of 8K, (d) sequential detection and (e) proposed detection scheme
TABLE II
THE LONGEST LATENCY OF MODE DETECTION Transmission Mode Longest Latency (Samples)
Parallel 16986 Sequential (Refill) 29568 Proposed Detection Scheme 17280
TABLE III DESIGN RESULTS
This
Work [12] [13]
Required
Memory 120Kb 340Kb ( Include FFT) N/A Symbol &
Mode/GI
Detection Gate
Counts 9.7K 100K ( Include FFT ) N/A Required Memory 168Kb 710 Kb 544Kb Channel Estimation Gate Counts 5.4K 100K ( Include Channel Correction ) N/A Total Memory Capacity 168Kb >710Kb >544Kb
IV. MEMORY SHARING WITH CHANNEL ESTIMATION The other critical implementation factor of DVB-T baseband receiver is the memory usage of channel estimation. This work adopts the 2-D predictive channel estimation [6]. The detail principles and algorithms are shown in Appendix. To reduce the memory cost, the Mode/GI detection, symbol detection and channel estimation share the same memory bank. In summary, the system has fourteen 1K SRAM blocks. Mode/GI/symbol detection and channel estimation share these fourteen 1K SRAM blocks. A summary of this work and comparison are listed in Table III. The gate counts of [12] include some other modules, such as fast Fourier transform (FFT) and channel correction modulation. The reported lecture [13] is a complete design of DVB-T, but it does not provide detailed design result for each block. According to Table III, the total required memory of the proposed design is 168 Kbits, while that of [12] is at least 710 Kbits (the data of symbol boundary detection includes FFT memory, so are not included) and that of [13] is at least 544 Kbits. The proposed design achieves Mode/GI/symbol detection and channel
estimation with memory sharing and reduces the required memory by a factor of at least 3.23 times.
V. CONCLUSION
This work proposes a modified division free NMC algorithm for Mode/GI detection. Under detection error rate and implementation consideration, 0.5 is chosen as threshold for the proposed scheme in Mode/GI detection. Besides, the latency of detection time of the proposed detection scheme with proposed twisted memory access method is comparable with that of the parallel method and the proposed scheme only requires one third of the MAC hardware. Furthermore, Mode/GI, symbol boundary detection and channel estimation share the same memory bank to reduce the hardware cost, and have a total memory requirement of only 168 Kbits. Finally, the total hardware complexity is approximately 200 Kgates (including memory) for the Mode/GI/symbol detection and channel estimation.
APPENDIX CHANNEL ESTIMATION
Equation (6) shows the basic concept of channel estimation for an OFDM system.
) ( ) , ( ) , ( exp m SP m n SP m n CR rec SP = (6) where n is the symbol index, m is subcarrier index, CRSP(n,m)
is the channel response of scattered pilots, SPrec(n,m) is the
received scattered pilot, and SPexp(n,m) is the expected
scattered pilot.
The DVB-T receiver estimates the channel response by using pilots in the frequency domain of the transmitted data. Fig.8 shows the pilot arrangement of DVB-T. Most channel estimation algorithms [3], [6]-[8] adopts scattered pilots. Because the location of the scattered pilots repeats every four OFDM symbols, the receiver must do scattered pilots synchronization [14] before starting channel estimation. Precise channel estimation needs to use the scattered pilots of several OFDM symbols, and to interpolate the channel responses for data subcarriers. In the proposed receiver, the channel estimation and symbol detection share the same memory bank to reduce hardware complexity.
Fig.8 Pilot arrangement of DVB and 2-D predictive channel estimation
The baseband receiver in the proposed architecture adopts the 2-D predictive channel estimation [6]. Equation (7) shows the mathematical description of time domain extrapolation and (8) shows the mathematical description of frequency domain interpolation. 0 , | mod ) 12 ) 4 mod ( ( 4 1 ) 9 , 5 ( 5 ) 9 , 1 ( ) 9 , ( 4 2 ) 6 , 6 ( 6 ) 6 , 2 ( ) 6 , ( 4 3 ) 3 , 7 ( 7 ) 3 , 3 ( ) 3 , ( ) , ( ) , ( max min+ + ∈ > = × + − − × + − = + × + − − × + − = + × + − − × + − = + = p Z p k p n k k k n CR k n CR k n CR k n CR k n CR k n CR k n CR k n CR k n CR k n CR k n CR SP SP SP SP SP SP SP (7) ) , ( ) , ( 3 2 ) 3 , ( 1 )) 1 ( 3 , ( ) 2 ) 1 ( 3 , ( 3 1 ) 3 , ( 2 )) 1 ( 3 , ( ) 1 ) 1 ( 3 , ( m n CR m n CR k n CR k n CR k n CR k n CR k n CR k n CR = × × − × − × = + − × × × − × − × = + − × (8)
where CR(n,m) is the channel response at symbol n and subcarrier m.
The 2-D Predictive channel estimation algorithm adopts time domain extrapolation. It uses two scattered pilots before the current one and performs extrapolation to predict the channel response of the current symbol as shown in Fig.8. The benefit of this algorithm is that it only stores the scattered pilots and does not store the data subcarriers; therefore, this algorithm saves large memory.
In (6), the value of the expected scatter pilots is generated by Pseudo-Random-Binary-Sequence (PRBS), and is multiplied by a boosted power gain (4/3). To reduce the division operation in (6), this gain is moved into demapper. Then, division operation in (6) can be modified with changing the sign of received scattered pilots. Equation (7) is modified by decomposing the scale number; hence, the multiplications are replaced with shifting, addition or subtraction. Besides, the constant denominator in the (7) is moved into demapper. Furthermore, the addition or subtraction operation can be implemented by using Carry Save Adder (CSA) followed by Carry Propagation Adder (CPA) to lower the area cost. Similarly, equation (8) is modified in the similar way.
Fig.9 shows the hardware architecture of the time domain extrapolation. The Multiplexes (MUXs) control the composition of scale number. The power of two multiplications can be realized by shifting of connections. Four numbers are summated by using CSA and CPA after multiplying the scale number. Fig.10 shows the hardware architecture of the frequency domain interpolation [6] [13]. The two delay units are used to store input data temporarily.
Fig.9 Time domain extrapolation
Fig.10 Frequency domain interpolation
Memory access in the channel estimation is different from that in Mode/GI/symbol detection scheme. Fig.11 shows the channel estimation architecture modified form [6] [13]. This architecture includes seven SRAM blocks, M1, M2…and M7 which separately store scatted pilots of symbols (n-7), (n-6)…
(n-1). M1~M7 are each composed of two 1K SRAM blocks.
The scatter pilots of previous seven symbols are already stored into SRAM blocks when channel estimation is performing at symbol (n). Newly arrived scatter pilots of symbol (n) are stored into SRAM block M1, and that of symbol (n+1) are stored into SRAM block M2, and so on. To prevent simultaneous read/write operations or overwriting of the required data, the stored scattered pilots of the previous seven symbols are read every 12 cycles into data-holding registers as shown in Fig.11. Within these 12 cycles, only one SRAM block is used to store the newly arrived scatted pilots, and the other memory blocks are shut down for power saving.
Fig.11 Channel estimation architecture
REFERENCES
[1] ETSI, “Digital Video Broadcasting: Framing Structure, Channel Coding and Modulation for Digital Terrestrial Television, European
Telecommunication Standard EN 300 744 V1.5, Nov. 2004.
[2] ETSI, “Transmission System for Handheld Terminals (DVB-H),”
European Telecommunication Standard EN 302 304 V1.1.1 Nov.
2004.
[3] M. Speth, S. A. Fechtel, G. Fock and H. Meyr, “Optimum receiver design for wireless broadband systems using OFDM Part I ,” IEEE
Trans. Commun., vol. 47, no. 11, pp. 1668-1677, Nov. 1999.
[4] M. Speth, S. Fechtel, G. Fock and H. Meyr, “Optimum receiver design for OFDM-Based broadband transmission Part II: A case study,” IEEE
Trans. Commun., vol. 49, no. 4, pp. 571-578, Apr. 2001.
[5] S. Chen, W. He, H. Chen and Y. Lee, “Mode detection, synchronization, and channel estimation for DVB-T OFDM receiver,” in Proc. IEEE GLOBECOM 2003, vol. 5, Dec. 2003, pp.2416-2420. [6] T. A. Lin, C. Y. Lee, “Predictive equalizer design for DVB-T system,”
in Proc. IEEE ISCAS 2005, vol.2, May 2005, pp. 940-943.
[7] F. Eory, “Comparison of adaptive equalization methods for the ATSC and DVB-T digital television broadcast systems,” in Proc. IEEE
ICCDCS, Mar. 2000, pp. T107/1-T107/7.
[8] P. Combelles, C. D. Toso, D. Hepper, D. Le Goff, J.J. Ma, P. Robertson, F. Scalise, D. Soyer and M. Zamboni, “A receiver architecture conforming to the OFDM based digital video broadcasting standard for terrestrial transmission (DVB-T),” in Proc. IEEE ICC, vol. 2, Jun. 1998, pp. 780-785.
[9] T. Z. Wei, S. J. Jou and M. T. Shieu, “Memory reduction ICFO estimation architecture for DVB-T,” in Proc. ISCAS 2006, May 2006, pp.3406 -3409.
[10] F. M. Gardner, “Interpolation in digital modems. I. Fundamentals,”
IEEE Trans. Commun., vol. 41, no.l2, pp. 501-507, Mar. 1993.
[11] Y. Ahn, S. Nahm and W. Sung, “VLSI design of a CORDIC-based derotator,” in Proc. IEEE ISCAS 1998, vol. 2, May 1998, pp. 449-452. [12] C. D. Toso, P. Combelles, J. Galbrun, L. Lauer, P. Penard, P.
Robertson, F. Scalise, P. Senn, and L. Soyer, “0.5 um CMOS circuits for demodulation and decoding of an OFDM-based digital TV signal conforming to the European DVB-T standard,” IEEE JSSC, vol. 33, no. 11, pp. 1781-1792, Nov. 1998.
[13] L. F. Chen, Y. Chen, L. C. Chien, Y. H. Ma, C. H. Lee, Y. W. Lin, C. C. Lin, H. Yu. Liu, T. Y. Hsu and C. Y. Lee, “A 1.8V 250mW COFDM baseband receiver for DVB-T/H applications,” in Proc. IEEE
ISSCC 2006, Feb. 2006, pp. 1002-1011.
[14] L. Schwoerer, “Fast pilot synchronization schemes for DVB-H,” in
Proc. IASTED, July 2004, pp. 420-424.
Ting-Chen Wei received the BS in electrical engineering
from the National Central University at Taiwan in 2003 and the MS in electrical engineering from National Central University in 2005. He is currently a PhD candidate in the department of electronics engineering at National Chiao Tung University.
Wei-Chang Liu received the BS in electrical engineering
from the National Central University at Taiwan in 2004 and the MS in electronics engineering from National Chiao Tung University in 2006. He is currently an assistant researcher fellow in the Department of electronics l engineering at National Chiao Tung University.
Shyh-Jye Jou was born in Taiwan, in 1960. He received
his B. S. degree in Electrical Engineering from National Chen Kung University in 1982, and M. S. and Ph.D. degrees in Electronics from National Chiao Tung University in 1984 and 1988, respectively. He joined Electrical Engineering Department of National Central University, Chung-Li, Taiwan, from 1990 to 2004 and became a Professor in 1997. He was a visiting research Associate Professor in the Coordinated Science Laboratory at University of Illinois, Urbana-Champaign during 1993-1994 academic years. In the summer of 2001, he was a visiting research consultant in the Communication Circuits and Systems Research Laboratory of Agere Systems, USA. He is currently a professor and chairman of the Department of electronics engineering at National Chiao Tung University.
![Fig. 3 GI detection error rate vs. threshold under (a) 8K and (b) 2K transmission mode, AWGN level = 5dB and Rayleigh channel [1]](https://thumb-ap.123doks.com/thumbv2/9libinfo/7659481.140269/3.918.464.843.99.313/detection-error-threshold-transmission-awgn-level-rayleigh-channel.webp)