This article was downloaded by: [National Chiao Tung University 國立交通大學] On: 28 April 2014, At: 01:31
Publisher: Taylor & Francis
Informa Ltd Registered in England and Wales Registered Number: 1072954 Registered office: Mortimer House, 37-41 Mortimer Street, London W1T 3JH, UK
Communications in Statistics - Theory and Methods
Publication details, including instructions for authors and subscription information: http://www.tandfonline.com/loi/lsta20Estimating capability index c
pk
for processes with
asymmetric tolerances
W. L. Pearn a & G. H. Lin b a
Department of Industrial Engineering & Management , National Chiao Tung University , Hsinchu, Taiwan, ROC
b
Department of Telecommunication Engineering , National Penghu Institute of Technology , Penghu, Taiwan, ROC
Published online: 23 Jul 2008.
To cite this article: W. L. Pearn & G. H. Lin (2000) Estimating capability index cpk for processes with asymmetric tolerances, Communications in Statistics - Theory and Methods, 29:11, 2593-2604, DOI: 10.1080/03610920008832625 To link to this article: http://dx.doi.org/10.1080/03610920008832625
PLEASE SCROLL DOWN FOR ARTICLE
Taylor & Francis makes every effort to ensure the accuracy of all the information (the “Content”) contained in the publications on our platform. However, Taylor & Francis, our agents, and our licensors make no
representations or warranties whatsoever as to the accuracy, completeness, or suitability for any purpose of the Content. Any opinions and views expressed in this publication are the opinions and views of the authors, and are not the views of or endorsed by Taylor & Francis. The accuracy of the Content should not be relied upon and should be independently verified with primary sources of information. Taylor and Francis shall not be liable for any losses, actions, claims, proceedings, demands, costs, expenses, damages, and other liabilities whatsoever or howsoever caused arising directly or indirectly in connection with, in relation to or arising out of the use of the Content.
This article may be used for research, teaching, and private study purposes. Any substantial or systematic reproduction, redistribution, reselling, loan, sub-licensing, systematic supply, or distribution in any
form to anyone is expressly forbidden. Terms & Conditions of access and use can be found at http:// www.tandfonline.com/page/terms-and-conditions
COMMUN. STATIST.-THEORY METH., 29(1 I), 2593-2604 (2000)
ESTIMATING
CAPABILITY INDEX C,,
FOR PROCESSES
WITH
ASYMMETRIC TOLERANCES
W. L. Pearn
Department of Industrial Engineering & Management National Chiao Tung University
Hsinchu, Taiwan ROC G. H. Lin
Department of Teleconununication Engineering National Penghu Institute of Technology
Penghu, Taiwan ROC
Keywords:
process capability index; specification limit; process mean; process standard deviation.ABSTRACT
Pearn and Chen (1996) considered the process capability index C,,, and investigated the statistical properties of its natural estimator under various process
conditions. Their investigation, however, was restricted to processes with
symmetric tolerances. Recently, Pearn and Chen (1998) considered a
generalization of C,,, referred to as c i k , to cover processes with asymmetric tolerances. They investigated the statistical properties of the natural estimator of Cik
,
and obtained the exact formulae for the expected value and variance. In this paper, we consider a new estimator of c;,, assuming the knowledge onP(p 2 T) = p is available, where 0 5 p 2 1 , which can be obtained from historical information of a stable process. We obtain the exact distribution of the
Copyright O 2000 by Marcel Dekker, Inc.
2594 PEARN AND LIN new estimator assuming the process characteristic follows the normal distribution. We show that the new estimator is consistent, asymptotically unbiased, which converges to a mixture of two normal distributions. We also show that by adding suitable correction factors to the new estimator, we may obtain the UMVUE and the MLE of the generalization
cik
.
1. INTRODUCTION
Process capability indices C, and C,,,, have been widely used in the
manufacturing industry providing numerical measures on process potential and performance. Application examples include the manufacturing of semiconductor
products (Hoskins et al. (1988)), headtgimbals assembly for memory storage
systems (Rado (1989)), jet-turbine engine components (Hubele et a/. (1991)), flip- chips and chip-on-boards (Noguera and Nielson (1992)), rubber surrounds (Pearn and Kotz (1994)), wood products (Lyth and Rabiej (1995)), audio-speaker drivers (Chen and Pearn (1997)) electrolytic capacitors (Pearn and Chen (1997)) and many others. The two indices C, and C,, have been defined as the following (Kane (1 986)):
C, = USL - LSL
6s
where USL and LSL are the upper and the lower specification limits, p and o are the process mean and the process standard deviation. The natural estimators of the two indices can be expressed as:
-
USL-LSLC, =
6 s
-
where X = (C:=,X,) / n and S = {(n -
I)-IC''',(X,
-X)'J''~
are conventionalestimators of p and (3. We note that C,, can be rewritten as
PROCESS CAPABILITY INDEX Cpk 2595 Cpk ={d-b-m1}/3o, where d = ( U S L - L S L ) / 2 , and m = ( U S L + L S L ) / 2 .
Thus,
e,
andep,
may be expressed as:A d
-
I
-
{
i F ; m i h pC = - and Cpk =
-
3 s ' 3 s
Under normality assumption,
kp
is distributed as (n-1)'12Cp(X,!,), andn1l2lX-mllo is distributed as the folded normal distribution with parameter n " 2 1 p - m / / ~ . Thus,
tPh
is a convolution ofxi!,
and the folded normaldistributions (Peam et al. (1992)). If the knowledge on P(p 2 m) = p is
available, where 0 5 p 2 1 , Peam and Chen (1 996) proposed a Bayesian-like estimator which is more reliable (with smaller variance) than the natural estimator.
2.
Tl3X GENERALIZATION
c*,
The indices C, and Cpk are appropriate for processes with symmetric
tolerances, but have been shown to be inappropriate for processes with asymmetric tolerances. For processes with asymmetric tolerances, Peam and Chen (1998) considered a generalization of Cpk, referred to as c ; ~ , which is defined as :
where d' = min {d,, d,}, A' = max {d*(p
- T)/d,, d * ( ~
- p )/dl }, d, = USL- T,
and dl = T - LSL. Clearly, if T = m (symmetric case) then d' = d, A * = ( p
- m
1
and the generalization
cIpk
reduces to the original index Cpk. The factors d* andA* ensure that the generalization
c ; ~
obtain its maximal value at T (process is on-target in this case) regardless of whether the tolerances are symmetric or asymmetric.The natural estimator of
c',~
can be obtained by replacing p and o byX
and S as defined earlier. Thus the natural estimator can be expressed as the following, where
A'
= max {da(X -~)/d,, d * ( ~ -X
)/dl). Pearn and Chen (1 998)2596 PEARN AND L N
investigated the statistical properties of the natural estimator of C;k, and obtained the exact formulae for the expected value and variance.
3. A
NEW
ESTIMATOR OF CkIf the knowledge on P(p 2 T) = p is available, where
0
<
p 2 1 , then we consider the following new estimatore*,,
.
The knowledge on the probability P(p 2 T j = p may be obtained from historical information of a process that is demonstrably stable.where
x*
= max { ( X -~j~,,(p)d'/d,, ( 2 -T)I,,(p)d*/d, }, I,,(.) is the indicator function defined as I,,(p) = 1 if p EB*,
and I,,(p) = -1 if p E B*, withB*
= { p/
p 2 T } . In the following, we show that if the process characteristic follows the normal distribution N ( p , o') then the new estimatorC;,
is distributed as t,_, (6 ') , a non-central t distribution with n -1 degrees of freedom and non-centrality parameter 6 ' = 3 m i k .Theorem
1. If the process characteristic follows the normal distribution, then 3n1"Eik is distributed as t,-,(6 * ) , a non-central t distribution with n - 1 degrees of freedom and non-centrality parameter 6 * = 3 j n c i k .Proof:
Case 1 : If USL - T > T - LSL, then E',k ={d, -(X
-T) I,. (P) }/(3Sj,Case 2: If USL - T < T - LSL, then E * , k ={d,
-
(X
-T)
I ~ . (p) )1(3S),-*
s
"- -
1 Ps
" - p - 1 .P(X
- PY,. (p)Cpk--C =
--
=-
(3 pk 3s (3 30 30
Case 3: If USL - T = T - LSL, then CIpk reduces to Cpk ,
PROCESS CAPABILITY INDEX Cpk 2597
C I p k = {d -
(X
- m)IB. (p)}/(3S), andThus, for all three cases, and for all x E R ,
Under normality assumption, and S2 are mutually independent. Therefore,
Z = 3 n 1 i 2 ~ ~ a ~ / o and W = (n -1)s' l o 2 are also mutually independent, with Z distributed as ~ ( 6 * , I), a normal distribution with mean 6 * = 3 k ; k , and W distributed as
Xi_,
,
a chi-squared distribution with n - 1 degrees of freedom. Thus 3n1'2Eik = ZI is distributed as t,-I (6 * ),
a non-central t distribution with n - 1 degrees of freedom and non-centrality parameter 6 ' =3&ciL.
The r-th moment (about zero), therefore, is:
By setting r = 1, and r = 2 , we may obtain the expected value E(?;~), and the variance var(?;,),
2598 PEARN AND LIN
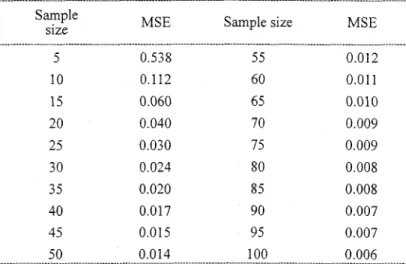
Table
1.Values
of MSE(E;,) for n = 5 ( 5 ) 100 withc;,
= 1. Samplesize MSE Sample size MSE
Therefore, the mean-squared error M S E ( ~ ; , ) can be obtained as:
It can be shown that the coefficient of E(C;~), bn-, = [2/(n - l)]li2 x T[ (n- 1),/2]/T[(n - 2)/2]< 1 for all n, which in fact converges to 1 as n approaches to infinity. Thus, the estimator
Eik
is biased, which over-estimates the actualvalue of C;, . Table 1 displays various values of MSE(~;,) for sample sizes n
= 5(5)100 under the condition of ~ i = k1. For sample size n
>
65, the mean-squared error is negligibly small (less than 0.01).
PROCESS CAPABILITY INDEX Cllk 2599
Theorem
2. If the process characteristic follows the normal distribution, then (a)eik
is asymptotically unbiased, (b)eik
is consistent.Proof
(a) By Stirling's formula, it is easy to show that b,-I converges to 1. Therefore, E(?;~) = cik/bn-] converges to Cik. Hence, the estimatorE',,
isasymptotically unbiased. (b) Since
X
converges to p in probability, and Sconverges to o in probability, then E i k must converges to
cik
in probability.Therefore, the estimator
Eik
is consistent.Theorem
3. If the process characteristic follows the normal distribution, then nIi2 (EiA - c ; ~ ) converges to the following in distribution:(a) p . N(0, [a;,12)
+
(1 - p) . N(0, [o;,J2), if USL - T > T - LSL ,(b) p . N(0, [o:,l2)
+
(1 - p).
N(0, [o:,]') , if USL - T <T
- LSL,
(c) p
.
N(0, [o:,~]~)+
(1-
p).
N(0, [oi212), if USL - T = T - LSL , whereProof:
See Appendix.Theorem
4. If the process characteristic follows the normal distribution, then (a) b,.,e6L is the UMVUE of c i k , (b)c , . ~ E ~ ~
is the MLE of Cik, whereb,_, =
r
[(n - 1)/2]{r
[(n -2)/2])-'[2/(n -I)]'/~,
and c,., = [d(n-
1)]'/*.
Proof:
(a) Since E[E& = ~ i ~ / b , - ~ , then b,.& is an unbiased estimator of c ; ~ . Since the unbiased estimator b,.,?; is based on the complete and sufficient statistics(x
S 2 ) only, then by Lehrnann-Scheffe's theorem, b,.,E',, is theUMVUE of
c',,
.
(b) We first note that the statistic
(x
[(n -l)/n]S2) is the MLE of@, 0 2 ) . By the invariance property of the MLE, c,.,EiA is the MLE of c i k , where c,., =[n/(n - 1)]1'2
.
2600 PEARN AND LIN Applying the Slutsky's theorem (Arnold (1990)), it is straightforward to
show that the UMVUE bn.,Eik, and the MLE c,.,Ei, both converge to the
mixture of two normal distributions as stated in Theorem 3.
4. CONCLUSIONS
Pearn and Chen (1998) proposed a generalization of C,k, referred to as Cik,
for processes with asymmetric tolerances. They investigated the statistical
properties of the natural estimator of c i k , and obtained the exact formulae for the expected value and variance. In this paper, we considered a new estimator of Cikr assuming the knowledge on P(p 2 T) = p is available, where 0
r
p 5 1 , which can be obtained from historical information of a stable process. We showed that under normality assumption the new estimator is distributed as t,_i(6 * ) , a non-central t distribution with n-
1 degrees of freedom and non- centrality parameter 6 * =3&cik.
We also showed that the new estimator is consistent, asymptotically unbiased, which converges to a mixture of two normal distributions. In addition, we showed that by adding suitable correction factorsto the new estimator, we may obtain the UMVUE and the MLE of the
generalization
c*,~
.APPENDIX
Theorem 3. If the process characteristic follows the normal distribution, then &(Eik - cBk) converges to the following in distribution:
(a) p.N(O, [ O ; , ] ' ) + ( ~ - ~ ) . N ( O , [u;,12),if U S L - T > T - L S L , (b) p,N(O, [ o l 1 l 2 )
+
(1 - p ) . ~ ( O , [o:,12), if USL - T < T - LSL ,(c) p .N(O, [oil]')
+
(1 -p) .N(O, [o:,l2), if USL - T = T - LSL , with1 1 d - ( p - m )
PROCESS CAPABILITY INDEX Cpk
Proof
(a) If USL - T > T - LSL,
thenp*
- d t - ( Z - ~ ), for p
>
T andE',,
= d,+
(TT-T)
pk - ,for p < T .
3 s 3 S
dl -(x-T)
(1) For . p > T
,
we define gll (x, y) =,
x
> T, y > 0 . Then, 3JS;&(Eik -
c;t)
= l/;;{gll(X, s*) - gtl(p, 02)} converges to N(O, [o;,12) in distribution. withd, + ( x - T )
(2) For p < T , we define g,,
(x,
y) = , x < T, y > 0 . Then, 3 f iZ/;;(Eik -
c ; ~ )
= I/f;{gi2(X, s*)-
gi2 (p, 0 *)) converges to N(0, [o;,12)in distribution, with
(3) For p = T
,
we have&(eiI.
-
c',~) = - l/;;(T(- p ) - dl&(s2 -0 2,3 s 30 ( 0 +S)S
Since
&(X
- p,s2
- 0 2 ) converges in distribution to (V, W),
a bivariate normal distribution N((0, 0), C),
with variance-covariance matrix2=[0' 0 2~~ 0 1 , a n d
/-l
3 s ' - 30(o+
S)S converges to(-
--,
1-
&)
2602 PEARN AND LM
in probability, then &(Cik - c ; ~ ) converges to Y, in distribution, where
1 d
Y, = --V -1 W is distributed as a normal distribution with mean
30 603
1 d
EY, = -- EV -
4
EW = 0 , and variance30 60'
Hence, if USL - T > T - LSL , then &(eik - c i k ) converges to ~ { p 2 T)
.
N(O; [o;,J2) -t ~ ( p < T). N(0, [0;,J2) in distribution, where(b) If USL - T < T - LSL , then
-.
d, -(X-T)-
d , + ( X - T )Cpk = , for p
r
T and C;, = .for p < T .3 s 3 s '
d u - ( x - T )
Applying the same technique used in (a) with g,, (x, y) = f o ~
3 h
d, + ( x - T ) 1 d
p > T , gU2(x,y)= for p < T , a n d Y, =--V-+W
3 5 30 60'
for p = T . Then, &(e',k - C;k) converges to N(0, [o:, J 2 ) and N(0, [ c / ~ J 2 ) in distribution for p 2 T and p < T respectively.
Therefore, if USL - T < T - LSL , then
A(?>
-c ; ~ )
converges to ~ ( p 2 T}.N(O, [ o t , l 2 ) + ~ { p < T}.N(O, [0:,J2) in distribution, where(c) If USL - T = T - LSL ( T = m in this case), then
PROCESS CAPABILITY INDEX CDk
- d - ( X - m )
-
d + ( X - m )pk -
,
for p 2 m and Cpk =,
for p < m3 s 3 s
d - ( x - m )
Applying the same technique used in (a) with g,, (x, y) = for
3 h
d + ( x - m ) 1 d
p > m , gm2(x,y)= for p < m , a n d
Y,,,
=--V--W3& 30 60' for p = m . Then, &(e;k - C i k ) converges to N(0, [0',,,12) and
N(0, [cY:,,]~) in distribution for p 2 m and p < m respectively.
Therefore, if USL - T = T - LSL
,
we have&(?ik
- c i k ) converges to P ( ~ > ~ ) . N ( O , [ o ; , , l 2 ) + ~ { p <m}.N(O, [0*,,12) indistribution, whereACKNOWLEDGEMENTS
The authors would like to thank the anonymous referees for their careful reading and helpful comments which improved the paper. The authors would also like to thank the editor Professor William Smith for his time and patience on editing the paper.
BIBLIOGRAPHY
Arnold, S. F. (1990). Mathematical Statistics. Prentice Hall.
Chen, K. S. and Pearn, W. L. (1997). An application of the non-normal process capability indices. Quality & Reliability Engineering International, 13,
355-360.
Hoskins, J., Stuart, B. and Taylor, J. (1988). A Motorola Commitment: A six sigma mandate. The Motorola Guide to Statistical Process Control for Continuous Improvement Towards Six Sigma Quality.
Hubele, N. F., Montgomery, D. C, and Chin, W. H. (1991). An application of statistical process control in jet-turbine engine component manufacturing.
Quality Engineering, 4(2), 197-21 0.
2604 PEARN AND LIN
Kane, V. E. (1986). Process capability indices. Journal of Quality Technology,
18(1), 41-52.
Lyth, D. M. and Rabiej, R. J. (1995). Critical variables in wood manufacturing's process capability: species, structure, and moisture content. Quality
Engineering, 8(2), 275-28 1.
Noguera, J. and Nielsen, T. (1992). Implementing six sigma for interconnect
technology. ASQC Quality Congress Transactions, Nashville, 538-544.
Pearn, W. L., Kotz, S. and Johnson, N. L. (1992). Distributional and inferential properties of process capability indices. Journal of Quality Technology, 24(4), 2 16-23 3.
Pearn, W. L. and Kotz, S. (1994). Application of Clements' method for
calculating second and third generation process capability indices for non-
normal Pearsonian populations. Quality Engineering, 7(1), 139-145.
Pearn, W. L. and Chen, K. S. (1996). A Bayesian-like estimator of C,, .
Comnzunications in Statistics: Simulation & Computation, 25(2), 321 -329.
Pearn, W. L. and Chen, K. S. (1997). Capability indices for non-normal
distributions with application in electrolytic capacitor manufacturing.
Microelectronics and Reliability, 37(12), 1853-1 858.
Pearn, W. L. and Chen, K. S. (1998). New generalization of the process
capability index C,,
.
Journal of Applied Statistics, 25(6), 801 -8 10.Rado, L. G. (1989). Enhance product development by using capability indexes.
Quality Progress, April, 22(4), 38-41.
Received May, 1998; Revised May, 2000.