Grid Computing,
Taiwan’s Perspectives
Simon C. Lin
ASGC, Academia Sinica
Taiwan
Induction: What are Grids and e-Science? –May 18th, 2004 -
2
Exponential Growth World
Gilder’s Law (32X in 4 yrs) Storage Law (16X in 4yrs) Moore’s Law (5X in 4yrs)
Triumph of Light – Scientific American. George Stix, January 2001
Performance per Dollar Spent
Optical Fibre
(bits per second)
Chip capacity
(# transistors)
Data Storage
(bits per sq. inch)
Number of Years
0 1 2 3 4 5 9 12 18
Doubling Time
"#$%#&'()**'+$,-)'./$,0)'/)$1#$23&0)4
!
! !
! !
!
"#$%! ! &''()*$+),-!
! ./0+#1!
2!'#%!34(,'0!
5676'
'
8)9)$:#,$'2#%)*,&;'
'
<=>?'
?@!AA'
566A'
'
B*)0C$#&,0'9C$D0CD$)'
'
E+F<'
5@?!A'
566?'
'
+#*G2)$'%G&32,09'
' 0*D9C)$'
5@AAA'
566H'
'
E23;)'3&3*G9,9'
'
0D9C#2'
5!I'
566I'
'
JD3&C'2#*)0D*3$'%G&'
' 0*D9C)$'
HHH'
566!'
'
<#2/'1*D,%'%G&32,09'
' 0*D9C)$'
?K7'
566L'
'
B*)0C$#&,0'9C$D0CD$)'
'
F"E'
5!6'
566K'
'
"$3:,C3C,#&'
' 0*D9C)$'
!L'
5667' ' JD3&C'0M$#2#%G&'
'
0D9C#2'
5?N!'
5666'
'
"$3:,C3C,#&'
'
0D9C#2'
LN6'
?AAA'
'
<#2/'1*D,%'%G&32,09'
' 0*D9C)$'
5N6'
?AA5'
'
FC$D0CD$3*'3&3*G9,9'
' 0*D9C)$'
AN?I'
'!"#$%"$&'$(%
")%*+,-./#&'%
.-%01%2'+$(%
4 !"#$$%&'()*+,-.&/0121314,5),67&819167&8*::1 !
"#$%#&'()**'+$,-)'#./012)3'4##$)53'617
!"#$%"$&'$(% ")%*+,-./#&'% .-%01%2'+$( !"#$"%&'""#( !"#$"%&)(** ++,(-.&'""#(// 89:8;<= <>:8?@@@4
“… A new age has dawned in
scientific and engineering
research, pushed by
continuing progress in
computing, information, and
communication technology,
and pulled by the expanding
complexity, scope and scale
of today’s challenges. The
capacity of this technology
has crossed thresholds that
now make possible a
comprehensive
cyberinfrastructure on which
to build new types of scientific
and engineering knowledge
environments and
organizations, and to pursue
research in new ways and
with increased efficacy…”
Water, water, everywhere,
nor any drop to drink
The Data Deluge
• A large novel:
1 Mbyte;
The Bible:
5 Mbytes
• A Mozart symphony (compressed):
10 Mbytes
• A digital mammogram:
100 Mbytes
• OED on CD:
500 Mbytes
• Digital movie (compressed):
10 Gbytes
• Annual production of refereed journal literature (∼20 k journals;
∼2 M articles):
1 Tbyte
• Library of Congress:
20 Tbytes
• The Internet Archive (10 B pages) (From 1996 to 2002):
100 Tbytes
• Annual production of information (print, film, optical & magnetic
media):
1500 to 3000 Pbytes
The LHC Data Challenge
•
Starting from this event
•
You are looking for this “signature”
Selectivity: 1 in 1013
Like looking for
1 person in a thousand world populations! Or for a needle in 20 million haystacks!
The Computing Needs will grow
•
It may grow to the scale of ExaBytes of
Data and PetaFlops Computing by 2015, in
particular, the luminosity will be enhanced
even in early stage
•
The largest commercial database currently
can only handle tens of TeraBytes
•
The fastest stand-alone computer now is
only capable of delivering 70 TeraFlops
Enabling Grids for E-sciencE
Tera → Peta Bytes
• RAM time to move
– 15 minutes
• 1Gb WAN move
time
– 10 hours ($1000)• Disk Cost
– 7 disks = $5000 (SCSI)• Disk Power
– 100 Watts• Disk Weight
– 5.6 Kg• Disk Footprint
– Inside machine• RAM time to move
– 2 months
• 1Gb WAN move
time
– 14 months ($1 million)• Disk Cost
– 6800 Disks + 490 units + 32 racks = $7 million• Disk Power
– 100 Kilowatts• Disk Weight
– 33 Tonnes• Disk Footprint
– 60 m2Academia Sinica, Taiwan
Enabling Grids for E-sciencE
INFSO-RI-508833 12
Mohammed & Mountains
•
Petabytes of Data cannot be moved
It stays where it is produced or curated
Hospitals, observatories, European Bioinformatics Institute, …
A few caches and a small proportion cached
•
Distributed collaborating communities
Expertise in curation, simulation & analysis
•
Distributed & diverse data collections
Discovery depends on insights
Unpredictable sophisticated application code
Tested by combining data from many sources Using novel sophisticated models & algorithms
•
What can you do?
– If the mountain won't come to Mohammed, Mohammed must go to the mountain
From Optimizing Architecture to
Optimizing Organisation
•
High-performance computing has
moved from being a problem of
optimizing the architecture
of an
individual supercomputer to one of
optimizing the organization
of large
numbers of ordinary computers
operating in parallel.
14
Simulated Time Can Get Rough
to ~20 attoliters (1 al = 10–18 l), and
near-field scanning optical microscopy (NSOM, panel D) (10), which allows attoliter detec-tion volumes. NSOM is best suited to cell-surface studies where scanning is important. Single-molecule detection in reduced de-tection volumes can also be achieved with stimulated emission depletion (STED, panel E) (11, 12). With this method, detection vol-umes have been reduced to 0.67 attoliters (11). The detection volume can be placed anywhere in solution, including inside a cell. However, use of STED with more than one color of fluorophore is difficult, and the STED beam is of high intensity.
Another possibility is the use of nanoflu-idic channels to restrict the movement of molecules to a width and depth smaller than
the confocal detection volume (panel F) (13). Molecules would not be near metal surfaces, and diffusion times would be longer because diffusion would be effec-tively one-dimensional. Finally, if super-resolution lenses can be made from materi-als with a negative index of refraction, they may in the future be used for single-mole-cule detection in small volumes (14).
All these methods have strengths in dif-ferent areas and are suitable for difdif-ferent ap-plications. The strength of the zero-mode waveguide of Levene et al. (6) is that it al-lows parallel detection of many single mole-cules while providing the smallest detection volumes of any method reported to date, en-abling single-molecule analysis of much weaker interactions than previously possible.
References
1. H. P. Lu, L. Xun, X. S. Xie,Science 282, 1877 (1998). 2. K. Adachi et al., Proc. Natl. Acad. Sci. U.S.A. 97, 7243
(2000).
3. A. A. Denizet al., Proc. Natl. Acad. Sci. U.S.A. 97, 5179 (2000).
4. B. Schuler, E. A. Lipman, W. A. Eaton,Nature 419, 743 (2002).
5. X. W. Zhuanget al., Science 288, 2048 (2000). 6. M. J. Levene et al., Science 299, 682 (2003).
7. C. Zander, J. Enderlein, R. A. Keller, Single Molecule Detection in Solution: Methods and Applications (Wiley-VCH, Berlin, 2002).
8. R. X. Bian, R. C. Dunn, X. S. Xie, P. T. Leung,Phys. Rev. Lett. 75, 4772 (1995).
9. T. E. Starr, N. L. Thompson,Biophys. J. 80, 1575 (2001). 10. F. de Lange et al., J. Cell Sci. 114, 4153 (2001).
11. T. A. Klar et al., Proc. Natl. Acad. Sci. U.S.A. 97, 8206 (2000).
12. M. Dyba, S. W. Hell, Phys. Rev. Lett. 88, 163901 (2002).
13. M. Foquet et al., Anal. Chem. 74, 1415 (2002). 14. J. B. Pendry, Phys. Rev. Lett. 85, 3966 (2000).
H
igh-performance com-puting has moved from being a problem of op-timizing the architecture of an individual supercomputer to one of optimizing the organi-zation of large numbers of or-dinary computers operating in parallel (1). This development has been made possible by rapid progress in microproces-sor, memory, and storage com-ponents.On page 677 of this issue, Korniss et al. (2) point out a key weakness of this ap-proach. Simulated time, the common parameter linking the many loosely coupled
ele-ments of a distributed simulation, can get rough. Just as the surfaces of crystalline materials grown by depositing individual atoms roughen (3), so does the temporal surface of a computation spread continu-ously as the modeled system evolves.
This roughening becomes a problem when measurements must be continuously extracted from the complex simulation. The solution proposed by Korniss et al. takes ad-vantage of a property found in the Internet: its “small world” nature of having occasional links between points that would otherwise be thought to be far apart. The authors show that intermittent synchronization over random distances can suppress temporal roughening.
The best evidence of the changing na-ture of high-performance computing comes from the regularly updated “TOP500” sur-vey of the world’s 500 biggest computing complexes (4). By 2002, clusters of conven-tional computers had come to make up 93% of the listed machines, with old-fashioned, vector-based supercomputers constituting the remaining 7%. Ten years ago, when the TOP500 surveys began, 27% of the listed systems used a conventional architecture, while 66% were specialized vector mach-ines. The remaining 7% were variations on the massively parallel Connection Machine (5), a now-extinct species.
For some computations, which are vast in extent but simple in organization, a new computing resource with lower costs is be-ing tapped. “Embarrassbe-ingly parallel” computations are increasingly computed at
the “edge of the network.” A computation is distributed to many cooperating worksta-tions, which perform their pieces of the work with little or no coordination as background tasks. They return the completed result to a cen-tral host, which checks the re-sults, assigns new tasks, and compiles the partial results. This approach has been used, for example, for factoring ex-tremely large numbers and for folding a protein. But the best known example is the SETI@home project (6), in which over 4 million users have analyzed data from a ra-dio telescope, seeking evi-dence of narrowband trans-missions at likely communica-tions frequencies. The work is done at the lowest possible pri-ority—it is a screen saver.
The SETI@home project estimates that the total cpu power of the thousands of users active on any given day is 13 teraflops, greater than the combined power of the world’s three biggest supercomputers, as listed in the 2001 TOP500 survey (4). However, the co-ordination involved in distributing and col-lecting all the work for the SETI@home project has consumed a significant fraction of the communications bandwidth to the outside world from the University of California’s Berkeley campus.
Efforts are under way to make approach-es like this applicable to a much wider class of tasks. The GRID consortium (7) of open-source developers is creating an infrastruc-ture that permits jobs to be submitted any-where within a “power grid” of reasonably reliable computer servers, under control mechanisms that will permit costs and re-sources to be allocated fairly. In the GRID
0 100 200 300 400 500 600 700 800 900 1000 0 100200 300400 500600 700800 9001000 490 495 500 505 510 515 520
Time steps completed
Processor
Processor
Out of sync. This simulated temporal surface was created by allowing 1000 x 1000 processing elements to proceed in equal time steps under local synchronization.
The author is in the Department of Computer Science and Engineering, Hebrew University, Jerusalem, 91904 Israel. E-mail: kirk@cs.huji.ac.il
P E R S P E C T I V E S
C O M P U T E R S C I E N C E
Rough Times Ahead
Scott Kirkpatrick
Paradigm Shift in SciComp
•
We are about to witness a paradigm
shift in Scientific Computing
•
Collaborative Data and Compute
intensive Research (e-Science) will be
everywhere
•
Infrastructure Development v.s.
traditional ad hoc HPC system
•
What are the challenges to
It’s about
Some Quotations
•
If I have been able to see further, it was
only because I stood on the shoulders of
giants.
--- Isaac Newton, Letter to Robert Hooke
•
The real problem has always been, in my
opinion,
getting people to collaborate on
a solution [for a common problem].
--- David Williams, from
“50 years of Computing at
CERN”
2nd EGEE Conference – Den Haag - 23rd November 2004
Enabling Grids for E-sciencE
INFSO-RI-508833 18
Why work together
•
Wonderful opportunity
–
Can do things that can’t be done alone – its more fun!
–
Recognising and Establishing e-Dreams
–
Combine our creativity, ingenuity and resources
•
Challenge so Hard – can’t “go it alone”
–
Building a broad user community is hard
–
Building e-Infrastructure is hard
–
Deploying e-Infrastructure is hard
–
Sustaining e-Infrastructure is very hard
•
Realising our potential
–
Multipurpose & Multidiscipline infrastructure
–
Amortise costs
–
International competition and collaboration
Enabling Grids for E-sciencE
“Rules of Engagement”
•
A foundation of Honesty
–
Admit what we don’t understand
–
Admit the limits of our software
–
Admit the limits of our support
•
Realism
–
Working together is worthwhile – so is competition – choose!
–
But they both take time to show a “profit” – persist
•
Openness and Mutual Respect
–
Stand shoulder-to-shoulder to meet challenges
–
Be prepared to adapt your ideas and plans
•
Commitment
–
Make strong / explicit commitments – or say “no”
Grid - its really about collaboration!
•
It’s about sharing
and building a
vision for the
future
– And it’s about getting
connected
•
It’s about the
democratization
of science
•
It takes advantage
of Open Source!
Success on a Worldwide scale
•
If we can bring together people from all over the
world (whether they be physicists, biologists,
computer scientists, climate researchers or ….) and
they
– Want to be part of building the “cyber infrastructure” or Grid environments or “e-science environments” for the future
– Actively participate
– Get benefit from the collaboration
Any Opportunity for
Small Countries?
LCG Service Hierarchy
Tier-0 – the accelerator centre
Data acquisition & initial processing Long-term data curation
Distribution of data Tier-1 centres
Canada – Triumf (Vancouver) France – IN2P3 (Lyon)
Germany – Forschunszentrum Karlsruhe Italy – CNAF (Bologna)
Netherlands Tier-1 (Amsterdam)
Nordic countries – distributed Tier-1
Spain – PIC (Barcelona)
Taiwan – Academia SInica (Taipei) UK – CLRC (Oxford)
US – FermiLab (Illinois) – Brookhaven (NY)
Tier-1 – “online” to the data
acquisition process high availability
Managed Mass Storage –
grid-enabled data service
Data-heavy analysis
National, regional support Tier-2 : ~120 centres (40-50 federations) in ~29 countries Simulation
October 7, 2005
LCG Status report Ian.Bird@cern.ch LHCC Open Meeting; 28th June 2006
24
LCG depends on 2 major science grid
The LCG service runs & relies on grid infrastructure
provided by:
EGEE - Enabling Grids for E-Science
Enabling Grids for E-sciencE
EGEE:
> 180 sites, 40 countries > 24,000 processors,
~ 5 PB storage
EGEE Grid Sites : Q1 2006
0 20 40 60 80 100 120 140 160 180 200 38078 38231 38384 38443 38596 38687 site s 0 5000 10000 15000 20000 25000 30000 38078 38231 38384 38443 38596 38687 38777 CP U EGEE:
Simon C. Lin NCTS, Hsinchu, Taiwan
OSG Participation
OSG Production: 53 CEs, 18739 CPUs, 9 SEs (Feb. 2005)
4 sites in Asia: ASGC, NTU, and KNU
Enabling Grids for E-sciencE
Use of the infrastructure
More than 35K jobs/day on the EGEE Grid
LHC VOs 30K jobs/day
Sustained & regular workloads of >35K jobs/day
•
spread across full infrastructureEnabling Grids for E-sciencE
INFSO-RI-508833 28
EGEE Operations Process
• Grid operator on duty
– 6 teams working in weekly rotation
CERN, IN2P3, INFN, UK/I, Ru,Taipei
– Crucial in improving site stability and management
– Expanding to all ROCs in EGEE-II
• Operations coordination
– Weekly operations meetings
– Regular ROC managers meetings
– Series of EGEE Operations Workshops
Nov 04, May 05, Sep 05, June 06
• Geographically distributed responsibility for operations:
– There is no “central” operation
– Tools are developed/hosted at different sites:
GOC DB (RAL), SFT (CERN), GStat (Taipei), CIC Portal (Lyon)
• Procedures described in Operations Manual
– Introducing new sites
– Site downtime scheduling
– Suspending a site
– Escalation procedures
– etc
Highlights:
• Distributed operation
• Evolving and maturing procedures
• Procedures being in introduced into and shared with the related infrastructure projects
Taiwan’s Thinking
International collaboration/ participation with the
global Grid Cyber- and e-Infrastructure is the key
Our strategy is to
use High Energy Physics to drive
the
Next Generation Grid Infrastructure. No national Grid
organization has been established yet !
We are setting up a new Academia Sinica Grid
Computing Centre (ASGC) reorganised from ASCC
ASGC will provide Grid-based infrastructure,
services, e-Science application development, and
promote Grid activities in Taiwan
ASGC is fully supported by Academia Sinica and
Taiwan signed the first WLCG MoU
• Jos Engelen (CERN CSO) and President YT
Lee (Academia Sinica) signed the WLCG MoU
on 9 Dec. 2005 as a Tier-1 Centre for ATLAS
and CMS
VN TH CN MY JP KR HK PH TW SG
Plan for Taiwan Tier-1 Network
Backup Path to T0
Primary Path to T0
(plan to install 10GE in 2006)
Enabling Grids for E-sciencE
The EGEE-II project
•
EGEE
–
1 April 2004 – 31 March 2006
–
71 partners in 27 countries, federated in regional Grids
•
EGEE-II
–
1 April 2006 – 31 March 2008
–
91 partners in 32 countries
–
13 Federations
•
Objectives
–
Large-scale, production-quality
infrastructure for e-Science
–
Attracting new resources and
users from industry as well as
science
–
Maintain and further improve
“gLite” Grid middleware
EU-SEA Singapore 2006
Enabling Grids for E-sciencE
EGEE-II INFSO-RI-031688 34
EGEE – What do we deliver?
•
Infrastructure operation
– Currently includes >200 sites across 39 countries
– Continuous monitoring of grid services & automated site configuration/management
•
Middleware
– Production quality middleware distributed under business friendly open source licence
•
User Support
- Managed process from first contactthrough to production usage
– Training
– Documentation
– Expertise in grid-enabling applications
– Online helpdesk
– Networking events (User Forum, Conferences etc.)
•
Interoperability
Enabling Grids for E-sciencE
EGEE-II Expertise & Resources
•
32 countries
•
13 federations
Major and national
Grid projects in
Europe, USA, Asia
+
27 countries
through related projects:
– BalticGrid – EELA – EUChinaGrid – EUIndiaGrid – EUMedGrid – SEE-GRID
EU-SEA Singapore 2006
Enabling Grids for E-sciencE
EGEE-II INFSO-RI-031688
EGEE Asia-Pacific Federation
PAEC NCP Islamabad IHEP Beijing KNU Daegu Univ. Melbourne GOG Singapore KEK Tsukuba ICEPP Tokyo
Taipei - ASGC, IPAS NTU, NCU
VECC Kolkata
Tata Inst. Mumbai
•
15 EGEE grid sites in Asia Pacific
•
Academia Sinica Grid Computing
Centre (ASGC) is acting as the
coordinator in Asia
• Operation Centre in Asia Pacific Region
• LCG Tier-1 Centre for Physics
•
Potential new sites from Thailand,
Malaysia, Australia, New Zealand
Contributions of ASGC in WLCG
• WLCG Tier1 Centre -- Collaborating ATLAS & CMS
Teams (NCU, NTU, IPAS) in Taiwan
• Regional Operation Centre and Core Infrastructure
Centre
• Production CA Services
• LCG Technology Development
– Data Management
– Grid Technology
– Certification & Testing
– Application Software
– ARDA (Distributed Analysis)
– 3D (Distributed Deployment of Database)
– Operation and Management
Simon C. Lin NCTS, Hsinchu, Taiwan
ARDA
Goal: Coordinate to prototype distributed analysis
systems for the LHC experiments using a grid.
ARDA-ASGC Collaboration: since mid 2003
Building push/pull model prototype(2003)
Integrate Atlas/LHCb analysis tool to gLite(2004)
Provide first integration testing and usage document on Atlas tools:Dial
(2004)
CMS monitoring system development (2005)
Monitoring system to integrate RGMA & MonaLisa
ARDA/CMS Analysis Prototype: Dashboard
ARDA Taiwan Team: http://lcg.web.cern.ch/LCG/activities/arda/team.html
4 FTEs participated: 2 FTEs at CERN, the other 2 are in Taiwan
EGEE Participation of ASGC
Join EGEE as a non-funded member from Dec. 2004
NA3: Training and Induction
NA4: Application in HEP and Biomed
SA1: Support and Operation Management, AP CIC/ROC
JRA1: Middleware Re-engineering
gLite Pre-production site
gLite Testbed
Simon C. Lin NCTS, Hsinchu, Taiwan
EGEE Asia Pacific Services by Taiwan
Production CA Services
AP CIC/ROC
VO Support
Pre-production site
User Support
MW and technology development
Application Development
Education and Training
Promotion and Outreach
Taiwan acts as Asia Pacific
CIC
and
ROC
in EGEE
APROC established in April 2005
Supports EGEE sites in Asia Pacific
Australia, Japan, India, Korea,
Singapore, Taiwan
8
sites,
6
countries
Provides Global and Region services
Simon C. Lin NCTS, Hsinchu, Taiwan
Education and Training
Note: gLite and the development of EGEE were introduced in all the events which are run by ASGC
Event Date Attendant Venue
China Grid LCG Training 16-18 May 2004 40 Beijing, China
ISGC 2004 Tutorial 26 July 2004 50 AS, Taiwan
Grid Workshop 16-18 Aug. 2004 50 Shang-Dong, China
NTHU 22-23 Dec. 2004 110 Shin-Chu, Taiwan
NCKU 9-10 Mar. 2005 80 Tainan, Taiwan
ISGC 2005 Tutorial 25 Apr. 2005 80 AS, Taiwan
Tung-Hai Univ. June 2005 100 Tai-chung, Taiwan
EGEE Workshop Aug. 2005 80 20th APAN, Taiwan
EGEE Administrator Workshop Mar. 2006 40 AS, Taiwan
Simon C. Lin NCTS, Hsinchu, Taiwan
Formation of informal Asia Collaboration Board on 1 December 2005
during LCG Service Challenge meeting in Taipei
Attendees: Australia, China, Japan, Korea, Singapore, Taiwan
Mission
Enable researchers to leverage Grid technologies
Foster collaboration in Asia and the rest of the world
Virtual Organization
APDG: Asia-Pacific Data Grid
VO for deployment testing and training
APESCI: Asia-Pacific e-Science
Production VO to incubate early Grid communities
Plan of AP Federation
VO Services
:
deployed from April 2005 in Taiwan (APROC) LCG: ATLAS, CMS
BioInformatics, BioMed
Geant4
APeSci :
for collaboration general e-Science services in Asia Pacific Areas APDG: for testing and testbed only
TWGRID:
established for local services in Taiwan Potential Applications
LCG, Belle,
nano, biomed, digital archive, earthquake,
GeoGrid, astronomy, Atmospheric Science
Simon C. Lin NCTS, Hsinchu, Taiwan
Service Challenge Plan for T1/T2 in Asia
T1-T2 test plan
what services/functionality need to test
recommendation for T2 sites, checklist
What have to be done before join SC
Communication methods, and how to improve if needed
Scheduling of the plans, candidates of sites
Timeline for the testing
SRM + FTS functionality testing
Network performance tuning (jumbo framing!?)
T1 expansion plan
Computing power/storage
storage management, e.g. CASTOR2 + SRM
Network improvement
Enabling Grids for E-sciencE
Applications on EGEE
•
More than 20 applications from 7 domains
– Astrophysics
MAGIC, Planck
– Computational Chemistry
– Earth Sciences
Earth Observation, Solid Earth Physics, Hydrology, Climate
– Financial Simulation
E-GRID
– Fusion
– Geophysics
EGEODE
– High Energy Physics
4 LHC experiments (ALICE, ATLAS, CMS, LHCb)
BaBar, CDF, DØ, ZEUS
– Life Sciences
Bioinformatics (Drug Discovery, GPS@, Xmipp_MLrefine, etc.)
Medical imaging (GATE, CDSS, gPTM3D, SiMRI 3D, etc.)
24 Jan. 2006 21st APAN, Japan
Enabling Grids for E-sciencE
•
Biomedical goal
–
accelerating the discovery of novel potent
inhibitors thru minimizing non-productive
trial-and-error approaches
–
improving the efficiency of high throughput
screening
•
Grid goal
–
massive throughput: reproducing a
grid-enabled in silico process (exercised in DC I)
with a shorter time of preparation
–
interactive feedback: evaluating an alternative
light-weight grid application framework
(DIANE)
EGEE Biomed DC II – Large Scale
Virtual Screening of Drug Design
Credit: Y-T Wu N1 H5 Credit: Y-T Wu
EU-SEA Singapore 2006
Enabling Grids for E-sciencE
EGEE-II INFSO-RI-031688 50
Example: Avian flu (I)
•
Avian Flu H5N1
– H5 and N1 = proteins on virus surface
(Hemagglutinins and Neuraminidases)
– Neuraminidases play major role
in virus multiplication
•
Present drugs (e.g. Tamiflu)
– inhibit action of neuraminidases and stop virus proliferation
•
Problems
– Virus keeps mutating
– Drug-resistant N1 variants can appear
•
Biological goal of data challenge
– Study in silico the impact of selected point mutations on the efficiency of existing drugs
– Find new potential drugs
N
H
Credit: Y-T Wu
Simon C. Lin NCTS, Hsinchu, Taiwan
mpiBLAST-g2
ASGC, Taiwan and PRAGMA http://bits.sinica.edu.tw/mpiBlast/index_en.php
A GT2-enabled parallel BLAST runs on Grid GT2 GASSCOPY API
MPICH-g2
The enhancement from mpiBLAST by ASGC
• Performing cross cluster scheme of job execution
• Performing remote database sharing • Help Tools for
– database replication
– automatic resource specification and job submission (with static resource table) – multi-query job splitting and result merging
• Close link with mpiBLAST development team
– The new patches of mpiBLAST can be quickly applied in mpiBLAST-g2
24 Jan. 2006 21st APAN, Japan
Simon C. Lin NCTS, Hsinchu, Taiwan
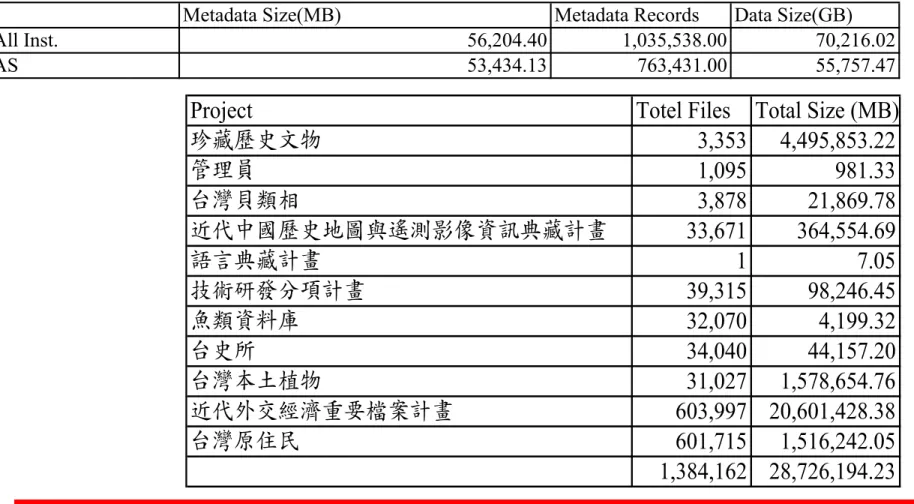
Long-Term Archives for AS NDAP Contents
Project Totel Files Total Size (MB)
珍藏歷史文物 3,353 4,495,853.22 管理員 1,095 981.33 台灣貝類相 3,878 21,869.78 近代中國歷史地圖與遙測影像資訊典藏計畫 33,671 364,554.69 語言典藏計畫 1 7.05 技術研發分項計畫 39,315 98,246.45 魚類資料庫 32,070 4,199.32 台史所 34,040 44,157.20 台灣本土植物 31,027 1,578,654.76 近代外交經濟重要檔案計畫 603,997 20,601,428.38 台灣原住民 601,715 1,516,242.05 1,384,162 28,726,194.23
Table I. Size of Digital Contents of NDAP
2002 2003 2004 2005 Total
Total Data Size (GB) 22,810.00 38,550.00 63,480.00 70,216.02 195,056.02
AS Production (GB) 22,800.68 31,622.17 47,430.79 55,757.47 157,611.11
Table II. Details of NDAP Production in 2005
Metadata Size(MB) Metadata Records Data Size(GB)
All Inst. 56,204.40 1,035,538.00 70,216.02
Linux
Atmosphere Databank Architecture
NCU/databank NTNU/dms MCAT / srb001 Users ASCC/srb002 ASCC/lcg00104(TB) ASCC/lcg00105(TB) NTU/monsoon(TB)
NTU/dbar_rs1, dbar_rs_2 ASCC/gis212(TB)ASCC/gis252(TB)
windows
• Use LAS (Live Access Server) to access the dataset from the
SRB System, and integrate with Google Earth
Simon C. Lin NCTS, Hsinchu, Taiwan
Taiwan GeoGrid
Applications
Grid for Geoscience, Earth Science and Environmental Research and
Applications
Land Use and Natural Resources Plan/Management
Hazards Mitigation
Typhoon Earthquake Flood
Coast line changes Landslide/Debris flow
On-the-fly overlay of base maps and thematic maps,
from distributed data sources (of variant resolution, types, and time)
based on Grid Data Management
WebGIS/Goole Earth based UI
Simon C. Lin NCTS, Hsinchu, Taiwan
Industrial Program
NSC-Quanta Collaboration
To help Quanta Blade System have best performance for
HPC and Grid Computing
Quanta is the largest Notebook manufacturer in the world
Participants: AS, NTU, NCTS, NTHU, NCHC
Scientific Research Disciplines: Material Science,
Nano-Technology, Computational Chemistry, Bioinformatics,
Engineering, etc.
Conclusion
Critical mass decides which Grid technology/system
to prevail; Collaboration, Data and Complexity
Reduction are the main themes
We are about to witness Data Deluge in all disciplines
of e-Sciences
Unprecedented way to collaborate on day-to-day basis
will change the sociology of academia life, eco-system
of business world and eventually every one in the
society