Numerical Study of the Effect of Ventilation Pattern on
Coarse, Fine, and Very Fine Particulate Matter Removal in
Partitioned Indoor Environment
Tsang-Jung Chang, Hong-Ming Kao, and Yi-Fang Hsieh
Department of Bioenvironmental Systems Engineering, National Taiwan University, Taipei, Taiwan,
Republic of China
ABSTRACT
An indoor size-dependent particulate matter (PM) trans-port approach is developed to investigate coarse PM (PM10), fine PM (PM2.5), and very fine PM (PM1) removal
behaviors in a ventilated partitioned indoor environ-ment. The approach adopts the Eulerian large eddy sim-ulation of turbulent flow and the Lagrangian particle tra-jectory tracking to solve the continuous airflow phase and the discrete particle phase, respectively. Model verifica-tion, including sensitivity tests of grid resolution and particle numbers, is conducted by comparison with the full-size experiments conducted previously. Good agree-ment with the measured mass concentrations is found. Numerical scenario simulations of the effect of ventila-tion patterns on PM removal are performed by using three common ventilation patterns (piston displacement, mix-ing, and cross-flow displacement ventilation) with a mea-sured indoor PM10profile in the Taipei metropolis as the
initial condition. The temporal variations of suspended PM10, PM2.5, and PM1mass concentrations and particle
removal mechanisms are discussed. The simulated results show that for all the of the three ventilation patterns, PM2.5and PM1are much more difficult to remove than
PM10. From the purpose of health protection for indoor
occupants, it is not enough to only use the PM10level as
the indoor PM index. Indoor PM2.5and PM1levels should
be also considered. Cross-flow displacement ventilation is more effective to remove all PM10, PM2.5, and PM1than
the other ventilation patterns. Displacement ventilation would result in more escaped particles and less deposited particles than mixing ventilation.
INTRODUCTION
Several epidemiological studies1–3conducted in different
countries have reported that particulate matter (PM) with aerodynamic diameter smaller than 10m (PM10),
espe-cially the finer particle fraction of PM10, such as PM2.5
(⬍2.5 m) and PM1(⬍1 m), can penetrate deep into the
respiratory tract and, therefore, have a negative impact on human health condition, such as an increase in mortali-ty1and asthma.2These findings attract more attention to
the investigation of transport behavior of PM. Moreover, people nowadays spend a significant amount of their time in the indoor environment, such as homes, offices, and transport vehicles. The provision of low indoor PM levels in these indoor environments is, thus, crucial. However, in many large Asian cities, such as Taipei, Tokyo, Japan, and Hong Kong, People’s Republic of China, because of the liv-ing habits and cookliv-ing style, indoor PM10and PM2.5levels
have been found to be approximately two to four times higher than those in homes in Western countries.4 As a
result, there is a high demand in Asia for research on indoor air cleaning procedures against PM10, PM2.5, and PM1.
Natural or mechanical ventilation has played an es-sential role in diluting and removing pollutants emitted by indoor sources. Ventilation is an air mass transfer process by which clean outdoor air is brought to an in-door space and stale air is removed.5This clean outdoor
air is either mixed with the air already present in the indoor space to give mixing or dilution ventilation or is used to displace air in the indoor space to provide dis-placement or piston-flow ventilation. The above different ventilation patterns can provide different removal mech-anisms of indoor PM. Thus, these ventilation patterns give characteristically different PM10/PM2.5/PM1removal
ability and result in different PM suspension profiles. To minimize exposure to indoor PM, studies on investigating the effect of different ventilation patterns on PM10, PM2.5,
and PM1removal are necessary.
Academic studies regarding PM transport in the in-door environment have been mostly carried out by exper-imental measurement.6 –10 Generally, these experiments
can provide useful knowledge of airflow and PM transport behavior on the sample points for given experimental IMPLICATIONS
In many large cities in Asia, because of the living habits and cooking style, indoor PM10and PM2.5levels were found to
be approximately two to four times higher than those in the homes in Western countries. As a result, there is a high demand in Asia for investigating indoor air cleaning proce-dures against PM10, PM2.5, and PM1. This work developed
a computational fluid dynamics technique to investigate indoor airflow patterns and PM10/PM2.5/PM1removal ability
in ventilated partitioned buildings. A series of the numerical scenario simulations on the effect of the ventilation pattern on indoor PM transport was performed. The performance of PM10/PM2.5/PM1removal efficiency for each scenario was
focused on, and the possible reasons for the difference between each other were further discussed. This informa-tion would help to provide a useful PM control strategy in partitioned buildings.
configurations. However, it is very difficult to simulta-neously measure temporal and spatial information on airflow velocity distribution, PM size, and concentration distribution in the entire building for any specific physi-cal configurations. Computational fluid dynamic (CFD) solutions are, thus, more adequate and convenient for analyzing airflow patterns and PM concentrations inside a building, because building configurations can be numer-ically made and modified as required within a short time.5
Most previous CFD work5,11,12on indoor PM transport are
mainly based on the Eulerian advection-diffusion proach, which takes less computing resources. This ap-proach, neglecting the particulate nature of indoor parti-cles, is only adequate for simulating gaseous pollutants or small, neutrally buoyant particles that exactly follow the fluid flow. Some studies13,14have improved this approach
by considering the gravity settling in the Eulerian calcu-lation. However, these studies can still give partial particle characteristics. Recently, because of the extraordinary de-velopment of the computational facility, more and more CFD research15–19has used the Lagrangian particle
track-ing approach to numerically examine indoor PM trans-port behavior, because tracking the continuous move-ment of particles through the Lagrangian scheme offers considerable particulate insight into the complex indoor airflow characteristics of partitioned buildings, such as various length-scale vortex structures and entry momen-tum jets. For example, Lu and Howarth16and Lu et al.17
developed a pioneer CFD model to predict PM deposition and suspension in a two-zone chamber. Nevertheless, all of the aforementioned Lagrangian CFD works only fo-cused on the transport behavior of single-size PM, which cannot be used to study removal behavior of size-depen-dent PM, such as PM10, PM2.5, and PM1.
Because of the lack of academic works in using the CFD technique in modeling size-dependent PM removal behavior in a partitioned indoor environment in East Asia, the main objective of this study was to investigate indoor airflow patterns and PM10/PM2.5/PM1 removal
ability in ventilated partitioned buildings. A series of the numerical scenario simulations on the effect of a ventila-tion pattern on indoor PM transport are performed. The performance of PM10/PM2.5/PM1 removal efficiency for
each scenario is studied. EXPERIMENTAL WORK
Indoor Size-Dependent PM Transport Model The numerical methodology for simulating the transport patterns of size-dependent PMs in partitioned environ-ment consists of two parts, namely the Eulerian indoor airflow model and the Lagrangian particle trajectory-tracking model. The airflow model, conducting the large eddy simulation (LES) of the Eulerian turbulent flows indoors, is solved first to obtain the velocity and pressure distributions. The result of the velocity distribution is then used in the Lagranigan particle-tracking model to calculate the velocities and trajectories of individual particles.
Eulerian Indoor Airflow Model
LES has recently received more and more attention and has been successfully applied to several natural ventilation prob-lems.20A fully developed turbulent flow contains eddies of
many length scales. In the LES procedure, small eddies are filtered out, and large eddies are solved numerically by com-puting the filtered equations. The influence of small eddies that are filtered out cannot be neglected and leads to the subgrid-scale Reynolds stress.21 In the present study, the
Smagorinsky subgrid-scale model22 is adopted in the LES
procedure. The filtered continuity equation and momen-tum equation in the LES are listed below:
ui xi⫽ 0 (1) and ui t ⫹ uiuj xj ⫽ ⫺ 1 p xi⫹ v 2u i xjxj⫺ ij xj (2)
where the bar “⫺” represents spatial filtering, ui is the
component of filtered instantaneous fluid velocity in the
xidirection, p is fluid pressure, is fluid density, is fluid
kinematic viscosity, andij[⫽ ⫺2(Cs⌬) 2(2S˜
ij䡠S˜ij)
1/2
repre-sents the Smagorinsky subgrid-scale Reynolds stresses.22
In ij, S˜ij is fluid strain rate, and ⌬ ⫽ (⌬xi⌬xj⌬xk) 1/3 is
filtered grid width in three dimensions. Cs, a Smagorinsky
constant and usually between 0.1 and 0.2,23is 0.15 in the
present study. The other numerical details can be found in Chang et al.24It should be noted that because the LES
produces time-dependent solutions, the time-averaged velocities (ui) can be obtained by statistical analysis of the
instantaneous velocities ui according to ui ⫽ (ui) ⫹ u⬘i
where u⬘idenotes the turbulent components of the filtered
velocities. In addition, the LES is primarily valid for tur-bulent core flows (i.e., the flow in the regions somewhat far from walls).21 To deal with boundary layer flows in
partitioned environment, the wall function model near the solid boundary25 and the nonslip boundary on the
wall are adopted.
Lagrangian Particle Tracking Model For the purpose of investigating the transport behaviors of PM10/PM2.5/PM1, the PM size that the authors focused
on is particle aerodynamic diameter⬍10 m. Under such a particle size range, time series of instantaneous particle positions can be obtained by numerical integration of the following three-dimensional differential equations, which include the gravitational force, FG, the drag force,
FD, the Saffman lift force, FS, and the Brownian motion
force, FB.26 1 6pdp3 dui p dt ⫽ FG⫹ FD⫹ FS⫹ FB ⫽16dp3共p⫺ 兲gi␦i3⫺ 1 6pdp3䡠 1 共uip⫺ ui兲 ⫺16pdp3 5.188v1/2d ij Sdp共dlkdkl兲1/4共uj p⫺ u j兲 ⫹16pdp3Gi
冑
S0 ⌬t (3)and
dxi
dt ⫽ ui
p (4)
where uiis filtered fluid velocity, uipis particle velocity,
is fluid density,pis particle density, xi is coordinate of
particles, t is time, dpis particle diameter, S is the density
ratio between particle and adjacent fluid, ␦ is unit delta function, is relaxation time of the particle,27and d
ijis
[(ui,j⫹ uj,i)/2] is the deformation rate tensor. The
Brown-ian motion force is modeled as GaussBrown-ian white noise
random process, where Gi is zero-mean, unit variance
independent Gaussian random number,⌬t is particle time step, and S0is spectral intensity.26The numerical details
of solving eqs 3 and 4 and the assumptions of the numer-ical simulation can be found in Chang et al.24
Two kinds of particle boundary condition are used in the present study. Trap boundary means that once a par-ticle touches it, the parpar-ticle is trapped, and parpar-ticle track-ing process would cease. Walls, floors, and ceiltrack-ings in the building are established as the trap boundary. Outflow boundary is used for all of the building exterior outlets, such as windows and doors. When a particle passes through the outflow boundary, the particle tracking is terminated.
Grid and Particle Sensitivity Analysis and Model Validation
To validate the accuracy of the numerical scenario simu-lations for different ventilation patterns, the present nu-merical model is verified by the reliable measured indoor mass concentrations of a three-dimensional full-scale two-zone building in a paper by Lu et al.15As shown in
Figure 1, the size of the building is L(x)⫻W(y)⫻H(z) ⫽ 5 m ⫻ 3 m ⫻ 2.4 m. The building is divided into two zones by a partition located in the middle of the building length. Figure 1. Schematic of the two-zone building used by Lu et al.15
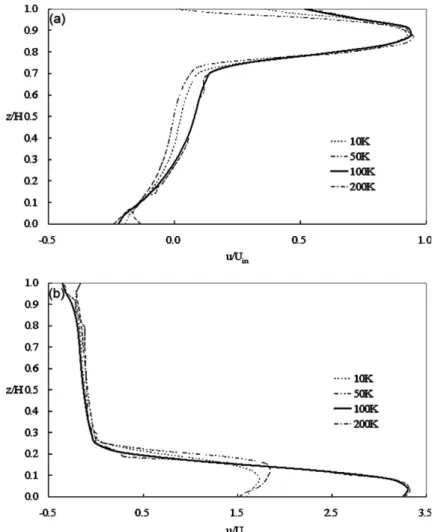
Figure 2. Grid sensitivity analysis of airflow computation along the central-line of (a) zone I and (b) zone II. H⫽ building height; Uin⫽ inlet
An internal opening is on the center line of the building. All of the walls and openings of the building are 0.15 m thick and have the same temperature as the ambient air. The airflow in the building is isothermal. Outdoor fresh air enters zone I of the building through the inlet opening (1 m⫻ 0.5 m) at an upper level. The outlet opening (1 m⫻ 0.5 m) is situated at a low level of zone II. A total of six cases have been conducted in their experiment, rep-resenting six ventilation rates with three internal open-ings. All of the six cases are used to verify the present numerical model, and two of them (cases 4 and 5) are demonstrated.
Case 4 uses an internal opening with a size of 0.3 m⫻ 0.7 m and a ventilation rate of 12.71 air changes per hour (ACH, hr⫺1), whereas case 5 has a 0.95 m⫻ 0.7 m internal opening and 9.22 ACH. The corresponding Reynolds numbers based on the height of the internal opening are 1400 and 1000, respectively. The size of the smoke parti-cles used in the experiments equally ranges from 1 to 5 m, with a density of 865 kg m⫺3. Particles are initially
injected in zone I and uniformly distributed in zone I as the measurement starts.
Grid Convergence Analysis
Because computing resources are limited, the mesh size of the finite volume cells in the present study cannot be set to be zero. Numerical discretization errors are inevitable. It is important, therefore, before the model validation, to understand the magnitude of numerical discretization er-rors and ensure that a sufficiently fine grid is used to reduce the error to an acceptable value. To demonstrate
the grid convergence in the present study, four grid reso-lution tests (the numbers of nonuniform finite-volume cells are 10,000, 50,000, 100,000, and 200,000, respec-tively) are used to simulate the airflow field of the two-zone building in Figure 1 with 9.22 hr⫺1. Figure 2 displays the dimensionless time-averaged velocities along the ver-tical centerlines of zone I and zone II. The results show that the solution is convergent when the grid numbers are ⬎100,000. Therefore, the present study selects 100,000 grid cells as the numerical basis of the indoor airflow computation.
Particle Sensitivity Analysis and Model Validation
In the Lagrangian particle tracking process, the particle number or mass concentrations are generally derived from statistical analysis of the trajectories of the particles. The accuracy of using Lagrangian particle tracking method depends on the release of a statistically signifi-cant sample of particles. As a consequence, sensitivity analysis on the size of the particle sampling is performed in the next step. Lu et al.15only used 800 particles in their
simulation. In the present study, under the aforemen-tioned 100,000 grid cells, three particle sample sizes (the numbers of sample particles are 800, 2400, and 6000) are used to simulate the temporal distributions of indoor mass concentration in the two-zone building. The initial positions of particles are uniformly distributed in zone I, with a sum of 800, 2400, and 6000 particle tracks, respec-tively. The total particle mass injected in zone I is speci-fied according to the experimental data, and the particle Table 2. Particle parameters for model verification with an air change rate of 9.22 hr⫺1.
Particle Size
dp (m)
No. of Total Sample Particlesⴝ 800 No. of Total Sample Particlesⴝ 2400 No. of Total Sample Particlesⴝ 6000
No. of Real Particles
Carried Particle Mass Carried
by Each Sample Particle (g)
No. of Sample Particles
Particle Mass Carried by Each Sample
Particle (g)
No. of Sample Particles
Particle Mass Carried by Each Sample Particle (g) No. of Sample Particles 1 147.35 160 49.12 480 19.65 1200 3.25E⫹ 11 2 147.35 160 49.12 480 19.65 1200 4.07E⫹ 10 3 147.35 160 49.12 480 19.65 1200 1.20E⫹ 10 4 147.35 160 49.12 480 19.65 1200 5.08E⫹ 09 5 147.35 160 49.12 480 19.65 1200 2.60E⫹ 09
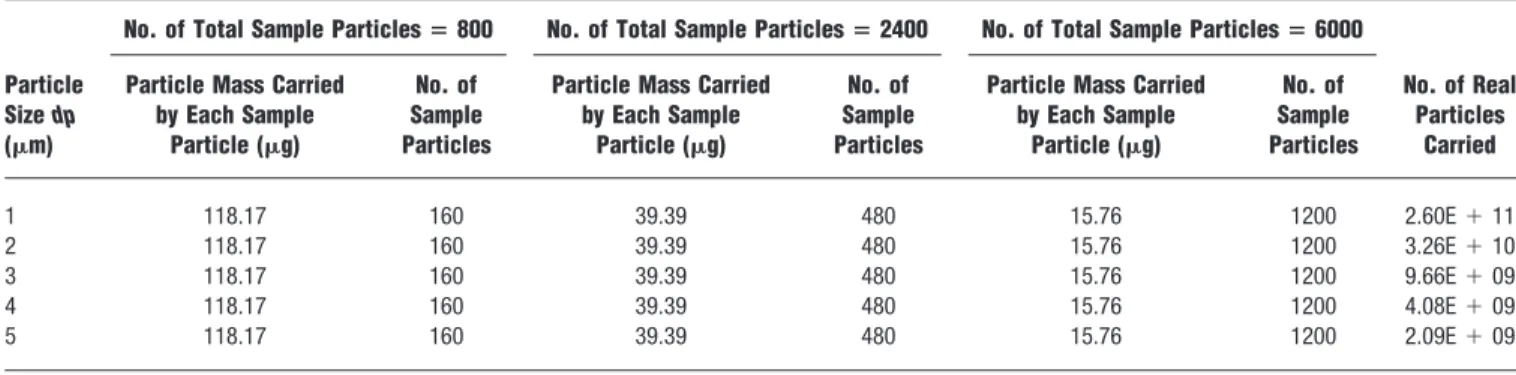
Table 1. Particle parameters for model verification with an air change rate of 12.71 hr⫺1.
Particle Size dp (m)
No. of Total Sample Particlesⴝ 800 No. of Total Sample Particlesⴝ 2400 No. of Total Sample Particlesⴝ 6000
No. of Real Particles
Carried Particle Mass Carried
by Each Sample Particle (g)
No. of Sample Particles
Particle Mass Carried by Each Sample
Particle (g)
No. of Sample Particles
Particle Mass Carried by Each Sample Particle (g) No. of Sample Particles 1 118.17 160 39.39 480 15.76 1200 2.60E⫹ 11 2 118.17 160 39.39 480 15.76 1200 3.26E⫹ 10 3 118.17 160 39.39 480 15.76 1200 9.66E⫹ 09 4 118.17 160 39.39 480 15.76 1200 4.08E⫹ 09 5 118.17 160 39.39 480 15.76 1200 2.09E⫹ 09
Notes: No. of real particles carried⫽ the number of real particles released in the full-size experiment; No. of sample particles ⫽ the number of particles used
for the numerical simulation; Particle mass carried by each sample particle⫽ the ratio of the initial total particle mass released in the experiment to No. of sample particles.
mass is uniformly carried by each size group (see Tables 1 and 2 for details).
The numerical particle mass concentrations (C) in each zone at each tracking minute can be determined by using the following:
C⫽Ms
V (5)
where MSis the total mass of suspended particles, and V
denotes the volume of the zone. Comparisons of the PM mass concentrations in both zones between the numeri-cal simulations and the full-size experiments are shown in Figure 3. The results show that some discrepancies exist for the case releasing 800 particles. Good agreement of the temporal concentration distributions between the simu-lated and measured data in each zone can be found for the cases releasing 2400 and 6000 sample particles. The rela-tive difference in the simulated results between the two cases is⬍10%. Thus, the present study chooses to release 2400 sample particles as the numerical basis of the mass concentration computation. In addition to cases 4 and 5 shown above, the other four cases conducted by Lu et al.15
have been also adopted to verify the present numerical model, which have demonstrated similar results.
Numerical Scenario Simulations
The indoor size-dependent PM transport model has been tested and validated in the previous section. It, thus, is used to conduct further similar numerical scenario simu-lations. To investigate PM10/PM2.5/PM1 removal
behav-iors and suspension profiles in a partitioned indoor envi-ronment, the same two-zone building used previously is considered again. All of the openings are 0.8 m⫻ 1.0 m or 1.0 m⫻ 0.8 m. The air change rate is reduced to 5 hr⫺1, because natural or mechanical ventilation in an indoor environment rarely exceeds 7 hr⫺1.5The positions of inlet
and outlet openings are modified in such a way that three major indoor ventilation patterns (piston displacement, mixing, and cross-flow displacement ventilation) are cre-ated. The airflow in the building is assumed 20 °C isother-mal. It should be noted that according to the building code requirements issued by the Construction and Plan-ning Agency, Taiwan, the size of ventilation opePlan-nings in a room cannot be⬍10% of the floor area. For other East Asian countries, Hong Kong and Japan also have the same or similar restriction of the minimum opening size on their own building codes. In the present study, the ratio of the size of the inlet/outlet opening to the floor area in each room is 10.6%, which fits the building code require-ments. In addition, the present study uses an air change rate of 5 hr⫺1, which is common in the Asian monsoon area. It is believed that an adequate inlet/outlet opening size together with a reasonable outdoor-to-indoor air change rate can result in a typical ventilation condition in East Asia.
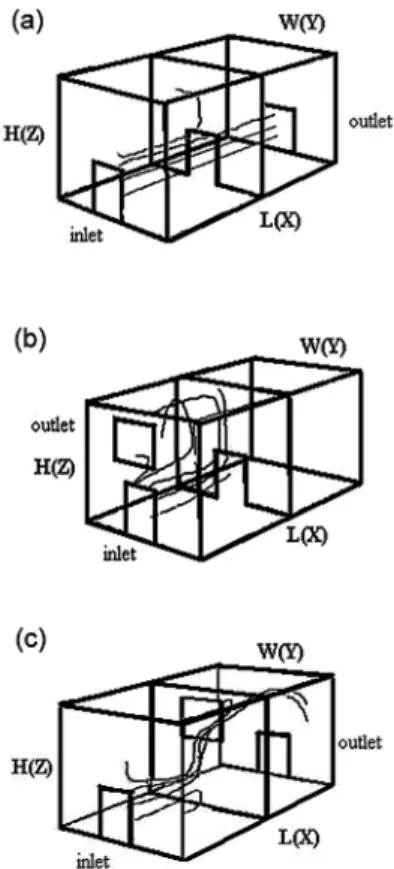
As shown in Figure 4, piston-like flow, one com-monly used in displacement ventilation, represents an unimpeded straightforward airflow pattern between the incoming and outgoing airstreams, which pass through
Figure 3. Comparison of the simulated particle concentrations with measured data: (a) ACH⫽ 12.71 hr⫺1at zone I; (b) ACH⫽ 12.71 hr⫺1at zone II; (c) ACH⫽ 9.22 hr⫺1at zone I; and (d) ACH⫽ 9.22 hr⫺1at Zone II.
the interior opening of the building and replace the par-ticle-laden air that is already present. The spatial concen-tration of pollutant within the space is, therefore, ex-pected to be nonuniform. Mixing ventilation appears to mix outdoor clean air with indoor polluted air and to dilute indoor pollutants. If mixing is perfect, the pollut-ant concentration is uniform throughout the space. Cross-flow ventilation occurs where part of the airflow paths between the incoming and outgoing air streams is hindered in such a way that airflow paths are crossed. Indoor pollutant is both replaced and mixed by the in-coming outdoor air.
An indoor PM10 profile was measured in the Taipei
Metropolis in 2005 by using a portable laser dust monitor (Series 1100, Grimm Labortechnik GmbH & Co. KG). The PM10profile follows a lognormal distribution with a
geo-metric mean diameter (GMD) of 1.09m and a geometric standard deviation (GSD) of 1.27. In the profile, the PM10,
PM2.5, and PM1 mass concentrations are 48.00 g⫺3,
24.28g⫺3, and 13.94g⫺3, respectively. This profile is divided into 10 size groups in terms of aerodynamic di-ameters ranging from 0.5 to 10m (see Table 3). In each size group, the PM concentration is assumed to be a constant.
Numerical scenario simulations of the three ventila-tion patterns having 5-hr⫺1 air change rate with the above PM10profile as the initial condition are carried out.
At the beginning of particle release, particles are distrib-uted uniformly in both zone I and zone II. Particles move after clean outdoor air flowing into the building, resulting in redistribution of the PM concentration. The PM con-centration is calculated from the simulated results of en-semble-averaged particle trajectories. Three widely used particle size indexes of PM10, PM2.5, and PM1 are
deter-mined by numerically integrating the appropriately weighted moment of the 10 respective particle size groups in Table 3.
In the LES approach, the smallest mesh used herein is 0.05 m, which is near the wall region and is only one order higher than the Kolmogorov length scale. After carrying out the LES for several flow-through times to ensure that the final time-averaged results are indepen-dent of the initial conditions, the time-averaged velocities and turbulent statistics are collected over 150 sec with a temporal resolution of⌬t ⫽ 0.003 sec. For the Lagrangian particle tracking process, the time step that the authors use is one order smaller than the relaxation time of par-ticles to ensure the numerical accuracy. Six-hundred en-sembles are undertaken to obtain the ensemble-averaged trajectories for each sample particle at each time step.24 RESULTS AND DISCUSSION
Indoor Airflow Pattern
By means of the LES procedure and turbulent statistics, the instantaneous and time-average airflow velocities of the 100,000 nonuniform grids are determined. The sim-ulated results of the time-average airflow field at the cen-ter line plane for the three ventilation patcen-terns are shown in Figure 5. It can be seen from Figure 5 that the location of the inlet and outlet openings has significant impact on indoor airflow pattern and ventilation effectiveness inside of the building. In the case of piston displacement venti-lation (Figure 5a), a strong incoming jet from the wind-ward side moves straightforwind-wardly through the interior opening and finally flows toward the leeward side just like a piston flow. Between the incoming jet and the ceiling, two large but weak counterclockwise circulating eddies Figure 4. Schematic of the three ventilation patterns and particle
trajectories: (a) piston displacement ventilation, (b) mixing ventila-tion, and (c) cross-flow displacement ventilation.
Table 3. Particle parameters of the numerical scenario simulations.
Size Range (1) 0.5–1m (2) 1–2m (3) 2–3m (4) 3–4m (5) 4–5m (6) 5–6m (7) 6–7m (8) 7–8m (9) 8–9m (10) 9–10m Average diameter (m) 1 1.5 2.5 3.5 4.5 5.5 6.5 7.5 8.5 9.5 Particle mass carried by
each sample particle (g)
1.038 0.542 0.489 0.327 0.269 0.255 0.235 0.216 0.175 0.183 No. of sample particles 480 480 480 480 480 480 480 480 480 480 No. of real particles carried 9.52E⫹ 08 1.47E ⫹ 08 2.87E ⫹ 07 6.99E ⫹ 06 2.71E ⫹ 06 1.41E ⫹ 06 7.84E ⫹ 05 4.69E ⫹ 05 2.61E ⫹ 05 1.96E ⫹ 05
Notes: PM1 mass concentration⫽ 关total mass of (1)兴/zone volume; PM2.5 mass concentration⫽ 关total mass of (1)⫹(2)⫹0.5*(3)兴/zone volume; PM10 mass
located in both zones cannot bring too much outdoor air. The airflow velocities in the piston flow are much stronger than those in the areas of circulating eddies. As a result, good outdoor-to-indoor airflow exchange is only ob-served in the jet area, and the rest of the building space is poorly ventilated.
In Figure 5b, the airflow paths of mixing ventilation can be classified into three patterns. Most inflow turns its direction and flows upward, moves counterclockwise, and
then exits to the outlet in zone I. This phenomenon is referred to as the shortcut effect. Part of the inflow di-rectly flows into zone II and gets trapped inside. There-fore, a weak circulating region is observed in zone II. There is still some airflow in zone II flowing back to zone I through the upper part of the interior opening. In addi-tion, part of airflow in zone I is impeded in front of the interior opening. It is believed that this phenomenon results from the relatively high pressure in zone II, be-cause zone II is single-sidedly ventilated. For this reason, it is found that the velocity magnitude in zone II is much weaker than that in zone I. The airflow patterns in Figure 5b indicate that it is not apt for fresh air to flow into zone II. It is important to note that the indoor partition will destroy the mixing process in zone II. However, this is inevitable for any partitioned indoor environment.
In Figure 5c, for cross-flow displacement ventilation, the inlet flow reaches the partition and then is forced to make a turn. Because of the blockage effect of the indoor partition, part of airflow in zone I flows downward to form a small clockwise vortex in front of the partition, and part of it moves upward to zone II through the par-tition opening. In zone II, the incoming airflow jet passes through the upper area and then bends downward toward the outlet. Two strong circulating regions can be seen in the upper part of zone I and the lower part of zone II. Because of the geometric arrangement of the inflow, out-flow, and interior opening, cross-flow displacement ven-tilation provides wider ventilated areas than the other two ventilation patterns. Therefore, all of the space in the building receives more sufficient airflow exchange.
Suspended PM10, PM2.5, and PM1Mass
Concentrations
Figure 6 displays the temporal variations of the mass concentrations of PM10, PM2.5, and PM1in each zone of
the building for the three ventilation patterns. In the case of cross-flow displacement ventilation, indoor particles are driven through the incoming airflow from the upwind zone toward the downwind zone. Indoor particles inside of zone I can be blown out effectively. Zone II takes migrated particles from zone I together with their original particles, resulting in increasing PM levels in the first few minutes and then decreasing PM concentrations for the rest of the time. All of the PM10, PM2.5, and PM1mass
concentrations in both zones are substantially reduced because of their large ventilated areas. For piston displace-ment ventilation, the effective outdoor-to-indoor airflow exchange only occurs in the narrow piston area so that good PM removal can be seen only in this area. The rest of the building space is poorly ventilated, resulting in poor PM removal. Because of the small ventilated areas, all of the PM10, PM2.5, and PM1mass concentrations in zone I
and zone II are slowly decreased compared with the other two ventilation patterns. For mixing ventilation, because of its shortcut effect caused by the geometric arrangement of the openings, PM10, PM2.5, and PM1mass
concentra-tions in zone I can be effectively reduced to⬃86%, 79%, and 72%, respectively, of the initial concentrations after minute 30 of the particle tracking time. However, PM levels in zone II are not accessible to be lowered down, because zone II is single-sidedly ventilated with high Figure 5. The time-averaged velocity distributions for (a) piston
displacement ventilation, (b) mixing ventilation, and (c) cross-flow displacement ventilation.
pressure inside, in which particles are not easily moved in and out.
PM10, PM2.5, and PM1Removal Efficiency
Based on the simulated results in Figure 6, PM levels are spatially averaged for the entire building to obtain the build-ing-averaged removal efficiencies of PM10, PM2.5, and PM1
at minute 30 of the tracking time. The removal efficiencies of PM10, PM2.5, and PM1for piston displacement, mixing,
and cross-flow displacement ventilations are 62%, 35%, and
31%; 70%, 59%, and 50%; and 85%, 72%, and 64%, respec-tively. Among the three ventilation patterns, cross-flow dis-placement ventilation is considered as the most effective way to remove PM10, PM2.5, and PM1. The reason is that
cross-flow provides a wider range of ventilated area to trans-port and remove indoor particles than the other ventilation patterns.
The above results also reveal that coarse particles (⬎2.5 m) are easier to remove from the building than fine particles (⬍2.5 m). This can be explained because Figure 6. The temporal variations of the mass concentrations of (a) PM10, (b) PM2.5, and (c) PM1in each zone of the building for the three
coarse particles can maintain their velocities for longer time duration because of larger inertia and relaxation time. This phenomenon, together with their stronger gravitational set-tling, causes coarse particles to move easily from one circu-lation region to another. Contrarily, PM2.5 and PM1 are
easily trapped in eddies indoors, because fine particles have smaller inertia and relaxation time. Thus, fine particles are easily influenced by the surrounding complex indoor air-flows in a partitioned environment such as different length-scale vortex structures, entry jets, and circulating flows, which can be clearly seen in the present study.
PM Removal Mechanism
Indoor polluted particles are redistributed after clean out-door air flowing into the building. During the redistribu-tion process, particles would suspend in the air, migrate to
other zones, settle down to floors, inertially impact or intercept on walls or ceilings, or escape out of the build-ing, which can all be thoroughly simulated by the present model. The above particle transport mechanisms are usu-ally classified into four parts, that is, suspension, migra-tion (carried to the neighboring zone by airflow), deposi-tion, and escape.24,27Deposition and escape are regarded
as particle removal mechanisms.27Figure 7 displays the
cumulative mass fractions of particle deposition, migra-tion, and escape in each zone for the three ventilation patterns. In Figure 7, a and b, particle migration and escape are almost as large as particle deposition, because the useful outdoor-to-indoor airflow exchange only oc-curs in the narrow piston area. For mixing ventilation, as the shortcut effect enables particles to be conveniently blown out, the cumulative mass fraction of escaped particles Figure 7. The cumulative mass fractions of particle deposition, migration and escape in each zone for the three ventilation patterns: (a) piston displacement ventilation at Zone I, (b) piston displacement ventilation at Zone II, (c) mixing ventilation at Zone I, (d) mixing ventilation at Zone II, (e) cross-flow displacement ventilation at Zone I, and (f) cross-flow displacement ventilation at Zone II.
in zone I is much more than that of deposited and migrated particles (Figure 7c). Because of the poor ventilation in zone II, most of the particles in zone II are removed by deposition (Figure 7d). Particle migration between zone I and zone II is rare. In Figure 7, e and f, cross-flow displacement ventilation provides wider and stronger ventilated areas so that the majority of the particles in zone I can be carried to zone II. Finally, the particles escape from the building through the outlet.
It can be also seen in Figure 7 that escape is the major particle removal mechanism for displacement ventilation. The relative importance between escape and deposition is determined by their ventilation effectiveness. The cumula-tive mass fraction of escaped particles is approximately eight times that of deposited particles for cross-flow displacement ventilation. On the contrary, particle escape is only 17% larger than particle deposition for piston displacement ven-tilation. In the case of mixing ventilation, particle deposi-tion is more important than escape.
Particle Size Distribution
The analysis of particle size distribution is one of the key elements to evaluate the hazards on human health.28
Figure 8 compares the initial particle size distribution and the particle size distribution at minute 30 in each zone for the three ventilation patterns. The GMD and the GSD of the particle size profiles for piston displacement, mixing,
and cross-flow displacement ventilations are 1.04m and 1.14; 1.01m and 1.07; and 1.00 m and 1.04, respec-tively, in zone I and 1.05m and 1.17; 1.04 m and 1.16; and 1.01m and 1.06, respectively, in zone II. It is dem-onstrated in Figure 8 that cross-flow displacement venti-lation, the most effective way to remove PM, has the lowest values of GMD and GSD, whereas piston displace-ment ventilation has the highest values of GMD and GSD. Therefore, all of the three ventilation patterns lead to the shift of the particle size distribution toward smaller size and less deviation, and a ventilation pattern with higher PM removal ability would result in a swifter shift.
In addition, it can be inferred from the above results that, because of the shift of the particle size distribution toward a smaller size, PM10is much easier to be removed
from the building than finer particles like PM2.5and PM1
for the three ventilation patterns. However, getting rid of coarse particles cannot guarantee a healthy indoor envi-ronment, because the remaining high levels of indoor PM1and PM2.5would penetrate deep into the respiratory
tract and have a negative impact on indoor occupants. One would expect that it is not enough to use the PM10
level as the only indoor PM index. Thus, for the purpose of health protection for indoor occupants, indoor PM2.5
and PM1 levels should be also considered. Finally, it is
important to note that, because of the measurement lim-itation of the portable laser dust monitor used herein, the Figure 8. Particle size distributions at minute 30 of the tracking time for the three ventilation patterns at (a) zone I and (b) zone II.
present study considers diameters ranging only from 0.5 to 10m. In Table 3, there is only one size group for particle diameter⬍1 m, which limits the investigation of the tem-poral variation of fine particles. Further study on the trans-port behavior of fine and ultra fine particles is needed. CONCLUSIONS
A series of numerical scenario simulations on the effect of a ventilation pattern on indoor PM removal efficiency in a partitioned environment was conducted. Based on the simulated results, the present research has led to the fol-lowing conclusions. First, the present numerical model provides a convenient and useful tool to investigate in-door airflow patterns and PM10, PM2.5, and PM1transport
behaviors in a partitioned building. Second, although the ventilation rate of the building is the same, the location of the inlet and outlet openings has a significant impact on ventilation effectiveness and PM removal efficiency inside of the building. Among the three ventilation patterns, cross-flow displacement ventilation provides wider venti-lated areas than the other ventilation patterns. It is con-sidered as the most effective way to remove all of the PM10, PM2.5, and PM1. Third, for the three ventilation
patterns, PM10is much easier to remove than finer
parti-cles like PM2.5and PM1. However, getting rid of coarse
particles cannot guarantee a healthy indoor environment, because the remaining high levels of PM1 and PM2.5
would penetrate deep into the respiratory tract and have a negative impact on indoor occupants. For the purpose of health protection for indoor occupants, it is not enough to only use the PM10 level as the indoor PM
index. Indoor PM2.5 and PM1levels should be also
con-sidered. Fourth, displacement ventilation would result in more escaped particles and less deposited particles than mixing ventilation. Finally, particle transport is size de-pendent and is mainly affected by indoor airflow pattern and particle physical properties. A ventilation pattern having a higher particle removal efficiency would result in a swifter shift of the particle size distribution toward smaller size and less deviation.
ACKNOWLEDGMENTS
This work is supported by National Science Council, Tai-wan, Republic of China, under grant NSC 95-2221-E-002-393. The authors are grateful for the support.
REFERENCES
1. Dockery, D.W.; Pope, C.A. Acute Respiratory Effects of Particulate Air Pollution; Ann. Rev. Public Health 1994, 15, 107-132.
2. Anderson, P.J.; Wilson, J.D.; Hiller, F.C. Respiratory Tract Deposition of Ultrafine Particles in Subjects with Obstructive or Restrictive Lung Disease; Chest 1990, 97, 1115-1120.
3. Abbey, D.E.; Ostro, B.E.; Petersen, F.; Burchette, R.J. Chronic Respira-tory Symptoms Associated with Estimated Long-Term Ambient Con-centrations of Fine Particulates Less Than 2.5 Microns in Aerodynamic Diameter (PM2.5) and Other Air Pollutants; J. Expo. Anal. Environ.
Epidemiol. 1995, 5, 137-159.
4. Chao, C.Y.; Wong, K.K. Residential Indoor PM10and PM2.5in Hong
Kong and the Elemental Composition; Atmos. Environ. 2002, 36, 265-277.
5. Awbi, H.B. Ventilation of Building, Chapman & Hall: London, U.K., 1991.
6. Li, C. Elemental Composition of Residential Indoor PM10in the Urban
Atmosphere of Taipei; Atmos. Environ. 1994, 28, 3139-3144. 7. Hirosihi, N.; Masanori, I.; Manabu, S.; Sadanori, K.; Masaji, O. A New
Approach Based on a Covariance Structure Model to Source Appor-tionment of Indoor Fine Particles in Tokyo; Atmos. Environ. 1994, 28, 631-636.
8. Tung, C.W.; Chao, Y.H.; Burnett, J.; Pang, S.W.; Lee, Y.M. A Territory Wide Survey on Indoor Particulate Level in Hong Kong; Build. Environ.
1999, 34, 213-220.
9. Lanchenmyer, C.; Hidy, G.M. Urban Measurements of Outdoor-In-door PM2.5Concentrations and Personal Exposure in the Deep South.
Part I. Pilot Study of Mass Concentrations for Nonsmoking Subjects; Aerosol Sci. Technol. 2000, 32, 34-51.
10. Koutrakis, P.; Sax, S.N.; Sarnet, J.A.; Coull, B.; Demokritou, P.; Oyola, P.; Garcia, J.; Gramsch, E. Analysis of PM10, PM2.5, and PM2.5–10
Concentrations in Santiago, Chile, from 1989 to 2001; J. Air & Waste Manage. Assoc. 2005, 55, 342-351.
11. Chang, T.J. Numerical Evaluation of the Effect of Traffic Pollutant on Indoor Air Quality of a Naturally Ventilated Building; J. Air & Waste Manage. Assoc. 2002, 52, 1043-1053.
12. Ekberg, L.E;. Relationship between Indoor and Outdoor Contami-nants in Mechanically Ventilated Buildings; Indoor Air 1996, 6, 41-47. 13. Murakami, S.; Kato, S.; Nagano, S.; Tanaka, Y. Diffusion Characteristics of Airborne Particles with Gravitational Settling in a Convection-Dominant Indoor Flow Field; ASHRAE Trans. 1992, 98, 82-97. 14. Zhao, B.; Zhang, Z.; Li, X.; Huang, D. Comparison of Diffusion
Char-acteristics of Aerosol Particles in Different Ventilated Rooms by Nu-merical Method; ASHRAE Trans. 2004, 110, 88-95.
15. Lu, W.; Howarth, A.T.; Adam, N.; Riffat S.B. CFD Modeling and Mea-surement of Aerosol Particle Distributions in Ventilated Multizone Rooms; ASHRAE Trans. 1999, 105, 116-127.
16. Lu, W.; Howarth, A.T. Numerical Analysis of Indoor Aerosol Particle Deposition and Distribution in Two-Zone Ventilation System; Build. Environ. 1996, 31, 41-50.
17. Lu, W.; Howarth, A.T.; Adam, N.; Riffat, S.B. Modeling and Measure-ment of Airflow and Aerosol Particle Distribution in a Ventilated Two-Zone Chamber; Build. Environ. 1996, 31, 417-423.
18. Chung, K.C. Three-Dimensional Analysis of Airflow and Contaminant Particle Transport in a Partitioned Enclosure; Build. Environ. 1999, 34, 7-17.
19. Zhao, B.; Zhang, Y.; Li, X.; Yang, X.; Huang, D. Comparison of Indoor Aerosol Particle Concentration and Deposition in Different Ventilated Rooms by Numerical Method; Build. Environ. 2004, 39, 1-8. 20. Jiang, Y.; Chen, Q. Study of Natural Ventilation in Buildings by Large
Eddy Simulation; J. Wind Eng. Ind. Aerodyn. 2001, 89, 1155-1178. 21. Ferziger, J. H.; Peric, M. Computational Methods for Fluid Dynamics, 3rd
ed.; Springer: Berlin, Germany, 2002.
22. Smagorinsky, J. General Circulation Experiments with the Primitive Equations, I. The Basic Experiment. Mon. Weather Rev. 1963, 91, 99-164.
23. Zhang, W.; Chen, Q. Large Eddy Simulation of Indoor Airflow with a Filtered Dynamic Subgrid Scale; Int. J. Heat Mass Transfer 2000, 43, 3219-3231.
24. Chang, T.J.; Hsieh, Y.F.; Kao, H.M. Numerical Investigation of Airflow Pattern and Particulate Matter Transport in Naturally Ventilated Multi-Room Buildings; Indoor Air 2006, 16, 136-152.
25. Ciofalo, M. Large-Eddy Simulations of Turbulent Flow with Heat Transfer in Simple and Complex Geometries Using Harwell-Flow 3D; Appl. Math. Model. 1996, 20, 262-271.
26. Li, A.; Ahmadi, G. Dispersion and Deposition of Spherical Particles from Point Sources in a Turbulent Channel Flow; Aerosol Sci. Technol.
1992, 16, 209-226.
27. Hinds, W.C. Aerosol Technology: Properties, Behavior, and Measurement of Airborne Particles, 2nd ed.; John Wiley & Sons: New York, NY, 1999. 28. Nazaroff, W.W.; Alvarez-Cohen, L. Environmental Engineering Science;
Wiley: New York, NY, 2001.
About the Authors
Tsang-Jung Chang is an associate professor in the Depart-ment of BioenvironDepart-mental Systems Engineering, National Taiwan University, Taipei, Taiwan, Republic of China. Hong-Ming Kao is a Ph.D. student and Yi-Fang Hsieh is a research assistant in the same department. Address corre-spondence to: Tsang-Jung Chang, Department of Bioenvi-ronmental Systems Engineering, National Taiwan Univer-sity, 1, Section 4, Roosevelt Rd., Taipei 106, Taiwan, Republic of China; phone:2-23622977; fax: ⫹886-2-23635854; e-mail: tjchang@ntu.edu.tw.