Major Depression Disorder (MDD) Identification Based on HRV Analysis
under the stress of attention test
Tsu-Wang Shen
1*, Fang-Chih Liu
1, William Shao-Tsu Chen
2Department of Medical Informatics, Tzu Chi University, Hualien, Taiwan
1Department of Psychiatry, Tzu Chi General Hospital, Hualien, Taiwan
2Abstract
Major Depression Disorder (MDD) is a mental disorder with symptoms, such as low self-esteem, and loss of interest or pleasure in normally enjoyable activities. It is an important issue which impacts various aspects of society. the aim of this research is to understand the physiological mechanism of depression based on heart rate variability (HRV) in both time and frequency domain, and to develop the evaluation criteria for classifying MDD based on HRV features. The HRV do show the significant difference between the MDD subjects and the healthy controls. Especially, the HF, corresponding to parasympathetic system, is the most distinguishable between two groups. According our study, the MDD subjects have lower regulation on sympathetic or parasympathetic activities, and the healthy subjects have active physiological regulation on ANS. That is the healthy subjects can control the sympathetic or parasympathetic system between two states better.
1. Introduction
Depression is a significant public health concerned worldwide. WHO (2000) reported that depression
becomes as one of the most important issue in 21st century. Its life-prevalence rate is up to 25%. There are about 3% of the populations who suffer for depression each year. For example, in year 1993, there are 120 million people suffering for depression around the world [1, 2]. Moreover, major depression disorder (MDD) is a mental disorder with symptoms, such as low self-esteem, and loss of interest, or pleasure in normally enjoyable activities. Therefore, it is an important issue which impacts various aspects of society indeed.
1.1 Major depression disorder (MDD)
The most widely used criteria for diagnosing depressive conditions are found in the American Psychiatric Association's revised fourth edition of the Diagnostic and Statistical Manual of Mental Disorders (DSM-IV-TR), and the World Health Organization's International Statistical Classification of Diseases and Related Health Problems (ICD-9) which uses the name recurrent depressive disorder.[3]
Based on above documentation, MDD is classified as a mood disorder in DSM-IV-TR. The diagnosis hinges on the presence of a single or recurrent major depressive episode [3, 4]. A major depressive episode
is characterized by the presence of a severely depressed mood that persists for at least two weeks. An episode with certain psychotic features, commonly referred to as psychotic depression, is rated as severe by physician’s diagnosis. In the clinical point of view, however, the physiological signals such as ECG, EEG, EMG are classified MDD are not currently ready on the disorder.
1.2 Major depression disorder with HRV
Some pioneer studies have been done previously. Gorman [5] studied the relationship between MDD and HRV features. They found the reduction in autonomic nervous system activity on MDD patients, links psychopathology status to heart diseases in the frequency. Ironically, Sayar [6] studied the relationship between MDD and HRV in time domain features, and they found there was no statistically significant difference between the study and control groups on rMSSD, pNN50, SDNN,SDNN index, SDANN features by analysis of HRV. No significant relationship between the levels of anxiety and depression and HRV measures were found.
Hence, the aim of this research is to understand the physiological mechanism of depression based on heart rate variability (HRV) in both time and frequency domain, and to develop the evaluation criteria for classifying MDD based on HRV features.
2. Method
2.1 Experiment Setup and Data Acquisition
This study is under Tzu Chi Hospital IRB097-29 regulation. We invited the patients who were diagnosed as major depressive disorder (MDD; ICD-9: 296.2, 296.3) at Department of Psychiatry, Tzu Chi General Hospital, Hualien, Taiwan. We collected data from MDD and healthy control groups (42 people each, including 17 males and 25 females) with matched gender and age. Their age range is between 18 and 65, as list in Table 1.
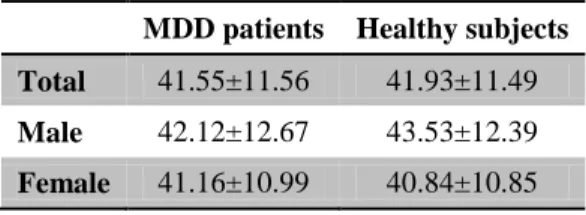
Table 1. Mean and standard deviation on age
MDD patients Healthy subjects Total 41.55±11.56 41.93±11.49
Male 42.12±12.67 43.53±12.39
Female 41.16±10.99 40.84±10.85
The MP35 (BioPack Inc.) with the Biopac Student Lab PRO was applied for data acquisition in this study. MATLAB R2007a (The MathWorks Inc., Natick, MA) and SPSS 12.0 for Windows (Copyright c SPSS Inc., 1989-2003) were used for signal processing and statistic data analysis [12].
All data collected in morning between 9:00am~12:00pm to fix the possible factors. The electrocardiogram (ECG) was sampled at 500Hz. The subjects were recorded ECG signals for 2 minutes at rest and about 22 minutes during attention test (TOVA).
TOVA is a kind of computerized visional attention test. When subjects notice the targets, they press the response button. Figure 1 describes the target and the
non-target events, which stay 2ms in every 100ms for attention measurement.
(a) (b)
Figure 1. (a) Target (b) Non-target events on TOVA test
2.3 Digital Signal Processing
The processing flow chart (figure 2) of our digital signal process includes interference remove, R point detection, and HRV analysis.
Figure 2. The flow chart of digital signal process
Chazal de [7] et al. provided a method to remove baseline wander. Then the method subtracts baseline wonder from original ECG to derive the ECG without baseline shifting. It applied a 200 milliseconds first median filter to remove QRS complexes and P wave, then the signal passes through a 600 milliseconds median filter to omit the T wave. Hence, the baseline
wander is obtained and the process is depicted in figure 3. Then, finite impulse response (FIR) filter are applied to remove power line interference at 60Hz and its resonance frequencies. 0 5 10 15 20 25 30 -1 -0.5 0 0.5 1 Seconds mV (a) 0 5 10 15 20 25 30 -1 -0.5 0 0.5 1 Seconds mV (b) 0 5 10 15 20 25 30 -1 -0.5 0 0.5 1 Seconds mV (c)
Figure 3. (a) Original ECG (b) Baseline wanders (c) ECG without baseline wander
After filtering all above noise, Pan and Tompkins method [8, 9] was applied for the real-time QRS detection. The flow diagram of R wave detection is showed in figure 4.
Filtered ECG Differentiation Square
Thresholds
R Points Average
Figure 4. The flow chart for R wave detection
There are two kinds of HRV analysis [9-11, 14, 15]: time-domain and frequency-domain. In time domain, HRV measures the beat-to-beat (RR) intervals. The time domain features include the mean and standard deviation (SDNN) of the RR intervals. There are also other commonly used parameters such as coefficient of
variation (CV), root mean square of standard deviation (RMSSD), standard deviation of standard deviation (SDSD), NN50, pN50, where the NN50 is the number of consecutive RR intervals differing more than 50ms, and the pNN50 is the percentage value of NN50 intervals.
In the frequency-domain analysis, features are obtained from the power spectrum of the RR series. In general, fast Fourier transform (FFT) and autoregressive (AR) model are applied on RR tachogram with 4Hz resample rate to obtain the frequency power spectra. The frequency bands are divided into very low frequency (VLF), low frequency (LF), and high frequency (HF) bands. The most common frequency-domain parameters include the total power (TP), very low frequency (VLF: 0.003 ~ 0.04 Hz), low frequency (LF: 0.04 ~ 0.15 Hz), high frequency (HF: 0.15 ~ 0.4Hz), and the LF to HF ratio [15]. Hence, the energy in the certain frequency bands can be calculated by sum of the area under the energy spectral density curve.
In general, total power (TP) represents the number of the degree of autonomic nervous system. VLF is still not well known, but it had been attributed to thermal regulation of the body's internal systems. LF is mainly driven by sympathetic activity. HF is driven by respiration and appears to derive mainly from vagal activity or the parasympathetic nervous system. The ratio of low-to-high frequency spectra power (LF/HF) is has been proposed as an index of sympathetic to parasympathetic balance of heart rate fluctuation [10, 11].
2.4 Statistic analysis
After HRV analysis, the independent samples t-test was applied on each extracted features. Also, within each group, the paired samples t-test was applied to analysis different mental stages (i.e., rest and attention). Those analyses can indicate good features to classify MDD and control group, and which mental stages may affect above HRV features more.
2.5 Artificial Neural Networks classification -
Back-propagation (BP)
Back propagation neural network (BPNN) is a supervised neural network. BPNN is a well known artificial neural network. BPNN includes three layers: input layer, hidden layer, and output layer. Sigmoid function was used as an activation function. At input layer, for data standardization, all HRV data are normalized by formula . The output of j-th neuron in output layer is given by
where is the sum of the j-th neuron in output layer
where is the weight between h-th neuron in hidden layer and j-th neuron in output layer, is the output of h-th neuron in hidden layer, is the bias of j-th neuron in output layer. The output of h-th neuron in hidden layer is given by
where is the sum of the h-th neuron in hidden layer
where is the weight between i-th neuron in input layer and h-th neuron in hidden layer, is the i-dimensional input data, is the bias of h-th neuron in hidden layer.
In this research, our training data includes 50 subjects, 25 for MDD and 25 for healthy subjects, and the testing data included 34 subjects, 17 each.
3. Results
3.1 Statistic analysis results
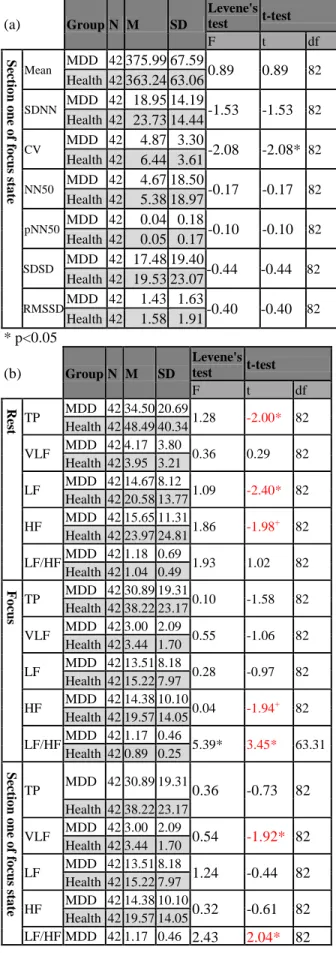
At first, the independent samples t-test shows whether features are significant to distinct in different groups. In the time domain, like as the previous study [6], there is no feature shown significance in the t-test. However, different with previous study, CV becomes significant during attention test. The results are listed in Table 2.
In the frequency domain, the features (TP, LF and HF at the rest state; HF and LF/HF during attention test) showed significance on t-test. It has to be notice that HF showed significance on t-test for both mental tasks. That is, it is an important factor for identification of MDD and normal controls without no mental task influence.
Table 2. Results from SPSS12 for independent sample t-test in (a) time domain (during attention test) (b) frequency domain (both statues)
(a) Group N M SD Levene's test t-test F t df S ec tio n o n e o f fo cu s sta te Mean MDD 42 375.99 67.59 0.89 0.89 82 Health 42 363.24 63.06 SDNN MDD 42 18.95 14.19 -1.53 -1.53 82 Health 42 23.73 14.44 CV MDD 42 4.87 3.30 -2.08 -2.08* 82 Health 42 6.44 3.61 NN50 MDD 42 4.67 18.50 -0.17 -0.17 82 Health 42 5.38 18.97 pNN50 MDD 42 0.04 0.18 -0.10 -0.10 82 Health 42 0.05 0.17 SDSD MDD 42 17.48 19.40 -0.44 -0.44 82 Health 42 19.53 23.07 RMSSD MDD 42 1.43 1.63 -0.40 -0.40 82 Health 42 1.58 1.91 * p<0.05 (b) Group N M SD Levene's test t-test F t df Re st TP MDD 42 34.50 20.69 Health 42 48.49 40.34 1.28 -2.00* 82 VLF MDD 42 4.17 3.80 0.36 0.29 82 Health 42 3.95 3.21 LF MDD 42 14.67 8.12 1.09 -2.40* 82 Health 42 20.58 13.77 HF MDD 42 15.65 11.31 1.86 -1.98+ 82 Health 42 23.97 24.81 LF/HF MDD 42 1.18 0.69 1.93 1.02 82 Health 42 1.04 0.49 Fo cu s TP MDD 42 30.89 19.31 0.10 -1.58 82 Health 42 38.22 23.17 VLF MDD 42 3.00 2.09 0.55 -1.06 82 Health 42 3.44 1.70 LF MDD 42 13.51 8.18 0.28 -0.97 82 Health 42 15.22 7.97 HF MDD 42 14.38 10.10 0.04 -1.94+ 82 Health 42 19.57 14.05 LF/HF MDD 42 1.17 0.46 5.39* 3.45* 63.31 Health 42 0.89 0.25 S ec tio n o n e o f fo cu s sta te TP MDD 42 30.89 19.31 0.36 -0.73 82 Health 42 38.22 23.17 VLF MDD 42 3.00 2.09 0.54 -1.92* 82 Health 42 3.44 1.70 LF MDD 42 13.51 8.18 1.24 -0.44 82 Health 42 15.22 7.97 HF MDD 42 14.38 10.10 0.32 -0.61 82 Health 42 19.57 14.05 LF/HF MDD 42 1.17 0.46 2.43 2.04* 82
Health 42 0.89 0.25
* p<0.05; + 0.05<p<0.06
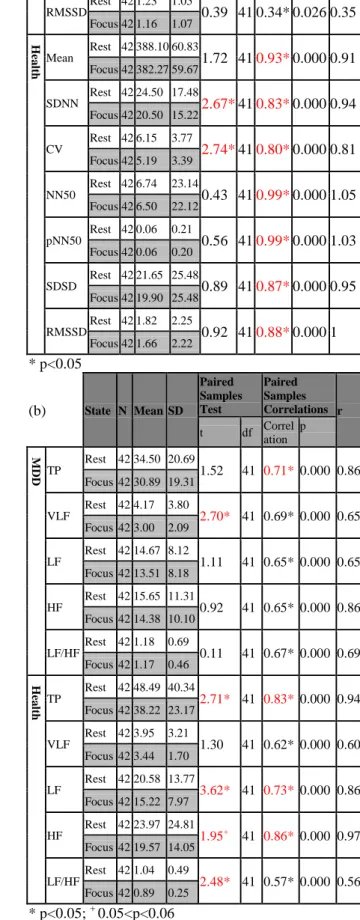
Moreover, the paired samples t-test was applied understand if the same person’s HRV features are distinguishable and correlated on different mental tasks. According to the results, the healthy subjects on ANS regulation are much better than MDD subjects. For healthy subjects, the features in time (SDNN, CV) and frequency (TP, LF, HF, LF/HF) domain are distinguishable on different mental statues. That says the healthy subjects have ANS physiology changes when they faced to attention test. However, the same thing is not applicable on MDD group. Their ANS physiology mechanism may not functional well.
For correlation evaluation, it is found that the most of HRV features on healthy subjects are highly correlated with the features in the attention test. However, such correlation is reduced on MDD group.
Table 3. Results on the paired samples t-test (a) for time domain (b) for frequency domain
(a) State N Mean SD Paired Samples Test Paired Samples Correlations r t df Correl ation p M D D Mean Rest 42 375.86 68.71 0.86 410.98*0.000 0.88 Focus 42 373.95 69.17 SDNN Rest 42 18.49 10.92 1.56 410.57*0.000 0.62 Focus 42 16.12 10.17 CV Rest 42 4.95 2.78 1.87 410.46*0.002 0.46 Focus 42 4.18 2.28 NN50 Rest 42 7.00 25.25 1.33 410.94*0.000 0.77 Focus 42 4.92 18.04 pNN50 Rest 42 0.06 0.23 1.26 410.93*0.000 0.71 Focus 42 0.05 0.18 SDSD Rest 42 15.41 12.89 0.58 410.27 0.082 0.26 Focus 42 14.06 12.14 RMSSD Rest 42 1.23 1.05 0.39 410.34*0.026 0.35 Focus 42 1.16 1.07 Hea lt h Mean Rest 42 388.10 60.83 1.72 410.93*0.000 0.91 Focus 42 382.27 59.67 SDNN Rest 42 24.50 17.48 2.67*410.83*0.000 0.94 Focus 42 20.50 15.22 CV Rest 42 6.15 3.77 2.74*410.80*0.000 0.81 Focus 42 5.19 3.39 NN50 Rest 42 6.74 23.14 0.43 410.99*0.000 1.05 Focus 42 6.50 22.12 pNN50 Rest 42 0.06 0.21 0.56 410.99*0.000 1.03 Focus 42 0.06 0.20 SDSD Rest 42 21.65 25.48 0.89 410.87*0.000 0.95 Focus 42 19.90 25.48 RMSSD Rest 42 1.82 2.25 0.92 410.88*0.000 1 Focus 42 1.66 2.22 * p<0.05 (b) State N Mean SD Paired Samples Test Paired Samples Correlations r t df Correl ation p M D D TP Rest 42 34.50 20.69 1.52 41 0.71* 0.000 0.86 Focus 42 30.89 19.31 VLF Rest 42 4.17 3.80 2.70* 41 0.69* 0.000 0.65 Focus 42 3.00 2.09 LF Rest 42 14.67 8.12 1.11 41 0.65* 0.000 0.65 Focus 42 13.51 8.18 HF Rest 42 15.65 11.31 0.92 41 0.65* 0.000 0.86 Focus 42 14.38 10.10 LF/HF Rest 42 1.18 0.69 0.11 41 0.67* 0.000 0.69 Focus 42 1.17 0.46 Hea lt h TP Rest 42 48.49 40.34 2.71* 41 0.83* 0.000 0.94 Focus 42 38.22 23.17 VLF Rest 42 3.95 3.21 1.30 41 0.62* 0.000 0.60 Focus 42 3.44 1.70 LF Rest 42 20.58 13.77 3.62* 41 0.73* 0.000 0.86 Focus 42 15.22 7.97 HF Rest 42 23.97 24.81 1.95+ 41 0.86* 0.000 0.97 Focus 42 19.57 14.05 LF/HF Rest 42 1.04 0.49 2.48* 41 0.57* 0.000 0.56 Focus 42 0.89 0.25 * p<0.05; + 0.05<p<0.06
3.2 Artificial Neural Network classification
Twelve features (7 from time domain and 5 from frequency domain) are applied for ANN classification. The network structure was set as 12-10-2. We found the MDD Identification under the stress of attention test is more distinguishable than rest status. Thus, the system has the 100% accuracy on training data and 61.76% accuracy on testing data. The confusion matrix is shown at Table 4.
Table 4. Confusion matrix (a) of training data average (b) of testing data (a) Predicted MDD Health Actual MDD 25 0 Health 0 25 (b) Predicted MDD Health Actual MDD 11 6 Health 7 10
4. Discussions & Conclusions
The HRV do show the significant difference between the MDD subjects and the healthy controls. Especially, the HF, corresponding to parasympathetic system, is the most distinguishable between two groups. According our study, the MDD subjects have lower regulation on sympathetic or parasympathetic activities, and the healthy subjects has more regulation on ANS. That is the healthy subjects can control the sympathetic or parasympathetic system between two states better. Finally, the research also showed that the HRV of two
groups may have transition effects when mental statues of subjects change.
5. Acknowledges
This research supported by Tzu Chi University / General Hospital and the grand project serial number is TCMRC-P-97006.
6. References
[1] H. J. Yang, "The Study of Chinese Medical Syndrome Differentiation with Western Medicine Confirmatory on Depressive Disorder," in Department of physical education. vol. MD: National Pingtung
University of Education, 2008, p. 138. [2] Y.-C. Lai, "The Effects of Adult Attachment,
Conflict Resolutions, and Interpersonal Conflicts on Depressive Symptoms in College Students," in Institute of Behavioral Medicine. vol. MD: National Cheng Kung University, 2006, p. 97.
[3] t. f. e. From Wikipedia, "Major depressive disorder."
[4] A. P. Association, Diagnostic and statistical
manual of mental disorders, Fourth Edition, Text Revision: DSM-IV-TR., 4 ed. Washington,
DC: American Psychiatric Publishing, Inc., 2000.
[5] J. Gorman and R. Sloan, "Heart rate variability in depressive and anxiety disorders," American Heart Journal, vol. 140, pp. S77-83, 2000.
[6] K. Sayar, H. Güleç, M. Gökçe, and İ. Ak, "Heart rate variability in depressed patients,"
Bull Clin Psychopharmacol, pp. 130-133,
2002.
[7] P. H. de Chazal, C. Sheridan, E. Reilly, R. Nolan, P. O'Malley, M., "Automated processing of the single-lead electrocardiogram for the detection of obstructive sleep apnoea.," Biomedical Engineering, IEEE Transactions on, vol. 50,
pp. 686-696, 2003.
[8] V. X.Afonso, "ECG QRS Detection," in
Biomedical Digital Signal Processing, W. J.
Tompkins, Ed. Upper Saddle River, New Jersey: PRENTICE HALL, 2000, pp. 236-264. [9] C.-C. Lin, "A Cardiac Health Expert System
Based On Electrocardiogram(ECG)," in
Department of Medical Informatics. vol. MD:
Tzu Chi University, p. 75.
[10] t. f. e. From Wikipedia, "Heart rate variability."
[11] M. Malik and A. Camm, Heart Rate
Variability: Futura Publishing Company, 1995.
[12] D. George and P. Mallery, SPSS for Windows
Step by Step: A Simple Guide and Reference, 12.0 Update, 5 ed., 2005.
[13] t. f. e. From Wikipedia, "Support vector machine."
[14] Marek Malik, et al., “Guidelines: Heart Rate Variability, Standards of measurement, physiological interpretation, and clinical use”,
European Heart Journal, 1996:17: 354–381.
[15] TW Shen*, YT Tsao, "An Investigation on Autonomic Effects by Using PR Intervals",