doi:10.1136/jech.2008.082230
Apr 2009;
2009;63;625-632; originally published online 12
J Epidemiol Community Health
C Chiao, L-J Weng and A Botticello
cohort
in Taiwan? The role of social position and birth
Do older adults become more depressed with age
http://jech.bmj.com/cgi/content/full/63/8/625
Updated information and services can be found at:
These include:
References
http://jech.bmj.com/cgi/content/full/63/8/625#BIBL
This article cites 33 articles, 6 of which can be accessed free at:
Rapid responses
http://jech.bmj.com/cgi/eletter-submit/63/8/625
You can respond to this article at:
service
Email alerting
the top right corner of the article
Receive free email alerts when new articles cite this article - sign up in the box at
Topic collections
(59 articles)
Longitudinal studies(21241 articles)
Epidemiologic studiesArticles on similar topics can be found in the following collections
Notes
http://journals.bmj.com/cgi/reprintform
To order reprints of this article go to:
http://journals.bmj.com/subscriptions/
go to:
Journal of Epidemiology and Community Health
To subscribe to
Do older adults become more depressed with age in
Taiwan? The role of social position and birth cohort
C Chiao,
1L-J Weng,
2A Botticello
31Institute of Health and Welfare Policy, College of Medicine, National Yang-Ming University, Taipei, Taiwan;2Department of Psychology, College of Science, National Taiwan University, Taipei, Taiwan;3Kessler Foundation Research Center and Department of Physical Medicine and Rehabilitation, UMDNJ–New Jersey Medical School, USA
Correspondence to: Dr C Chiao, Institute of Health and Welfare Policy, College of Medicine, National Yang-Ming University, Taipei, Taiwan; cchiao@ym.edu.tw Accepted 22 February 2009
ABSTRACT
Background: Depression is one of the most commonly encountered mental health problems during older adult-hood. This study examines differences in depressive symptom trajectories among older Taiwanese adults across two birth cohorts (1920–1924 and 1925–1929), and explores the relationships between socioeconomic position (SEP) variables and symptom trajectories. Methods: Data from the Taiwan Longitudinal Study on Aging (TLSA) collected between 1989 and 2003 were analysed. The nationally representative sample is com-posed of community-living adults (n = 2458) in Taiwan aged 60 years and above. Two distinct domains of depressive symptomatology, negative affect and lack of positive affect, assessed by the short form of the Center of Epidemiological Studies–Depression (CES-D) scale were used for all the analyses. Growth curve models were employed to assess the trajectories of depressive symptoms over time.
Results: The relationship between ageing and depressive symptoms appeared linear with a minor curvilinear effect. The depressive symptoms in negative affect increased with age (mean linear growth rate = 0.26, p,0.001) but levelled off (mean quadric growth rate = 20.01, p,0.001), while the symptoms in lack of positive affect displayed an opposite trend. The effects of SEP variables also differed by cohort and outcome domain.
Conclusions: Remaining active, living with family and having a high level of education are associated with positive affect later in life, while financial strain and poor health are strongly related to negative affect. These results underline the continued role that SEP plays in psychological adjustment over the course of one’s life, independently of ageing.
Owing to the rapid decline in fertility and increased longevity in recent years, Taiwan is experiencing a dramatic demographic transition in which the overall proportion of older adults in the population is increasing.1 In 2007,
approxi-mately 10% of the population comprised older adults, bringing the number of persons aged 65 years or older in Taiwan to more than two million.2
However, relatively little is known about the health and well-being of this segment of the population, particularly with regard to the unique mental health issues faced by older adults.3
Depression is one of the most commonly encountered mental health problems during older adulthood,4 5 and it often seriously affects the
health, functioning and quality of life of indivi-duals and their families.6–9Depression among older
adults is often related to physical symptoms resulting from chronic diseases or other impair-ments during later life. In addition, ageing is
commonly accompanied by stressful social changes such as retirement, widowhood, changes in living arrangements and alterations in financial circum-stances that have also been shown to increase the risk of depressive symptoms.
An increase in the prevalence of depressive symptoms among older adults in Taiwan has been noted in the literature.10 11
Some studies attribute the rise in rates of emotional distress generally to the ageing process, while others suggest that this relationship varies across different cohorts of older adults.12–16 The observed cohort differences imply
that shared experiences, including common expo-sures to certain social, historical or political events, may render some individuals more vulnerable to emotional distress during their later years than others. For example, the industrialisation of Taiwan in the twentieth century changed labour market participation, with large numbers of people migrating to industrialised areas to work in factories. As a result of this massive relocation, the traditional family structures of communal living arrangements among several generations have declined. The loss of the social support inherent in these relationships, particularly as people age, is likely to increase the risk of psychological distress mental health among those who experienced these changes in comparison with those who did not.
The occurrence of depressive symptomatology has also been shown to differ by indicators of social stratification, suggesting that the risk of depressive symptoms also stems from social inequality.17–19
Specifically, rates of depressive symptoms are higher among historically disadvantaged social groups such as older adults, women and ethnic minorities.13 19 Research also shows that the rates
of psychological distress are higher for individuals with limited social and economic resources in comparison with individuals of relative afflu-ence.20–22 Chronic health problems also correlate
with depressive symptoms among older people. Physical impairments that result from chronic diseases have been shown to be associated with higher levels of depression.23–26
Most work investigating the risk of mental health problems among older adults is based on community studies of western populations. In comparison, relatively few population-based inves-tigations have been conducted in Asian societies. In addition, much of the previous research has used cross-sectional survey data, resulting in the con-founding of age and cohort effects when assessing risks of depressive symptoms among older adults.9 16 Previous work in this area has also
construct of depressive symptomatology in older adults. Recent studies on subjective well-being have suggested that emotional distress is more accurately assessed by examining distinct dimensions of depressive symptoms.24 The objective of this
study is to examine both the negative and the lack of positive affect domains of psychological distress as part of our investigation into the longitudinal relationship between ageing and depressive symptoms. In particular, this study will assess the role of age, birth cohort and socioeconomic position differences in the symptom trajectories across each domain.
METHODS
Sample design and data collection
This study analysed the existing data from the Taiwan Longitudinal Study on Aging (TLSA). The dataset was collected by the Bureau of Health Promotion of the Taiwan Health Department from 1989 to 2003. This longitudinal survey was designed to study the impact of socioeconomic development on the physical and emotional well-being of the older adult population in Taiwan. A multistage, equal probability sampling frame was used to obtain a nationally representative sample of both community-dwelling and institutionalised older adults. In the first stage of the design, a sample of 56 townships was selected from 331 non-aboriginal administrative units. Subsequently, blocks (lins) were sampled within each of the selected townships. Finally, residents of the sampled blocks aged 60 years or older as of 31 December 1988 were randomly selected for study participation.
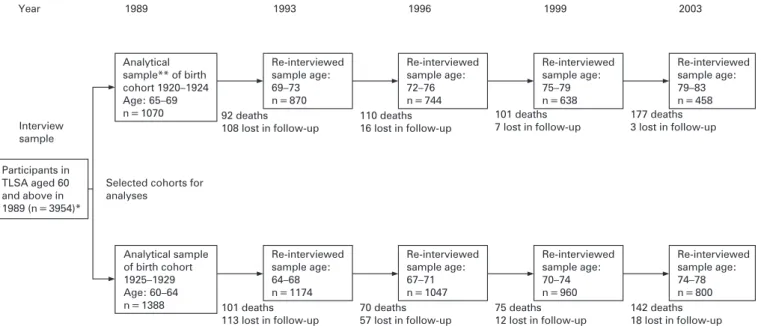
Baseline interviews were conducted in 1989, with follow-up surveys administered in 1993, 1996, 1999 and 2003. A total of 4049 out of the 4412 sampled individuals completed the initial face-to-face interviews in 1989, and 3954 of these belonged to three ethnic groups. The response rates were 92%, 91%, 89%, 90% and 91% for each wave of data collection. For the purpose of this study, the sample is restricted to the members of two birth cohorts (1920–1924 and 1925–1929) and uses the complete data collected with the 10 items of the CES-D scale. This yielded a final analytical sample of 1070 for the 1920–1924 birth cohort and 1388 for the 1925–1929 birth cohort. Figure 1 shows the flow of participants across five waves in terms of the two birth cohorts.
Attrition is of particular importance to longitudinal research because older adults are typically in poorer health than younger population groups, making them the most difficult to retain over the complete study period. We assessed differences in individual background, socioeconomic status and physical health between continuing participants and drop-outs across waves (results not shown). The analyses indicated that the proportion of men relative to women declined over the course of the data collection. The proportions of older adults with lower education in the analytical samples also decreased across the five waves. As for physical health status, the proportion of older adults with spur formation and arthritis in the analytical samples did not change significantly across waves. Death was the major cause of the decline in sample size.
Depressive symptomatology
Depressive symptomatology was measured by a 10-item version of the CES-D scale at each wave of the TLSA survey. The original 20-item CES-D has been widely used in survey research to assess emotional distress,27and has demonstrated validity and
reliability for use among older adults and Asian populations.28
The 10 CES-D items adopted in TLSA across waves are listed in
the Appendix. Each item was rated on a four-point scale, indicating the frequency of experiencing each symptom in the past week. Responses were reverse scored when necessary such that higher scores represent greater levels of depressive symptomatology. The original development of the CES-D scale consisted of multiple aspects of psychological distress.27
Preliminary factor analyses on the 10 items also revealed three factors, two of which were highly correlated (results not shown). For simplicity, the present study combined the items from the two highly correlated factors into one domain representing negative affect. The third factor included two items, feeling joyful and life going well, which were combined and recoded into a domain of lack of positive affect. The total score on this domain ranged from 0 to 6 and yielded very good internal consistency and reliability (a = 0.79–0.95) across the waves. The other eight CES-D items in the negative affect domain had a total score ranging from 0 to 24 with good internal consistency and reliability across the waves (a = 0.79– 0.87).
Age and birth cohort
Age was measured in years based on participant’s age at last birthday in each wave. Birth year was calculated by subtracting participant age in 1989 from the survey year 1989. Two birth cohort groups were analysed with the younger cohort born over the period 1925–1929 and the older cohort born over the period 1920–1924. Birth cohort is represented in all analyses as a dichotomous variable (0 = 1925–1929, 1 = 1920–1924).
Other measures
The other analytical variables included in this study were individual sociodemographic characteristics, socioeconomic position (SEP), life-related stressors and physical health status assessed in the initial survey. The sociodemographic variables included gender and ethnicity, with the latter categorised as Fukianese, Hakka and Mainlander (born in mainland China). SEP was assessed in terms of education level and work status. Levels of completed education included illiterate, incomplete primary education, completed primary education and high school graduate and above. Work status in this sample assesses the individual’s employment status and household contribution given that older adults, particularly those with family living arrangements, continue to contribute to the household with unpaid work (eg, caregiving and housekeeping) after the official retirement age of 65 years. This operationalisation of the construct work status is necessary given that the majority of the older cohort (aged 65–69 years) in this study (73%) reported no longer participating in paid employment. In contrast, approximately 45% of the younger cohort had regular work. The presence of family members in the immediate environment is a source of both stress and social support for older adults.20 29
Therefore, life-related stressors salient to mental health, including family living arrangements and financial hardship, were included in the analysis. Family living arrangements contained two categories: living alone and living with extended family members. For older adults, the subjective experience of economic strain is more closely related to emotional distress in comparison to income.30Financial hardship was thus assessed
by asking older adults whether they had enough living expenses or experienced a shortage of living expenses. Lastly, physical health was assessed by the presence or absence of two common chronic health problems related to physical functioning limita-tions: spinal spur and arthritis.
Data analysis
Stata31
was used for data management and analysis. Growth curve models were estimated within a multilevel modelling framework.32 33
These models include two parts: the symptom trajectories within individuals over five time points (Level 1) and variation of these trajectories across the entire sample of older adults (Level 2). The intercept at Level 1 is the individual’s initial status, representing that person’s baseline symptom level, and the slope indicates the rate of change across time. At Level 2, the means and the variances of individual intercepts and rates of changed were estimated. The random intercept and slope models in the gllamm program of Stata were specified for estimation of these individual symptomatology trajectories.34
Using a progressive modelling strategy, a null model with time only was first estimated to assess the overall relationship between age and each domain of depressive symptoms. Then, the adjusted estimates were obtained after inclusion of the other variables. In this step analysis, we also included an interaction term of family living arrangement with gender suggested by previous studies.35–37
In analyses not shown here, we also tested for interactions between gender and other key SEP variables, such as education, to see whether socioeconomic effects varied by gender for each cohort. However, none of these interactions added significantly to the models, and they are not included in the models. All the analyses above were carried out separately for the two domains of depressive symptomatology across each cohort using the maximum likelihood estimation method. The final analyses were conducted with data from two cohorts pooled together using a dummy variable to indicate cohort groups. In addition to an interaction term of living arrangement with gender in the prior analyses, we also included another interaction term of cohort with gender to explore the possible cohort differentials in psychological distress by gender.
RESULTS
Table 1 presents the characteristics of study participants at the initial interview in 1989 across the two birth cohorts by gender. Compared with men, a higher percentage of women reported
being illiterate, employment in terms of assisting family, living alone and having chronic physical health problems. Compared with the younger cohort, a greater portion of the older cohort reported being illiterate, unemployed and living alone.
A growth curve model was used to examine the relationship between age and each domain of depressive symptomatology. Table 2 presents the results for negative affect. The null model depicting the overall shape of the symptom trajectories showed significant linear and modest curvilinear trends for both cohorts. Depressive symptomatology gradually increases with age and then levels off, as demonstrated by the negative mean acceleration coefficients. In the adjusted models, the addition of other variables did not alter the symptom trajectories estimated in the null model. Across both birth cohorts, low levels of negative affect were associated with being male, full- or part-time employment, living with family, lacking financial hardship and being free from chronic physical health problems. Contrary to expectations, no significant ethnic differences were found for negative affect. In the model with all cohorts, the findings from main cohort effect and its interaction effect with gender indicated that older cohorts have higher levels of negative affect symptoms, and women in the older cohorts had particularly higher levels of symptoms.
Table 3 presents the results for lack of positive affect. In contrast to the negative affect domain, symptoms of lack of positive affect decrease over time as indicated by the negative coefficients representing growth. A moderately significant curvilinear trajectory emerges for both cohorts. As the survey participants aged, they reported feeling joyful and that life was going well less frequently. This relationship persists even after adjusting for other variables, although the results for both domains of depressive symptomatology indicated an approxi-mately 50% reduction in the variance of the intercept in the adjusted models compared with the null models. This suggests that variation in both the negative and lack of positive affect domains of depressive symptomatology is influenced in part by social location, that is by individual SEP. The results in the adjusted models for both cohorts demonstrate an association Figure 1 Participants in serial surveys in the Taiwan Longitudinal Study on Aging (TLSA) between 1989 and 2003. *Initial sample included 4049 older adults aged 60 years and above. This study focused on three ethnic groups, and this selection yielded a total sample of 3954 at the baseline interview. **Analytical sample only included older adults who self-responded to the CES-D with valid responses.
between lower symptom levels and higher education levels as well as perceived financial adequacy. Being employed was associated with lower symptom levels for the older cohort but not for the younger cohort. Living alone was associated with higher levels of depressive symptomatology for the younger cohort but not for the older cohort. Unexpectedly, no significant gender or ethnic difference was found for either cohort or for the pooled data for the lack of positive affect, and there was no significant cohort difference. No significant interactions were found between cohort and sex as well as between living arrangement and sex.
DISCUSSION
On the basis of a population-based sample with multiple assessments over a period of 14 years, this study demonstrated that levels of psychological distress increase with age among older adults in Taiwan. Growth curve modelling indicated that symptoms in negative affect increased over time and levelled off, while symptoms in lack of positive affect showed an opposite trend. The upward curve of trajectories in negative affect suggests that negative affect distress accumulates with age, particularly as physical health deteriorates and social stress increases.4 5The levelling off that follows may be attributed to a
survival effect, whereby healthier and happier people tend to live longer,3 14 as well as emotional maturation with age.38 In
contrast to the trajectories in lack of positive affect, the initial downward trend may be due to emotional maturation with age
as life experiences accumulated.14 38
Then, the increases in lack of positive affect symptoms that followed could be a consequence of accrued losses, such as loss of spouses, loss of friends, loss of independence and loss of the capacity to accomplish one’s ultimate life goals. In addition to cohort differences, the older cohort had higher levels of depressive symptoms in negative affect but not in the lack of positive affect.
Consistent with previous studies,19 23 we found that less
educated older adults were likely to report higher symptom levels and that this effect was the same for men and women.39
This analysis also demonstrated that limited economic resources are associated with high levels of negative affect and lack of positive affect, corroborating evidence for the role that SEP plays in eliciting poor mental health outcomes.40 41Older adults
who reported insufficient financial resources had significantly higher symptom levels across both cohorts, underlining the critical role that financial hardship plays in depressive symp-toms.29 42Consistent with the findings of Fiske et al,43we did not
find any gender difference for the lack of positive affect domain. This suggests that men and women have a similar propensity for positive affect in later life, whereas women are more likely than men to experience symptoms of negative affect.44 More
work is needed to explore the social and cultural implications of how the sexes differ in different aspects of depression as measured by the CES-D.
Our findings suggest that living with family is associated with a lower level of symptoms. Contrary to what has been Table 1 Participant characteristics by gender and birth cohort (%) at 1989 baseline interviews in the Taiwan Longitudinal Study on Aging (TLSA)
Characteristics
Women Men
Older cohort: born in 1920–1924 (aged 65– 69 years at baseline) n = 461
Younger cohort: born in 1925–1929 (aged 60– 64 years at baseline)
n = 509 p Value
Older cohort: born in 1920–1924 (aged 65– 69 years at baseline) n = 609
Younger cohort: born in 1925–1929 (aged 60–64 years at baseline) n = 879 p Value Sociodemographics Ethnicity Fukianese 72.23 74.66 0.237 51.40 48.69 0.320 Hakka 16.05 16.90 13.63 12.51 Mainlander 11.71 08.45 34.98 38.79 Socioeconomics Education Illiterate 65.08 52.46 0.001 19.87 13.31 0.000
Incomplete primary education 11.93 14.54 20.03 16.27 Completed primary education 16.05 23.18 29.72 36.29 High school graduate and above 06.94 09.83 30.38 34.13 Work status
No work 34.49 24.56 0.000 47.45 32.99 0.000
Full- or part-time work 11.06 22.99 39.08 57.11
Assisting family 54.45 52.46 13.46 09.90
Life-related stressor Family living arrangements
Living alone 45.77 30.26 0.000 26.27 22.75 0.119
Living with family 54.23 69.74 73.73 77.25
Perceived financial hardship
No 77.01 72.82 0.134 77.67 80.64 0.164
Yes 22.99 27.18 22.33 19.36
Physical health status Spur formation No 67.46 72.50 0.087 81.94 80.43 0.466 Yes 32.54 27.50 18.06 19.57 Arthritis No 59.65 64.17 0.148 77.50 76.88 0.778 Yes 40.35 35.83 22.50 23.12
observed in North America37
and Latin America,35 36
living with family has a protective effect against depressive symptoms among older people in Taiwan. Although the interaction between gender and living arrangement was non-significant in our analysis, the fact that over 70% of older Taiwanese men
lived with their family suggests that contingencies between gender and social support on mental health need further exploration. In contrast, a much larger proportion of women in this sample reported living alone, particularly among the older cohort. According to our results, women in Taiwanese society Table 2 Maximum likelihood estimates from the growth curve models with random intercept and slope for age trajectories of depressive symptomatology in the negative affect domain for the two cohorts in the Taiwan Longitudinal Study on Aging (TLSA) between 1989 and 2003
Older cohort: born in 1920–1924 Younger cohort: born in 1925–1929 All cohorts
Null model Adjusted model Null model Adjusted model Null model Adjusted model
Est. SE Est. SE Est. SE Est. SE Est. SE Est. SE
Symptom level, intercept
22.57*** 0.18 21.75*** 0.40 22.48*** 0.15 23.33*** 0.32 22.53*** 0.12 22.39*** 0.27
Mean growth rate, linear 20.29*** 0.05 20.30*** 0.04 20.24*** 0.04 20.22*** 0.04 20.26*** 0.03 20.26*** 0.03 Mean acceleration, quadratic 20.01*** 0.00 20.01*** 0.00 20.01*** 0.00 20.01*** 0.00 20.01*** 0.00 20.01*** 0.00 Cohort comparison (older vs younger) 20.37*** 0.17 Older cohort 6 female 20.81*** 0.27 Baseline background variables Sociodemographics Gender (ref = Male)
Female 21.07*** 0.40 20.50*** 0.36 20.34*** 0.30 Ethnicity (ref = Fukianese) Hakka 20.36*** 0.30 20.21*** 0.24 20.29*** 0.19 Mainlander 20.44*** 0.27 20.09*** 0.22 20.14*** 0.17 Socioeconomic position Education (ref = Illiterate) Incomplete primary education 20.03*** 0.31 20.37*** 0.27 20.21*** 0.21 Completed primary education 20.24*** 0.29 20.78*** 0.23 20.52*** 0.18 High school graduate and above
20.31*** 0.33 21.20*** 0.27 20.82*** 0.21 Work status (ref = No work) Full- or part-time work 20.58*** 0.25 21.00*** 0.20 20.80*** 0.15 Assisting family 20.44*** 0.26 20.99*** 0.24 20.73*** 0.18 Life-related stressor Family living arrangement (ref = Alone)
Living with family 20.93*** 0.32 20.70*** 0.26 20.82*** 0.20 Living with family
6 female
20.81*** 0.44 20.03*** 0.39 20.42*** 0.29
Financial hardship (ref = No)
22.97*** 0.25 22.44*** 0.20 22.70*** 0.16
Physical health status Chronic diseases
Spur formation (ref = No)
20.99*** 0.25 20.75*** 0.20 20.86*** 0.16
Arthritis (ref = No) 0.73*** 0.23 20.58*** 0.19 20.64*** 0.15 Random effects Var. SE Var. SE Var. SE Var. SE Var. SE Var. SE Variance in random intercept 26.41*** 0.97 23.22*** 20.54*** 24.18*** 0.71 21.92*** 0.67 25.21*** 0.58 22.65*** 0.52 Variance in random slope 20.01*** 0.01 20.01*** 0.004 20.02*** 20.01* 20.02*** 20.01* 20.01*** 20.01* 20.01*** 20.01* Variance in residuals 14.35*** 20.46* 14.30*** 20.39*** 13.41*** 0.36 13.42*** 0.36 13.78*** 0.27 13.78*** 0.28 Note: Null model depicts the age trajectory of depressive symptoms with no other variables included. Adjusted model shows the age trajectory of depressive symptoms with the variables related to sociodemographics, baseline socioeconomic status, life-related stressors and physical health conditions added.
*p,0.05; **p,0.01; ***p,0.001.
may be particularly vulnerable to emotional distress because of a lack of social support at the end of the life course, although more work is needed to explicate this relationship further.
Interestingly, our analyses did not find ethnic differences in depressive symptomatology across either symptomatology
domain. The lack of an effect for ethnicity may be because the social forces that elicit ethnic disparities as stigma or discrimination may not be as consequential here. We also did not find a significant association of health variables with depressive symptoms in lack of positive affect despite health Table 3 Maximum likelihood estimates from the growth curve models with random intercept and slope for age trajectories of depressive symptomatology in the lack of positive affect domain for the two cohorts in the Taiwan Longitudinal Study on Aging (TLSA) between 1989 and 2003
Older cohort: born in 1920–1924 Younger cohort: born in 1925–1929 Total cohorts
Null model Adjusted model Null model Adjusted model Null model Adjusted model
Est. SE Est. SE Est. SE Est. SE Est. SE Est. SE
Symptom level, intercept
23.68*** 0.09 23.88*** 0.19 23.60*** 0.09 24.00*** 0.17 23.64*** 0.06 23.93*** 0.13
Mean growth rate, linear 20.17*** 0.03 20.16*** 0.03 20.21*** 0.02 20.21*** 0.02 20.19*** 0.02 20.19*** 0.02 Mean acceleration, quadratic --0.004*** 0.00 20.00*** 0.00 20.01*** 0.00 20.01*** 0.00 20.01*** 0.00 20.01*** 0.00 Cohort comparison (older vs younger) 20.04*** 0.08 Older cohort 6 female 20.13*** 0.12 Baseline background variables Sociodemographics Gender (ref = Male)
Female 20.05*** 0.17 20.06*** 0.16 20.12*** 0.13 Ethnicity (ref = Fukianese) Hakka 20.06*** 0.13 20.11*** 0.12 20.02*** 0.08 Mainlander 20.16*** 0.12 20.02*** 0.10 20.08*** 0.08 Socioeconomic position Education (ref = Illiterate) Incomplete primary education 20.11*** 0.13 20.27*** 0.12 20.20*** 0.09 Completed primary education 20.33*** 0.12 20.45*** 0.10 20.39*** 0.08 High school graduate and above
20.63*** 0.14 20.63*** 0.12 20.61*** 0.09 Work status (ref = No work) Full- or part-time work 20.39*** 0.11 20.12*** 0.09 20.24*** 0.09 Assisting family 20.28*** 0.11 20.04*** 0.11 20.18*** 0.08 Life-related stressor Family living arrangement (ref = Alone)
Living with family 20.21*** 0.14 20.21*** 0.12 20.20*** 0.09 Living with family
6 female
20.18*** 0.19 20.09*** 0.18 20.04*** 0.13
Financial hardship (ref = No)
20.72*** 0.11 20.85*** 0.09 20.79*** 0.07
Physical health status Chronic diseases
Spur formation (ref = No)
20.19*** 0.11 20.10*** 0.09 20.14*** 0.07
Arthritis (ref = No) 20.16*** 0.10 20.10*** 0.08 20.13*** 0.06 Random effects Var. SE Var. SE Var. SE Var. SE Var. SE Var. SE Variance in random intercept 0.77** --0.189*** 20.53*** 0.16 0.88** --0.17 20.67*** 0.17 0.84** --0.13 0.61** --0.12 Variance in random slope --0.00001 0.0001 0.0001 20.0002 0.0001 0.0002 20.0001 0.0002 0.00002 0.0001 0.00001 0.0000 Variance in residuals 4.66** 0.13*** 4.64*** 0.12 4.78** 0.11 24.76*** 0.11 4.73** 0.08 4.71** 0.08 Note: Null model depicts the age trajectory of depressive symptoms with no other variables included. Adjusted model shows the age trajectory of depressive symptoms with the variables related to sociodemographics, baseline socioeconomic status, life-related stressors and physical health conditions added.
*p,0.05; **p,0.01; ***p,0.001.
variables strongly associated with negative affect. The lack of significant relationship in lack of positive affect may be because there is less variation in lack of positive affect than in negative affect. In addition, health problems may also not diminish positive affect as measured by those two particular items.
Although our research provides new information via a longitudinal analysis regarding age and cohort differences with respect to depressive trajectories, this work is not without limitations. First, the use of a subset of the CES-D scale compromises the comparability of our findings with other studies using the full CES-D scale of 20 items. Second, depressive symptomatology as measured by the CES-D is subject to recall bias. Third, the assessment of other important predictors of depressive symptoms is limited by the use of existing data in the TLSA, such as psychiatric disorders, any family history of depression and substance use. Fourth, we primarily assessed the effects of the covariates measured at baseline, although these variables, such as living arrangements, work status and financial security, are likely to have changed over the 14-year period of study. As analysis of the dynamic effects of these variables was beyond the scope of the current study, future research needs to include an assessment of the dynamic effects of these variables in relation to the ageing and mental health outcomes among older adults.
In summary, our findings suggest that depressive symptoms increase with age at the end of the life course, after adjusting for individual SEP and physical health. We also found cohort differences in depressive symptomatology in terms of SEP variables. An active life, living with family and having a high level of education are associated with positive affect later in life, while financial strain and poor health are strongly related to negative affect. These results underline the social origins of depressive mood in the elderly population, independently of ageing. To our knowledge, this might be the first research in Asia that uses longitudinal data to report cohort differences in terms of ageing effects on distress trajectories among commu-nity-based older adults. The findings imply that programme strategies aimed at promoting mental health among older adults
need to consider more the results of ageing effects and inter-cohort differences on depressive symptoms.
Acknowledgements: The authors would like to thank the editor and two anonymous reviewers for their useful comments and suggestions for the improvement in the quality of this paper. The authors also thank the Bureau of Health Promotion at the Department of Health in Taiwan for permission to analyse the data from the Taiwan Longitudinal Study on Aging (TLSA). The conclusions herein are those of the authors and do not represent the viewpoint of the Bureau.
Funding: Support from the National Science Council in Taiwan under grants NSC95-2412-H-006-004 and NSC97-2314-B-010-047-MY3.
Competing interests: None.
Ethics approval: Research ethics committee approval was obtained from the National Yang-Ming University.
REFERENCES
1. Hermalin AI. Aging in Asia: setting the research foundation. Asia-Pacific Population Research Reports No. 4. Honolulu: East–West Center, 1995:1–19.
2. Office for National Statistics. Population by age. Taiwan: Ministry of Interior, 2008. 3. Teachman BA. Aging and negative affect: the rise and fall and rise of anxiety and
depression symptoms. Psychol Aging 2006;21:201–7.
4. Chi I, Yip PS, Chiu HF, et al. Prevalence of depression and its correlates in Hong Kong’s Chinese older adults. Am J Geriatr Psychiatry 2005;13:409–16. 5. Chou KL, Chi I. Prevalence and correlates of depression in Chinese oldest-old.
Int J Geriatr Psychiatry 2005;20:41–50.
6. Steffens DC, Otey E, Alexopoulos GS, et al. Perspectives on depression, mild cognitive impairment, and cognitive decline. Arch Gen Psychiatry 2006;63:130–8. 7. Rowan PJ, Haas D, Campbell JA, et al. Depressive symptoms have an independent,
gradient risk for coronary heart disease incidence in a random, population-based sample. Ann Epidemiol 2005;15:316–20.
8. Gottfries CG. Late life depression. Eur Arch Psychiatry Clin Neurosci 2001;251(Suppl 2):II57–61.
9. Fombonne E. Time trends in affective disorders. Mahwah, NJ: L. Erlbaum Associates (LEA), Inc., 1998.
10. Liu CY, Wang SJ, Teng EL, et al. Depressive disorders among older residents in a Chinese rural community. Psychol Med 1997;27:943–9.
11. Tsai YF, Yeh SH, Tsai HH. Prevalence and risk factors for depressive symptoms among community-dwelling elders in Taiwan. Int J Geriatr Psychiatry 2005;20:1097–102. 12. Kessler RC, Foster C, Webster PS, et al. The relationship between age and
depressive symptoms in two national surveys. Psychol Aging 1992;7:119–26. 13. Prince MJ, Reischies F, Beekman AT, et al. Development of the EURO-D scale—a
European Union initiative to compare symptoms of depression in 14 European centres. Br J Psychiatry 1999;174:330–8.
14. Jorm AF. Does old age reduce the risk of anxiety and depression? A review of epidemiological studies across the adult life span. Psychol Med 2000;30:11–22. 15. Wickramaratne PJ, Weissman MM, Leaf PJ, et al. Age, period and cohort effects
on the risk of major depression: results from five United States communities. J Clin Epidemiol 1989;42:333–43.
16. Kasen S, Cohen P, Chen H, et al. Depression in adult women: age changes and cohort effects. Am J Public Health 2003;93:2061–6.
17. Geerlings SW, Beekman AT, Deeg DJ, et al. Physical health and the onset and persistence of depression in older adults: an eight-wave prospective community-based study. Psychol Med 2000;30:369–80.
18. Street H, O’Connor M, Robinson H. Depression in older adults: exploring the relationship between goal setting and physical health. Int J Geriatr Psychiatry 2007;22:1115–19.
19. Koster A, Bosma H, Kempen GI, et al. Socioeconomic differences in incident depression in older adults: the role of psychosocial factors, physical health status, and behavioral factors. J Psychosom Res 2006;61:619–27.
20. Smith JP, Kington R. Demographic and economic correlates of health in old age. Demography 1997;34:159–70.
21. House JS, Lepkowski JM, Kinney AM, et al. The social stratification of aging and health. J Health Soc Behav 1994;35:213–34.
22. House JS, Kessler RC, Herzog AR. Age, socioeconomic status, and health. Milbank Q 1990;68:383–411.
23. Mirowsky J, Ross CE. Social causes of psychological distress. New York: Aldine de Gruyter, 2003.
24. Fonda SJ, Herzog AR. Patterns and risk factors of change in somatic and mood symptoms among older adults. Ann Epidemiol 2001;11:361–8.
25. Federal Interagency Forum on Aging-Related Statistics F. Older Americans 2004: key indicators for well-being. Washington, DC: US Government Printing Office, 2004.
26. Strawbridge WJ, Deleger S, Roberts RE, et al. Physical activity reduces the risk of subsequent depression for older adults. Am J Epidemiol 2002;156:328–34. 27. Radloff LS. The CES-D scale: a self-report depression scale for research in the
general population. Appl Psychol Measurement 1977;1:385–401.
28. Cheng ST, Chan AC. The Center for Epidemiologic Studies Depression Scale in older Chinese: thresholds for long and short forms. Int J Geriatr Psychiatry 2005;20:465–70.
What this study adds
c The negative affect increased with age but levelled off, while lack of positive affect displayed an opposite change. c Independently of ageing, an active life and having a high level
of education are associated with positive affect later in life, while financial strain and poor health are strongly related to negative affect.
c Living alone is associated with an increase in negative affect for older men but not for older women.
What is already known on this subject
c Depression is one of the most commonly encountered mental health problems during older adulthood.
c The occurrence of depressive symptomatology has been shown to differ by indicators of social stratification, and these relationships may also be varied by the complexity of the construct of depressive symptomatology.
adults. J Health Soc Behav 2006;47:17–31.
30. Wilkinson RG. Unhealthy societies: the afflictions of inequality. London: Routledge, 1996.
31. StataCorp. Stata statistical software: release 9.0. College Station, TX: Stata Corporation, 2005.
32. Singer JD, Willett JB. Applied longitudinal data analysis: modeling change and event occurrence. Oxford; New York: Oxford University Press, 2003.
33. Raudenbush SW, Bryk AS. Hierarchical linear models: applications and data analysis methods. Thousand Oaks, CA: Sage Publications, 2002.
34. Rabe-Hesketh S, Skrondal A. Multilevel and longitudinal modeling using Stata. College Station, TX: StataCorp LP, 2005.
35. Sicotte M, Alvarado BE, Leon EM, et al. Social networks and depressive symptoms among elderly women and men in Havana, Cuba. Aging Ment Health 2008;12:193–201.
36. Ramos M, Wilmoth J. Social relationships and depressive symptoms among older adults in southern Brazil. J Gerontol B Psychol Sci Soc Sci 2003;58:S253–61. 37. Zunzunegui MV, Beland F, Otero A. Support from children, living arrangements,
self-rated health and depressive symptoms of older people in Spain. Int J Epidemiol 2001;30:1090–9.
38. Carstensen LL, Pasupathi M, Mayr U, et al. Emotional experience in everyday life across the adult life span. J Pers Soc Psychol 2000;79:644–55.
39. Alvarado BE, Zunzunegui MV, Beland F, et al. Social and gender inequalities in depressive symptoms among urban older adults of Latin America and the Caribbean. J Gerontol B Psychol Sci Soc Sci 2007;62:S226–36.
40. Cheng YH, Chi I, Boey KW, et al. Self-rated economic condition and the health of elderly persons in Hong Kong. Soc Sci Med 2002;55:1415–24.
stages of the lifecourse. Am J Public Health 1998;88:471–4.
42. Dannefer D. Cumulative advantage/disadvantage and the life course: cross-fertilizing age and social science theory. J Gerontol B Psychol Sci Soc Sci 2003;58:S327–37. 43. Fiske A, Gatz M, Pedersen NL. Depressive symptoms and aging: the effects of
illness and non-health-related events. J Gerontol Psychol Sci 2003;58B:320–8. 44. Balters PB, Mayer KU. The Berlin Aging Study: aging from 70 to 100. Cambridge:
Cambridge University Press, 2001:Ch. 17, 457–460.
APPENDIX: THE 10 CES-D ITEMS USED ACROSS THE WAVES IN TLSA
Everyone has mood changes. In the past week, have you experienced the following situations or feelings? If yes, continue to ask: Does this happen to you rarely (one day in the past week), sometimes (2–3 days in the past week), often or chronically (over 4 days in the past week)?
c 1. Not interested in eating, have a poor appetite. c 2. Feel that doing everything was exhausting. c 3. Sleep poorly (unable to sleep soundly). c 4. Feel you were in a terrible mood. c 5. Feel lonely (isolated, with no companion).
c 6. Feel people around you weren’t nice to you (unfriendly). c 7. Feel anguish.
c 8. Unable to gather your energy to do things (had no will to do anything). c 9. Feel joyful.