Original Article
ped_3102598..607Construct validity of the Comprehensive Developmental Inventory for
Infants and Toddlers
Ai-Wen Hwang,1
Li-Jen Weng2
and Hua-Fang Liao3,4
1
Graduate Institute of Early Intervention, College of Medicine, Chang Gung University, Tao-Yuan,2
Department and Graduate Institute of Psychology,3
School and Institute of Physical Therapy, College of Medicine, National Taiwan University and4
Physical Therapy Center, National Taiwan University Hospital, Taipei, Taiwan
Abstract Background: The aim of this study was to investigate the construct validity of the diagnostic test, the Comprehensive
Developmental Inventory for Infants and Toddlers (CDIIT).
Methods: A total of 1085 children in four age groups (infant, 1-year-old, 2-year-old, preschool age) were enrolled. The
Developmental Quotient of each subdomain of the five CDIIT subtests (Cognition, Language, Motor, Social, and Self-help) was used as the basic unit for factor analysis with the iterative principle factor method and promax rotation.
Results: The two-factor solution in two younger age groups and 2- or 3-factor solutions in the 2-year-old and preschool
groups provided superior factor structure in terms of interpretability and compatibility with existing child development theories.
Conclusion: Although five constructs were proposed in the original manual of CDIIT, two to three constructs were
revealed in this empirical study.
Key words child development, diagnostic test, factor analysis, psychometrics.
A child development test is defined as a test of the status of a newborn, an infant, or a young child in regard to their
develop-mental progress.1A well-designed child developmental test can
help to identify those children who are at risk of developmental
problems,2to predict children’s later development,3to determine
a child’s current ability level, and to determine how children
progress over time.4A proper child developmental test is usually
required to cover a broad spectrum of behavior, including
cogni-tive, linguistic, motor, social, and self-help domains.5The
diag-nostic test of the Comprehensive Developmental Inventory for
Infants and Toddlers (CDIIT),6 one of the developmental tests
covering five developmental subtests used for children aged 3–72
months, is commonly used in Taiwan.7The norm of CDIIT was
established with a standardization sample of 3703 children, aged 3–72 months, randomly selected according to age, sex,
urbaniza-tion, and geographic regions in Taiwan.6Besides the Taiwanese
norm, the CDIIT is appropriate for assessing children in Taiwan for its covering of several items specific to Chinese culture (e.g. use of chopsticks, and pronunciation in Mandarin). The CDIIT has shown acceptable test–retest reliabilities (intraclass
correla-tion coefficient [ICC]= 0.76–1.00, P< 0.01), inter-rater
reliabil-ity (ICC = 0.76–1.00, P < 0.01),8 and internal consistency
(Cronbach’sa = 0.75–0.99).6The validity for decisions has also
been established.6–11 In the aspect of validity of measurement
scores, content validity of five subtests (Cognition, Motor,
Lan-guage, Self-help, and Social subtests),6concurrent validity with
the Bayley Scale of Infant Development – second edition,7,12and
predictive validity for special education status11were reported.
However, the construct validity of CDIIT is still not well known. The investigation of the construct validity of the CDIIT will help test examiners to understand and explain the meanings of the test scores. To provide substantial evidence for the CDIIT’s construct validity, we need to explore the underlying constructs by means
of suggested validation processes,13 such as exploratory factor
analysis (EFA). The aim of construct validity is to “determine whether test scores provide a good measure of a specific con-struct” and to “establish how a construct relates to a number of behaviors”. EFA is particularly relevant to construct-validation
procedures.13
Previous studies have shown three findings when EFA were applied to investigate the construct validity of child developmen-tal tests. First, one to four factors, fewer than the originally proposed number of domains (five to 13), were extracted using EFA.14–19 Second, the oblique rotation method was preferred under the assumption of simultaneous or parallel development in
all domains of child development.20–22The assumption usually
leads to the supposition of correlations among factors. Third, the factors change across different age levels. For example, the factor structure of the Infant Psychological Development Scale was
found to differ in three age groups.16Based on previous empirical
Correspondence: Hua-Fang Liao, School and Graduate Institute of Physical Therapy, College of Medicine, National Taiwan University, 3rd floor, No.17, Xuzhou Road, Zhong Zheng District, Taipei City 100, Taiwan. Email: hfliao@ntu.edu.tw
Received 3 July 2008; revised 27 October 2009; accepted 24 November 2009.
evidence, we hypothesized that: (i) the number of constructs of the CDIIT according to EFA would be fewer than the originally proposed number of domains; (ii) the derived factors were cor-related with each other; and (iii) the factor structures would probably change with age.
Methods
Data source
The convenient sample was selected from the data set of
concur-rent validity studies of CDIIT7,12 and the Taiwan Birth Panel
Study.23 Considering that the CDIIT norm sample came from
children without obvious disabilities, we decided to remove all the children (61 cases) with health-related problems or develop-mental disabilities, such as Down syndrome, cerebral palsy, or spinal bifida, etc. Finally, a total of 1085 non-disabled full-term or preterm children were enrolled in this study. Due to the diverse test item arrangement and possible different factor structure at various age levels, the participants were grouped into four age groups according to the age norm of the CDIIT, namely the infant
group (6–11 months, n = 364), the 1-year-old group (12–23
months, n= 169), the 2-year-old group (24–35 months, n = 412),
and the preschool group (48–71 months, n= 140). The
demo-graphic data of the four groups are listed in Table 1.
Measures
The CDIIT consists of five subtests assessing performance in the domains of cognitive (81 items), motor (97 items), language (62
items), self-help (47 items), and social development (56 items).6
Each subtest is further divided into subdomains listed in Table 2. In total, 19 subdomains are encompassed in the CDIIT. The tester administered all of the items in the Cognitive subtest and the Motor subtest, and some items of the Language subtest. Some items of the Language subtest and all items in the subdomains of Social and Self-Help subtests were reported by the child’s main
caregiver. Each test item is scored 0 or 1, where 1 indicates either success during the test or from the observation of the caregiver. The CDIIT provides developmental quotients (DQ) for the afore-mentioned five subtests, 19 subdomains, and the whole test with a mean of 100 and a standard deviation of 15. DQ of the CDIIT were calculated from the norm with a 1-month interval for chil-dren younger than 24 months. After 24 months, DQ were
obtained according to the norm of 3-monthly increments.6For
preterm children (gestational age< 37 weeks) the corrected age
(chronological ages were subtracted by the period from gesta-tional age to 40 weeks of gestation) was used for calculating the DQ when their chronological ages were younger than 2 years.
Data analysis
Means and standard deviations of DQ for all subdomains of the CDIIT subtests are listed in Table 2. The following subdomains were removed prior to conducting EFA because over 90% of the children got the same scores in the same subdomains: C1, C2, C5 and H2 for the Infant group; C1 and G1 for the 1-year-old group; C1, C4 and G1 for the 2-year-old group; and C1, G1 and F1 for the Preschool group. For example, 90% of the Infant group, 95% of the 1-year-old group, 99% of the 2-year-old group, and 100% of the Preschool group passed all the items in C1 (Attention). In consequence, the C1 subdomain was not appropriate for assess-ing children older than 6 months due to the lack of discrimination and small variance in this particular group. It has been recom-mended that any specific subdomain with small variance should be excluded from EFA due to its lack of significant correlation
with other subdomains.25
Finally, correlation matrices derived from DQ of 15 subdo-mains in the Infant group, 17 subdosubdo-mains in the 1-year-old group, 16 subdomains in the 2-year-old group, and 16 subdomains in the Preschool group, were used to conduct EFA separately (correla-tion matrices for the four age groups are available upon request). DQ rather than total raw scores for the subdomains were used in
Table 1 Demographic data for children in four age groups
Variables Infant group 1-year-old group 2-year-old group Preschool group
n= 364 n= 169 n= 412 n= 140
Mean1 SD Mean1 SD Mean1 SD Mean1 SD
Age (months)† 7.21 1.6 17.41 3.7 27.51 2.3 57.81 3.5 Birth bodyweight (g) 2418.01 836.2 2661.21 789.9 2809.11 778.7 2587.61 800.0 Male gender, n (%) 202 (56%) 93 (55%) 228 (55%) 81 (58%) SES, n (%) I 17 (5%) 3 (2%) 41 (10%) 2 (1%) II 108 (30%) 41 (24%) 143 (34%) 33 (24%) III 187 (51%) 91 (53%) 175 (42%) 76 (54%) IV 38 (10%) 26(15%) 50 (12%) 26 (19%) V 4 (1%) 3 (3%) 2 (1%) 3 (2%) Missing 10 (3%) 5(3%) 1 (1%) 0 (0%)
Mother’s educational level, n (%)
<12 years 8 (2%) 4 (2%) 13 (2%) 3 (2%)
12–15 years 171 (47%) 93 (55%) 197 (48%) 81 (58%)
316 years 181 (50%) 47 (28%) 201 (49%) 56 (40%)
Missing 4 (1%) 25 (15%) 1 (1%) 0 (0%)
†Corrected age was calculated when the chronological age was less than 2 years. SES, social economic status according to father’s occupation and educational level.24
the EFA because the age effect would confound the correlations among total raw scores of the subdomains.
We used spss Version 13.0 (spss, Chicago, 2004) and sas Version 9.1.2 (sas Institute, Cary, NC, USA, 2004) for statistical analysis. EFA was conducted by using the iterative principle factor method (IPF) followed by the oblique promax rotation. Factorability of items was examined using the Bartlett test (a was set at 0.05, two-tailed) and the Kaiser–Meyer–Olin (KMO) measure of sampling adequacy. A value for KMO greater than 0.6
is tolerable for EFA.26 The number of factors was decided by
multiple methods including eigenvalue > 1, scree test,27,28and
parallel analysis.29 Parallel analysis was implemented by using
both the mean and 95th percentile eigenvalues from 1000 random
data sets as the base of comparison. The factor loadings3 0.3
were considered salient loadings.25 The correlations > 0.30
among factors were also considered acceptable.30 Root mean
square residual (RMSR) fit index was also reported to evaluate
the appropriateness of the factors. RMSR< 0.1 was suggested as
an indicator of good factor solution.26
Results
Infant group (6–11 months)
The 15 subdomains for the infant group yielded a tolerable KMO
of 0.768 with a significant Bartlett test (P< 0.001). The first five
eigenvalues of CDIIT variables were 3.313, 1.953, 1.178, 1.072,
and 0.949, suggesting four factors by eigenvalue > 1 and two
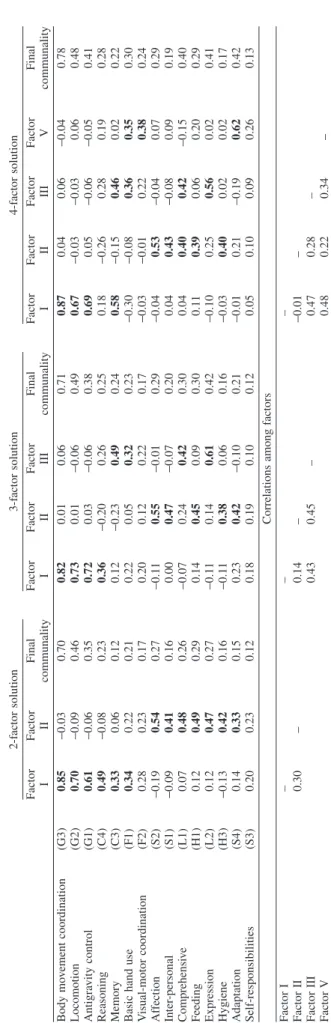
factors by scree test and the parallel analysis. The factor loadings and final communality estimates for two- to four-factor solutions are reported in Table 3. RMSR was 0.050, 0.039, and 0.029 for two-factor, three-factor, and four-factor solutions, respectively. The two-factor solution yielded the factor pattern with six sub-domains (C3, C4, G1, G2, G3, and F1) loaded on factor I and seven subdomains (S1, S2, S4, H1, H3, L1, and L2) loaded on Factor II. F2 and S3 had small loadings on both factors. The
three-factor and four-factor solutions were not easily explained for this age, and the factor names were hard to determine. There-fore, the two-factor solution was preferred. Factors I and II were named the “Perceptual-motor” factor and the “Social-adaptive” factor, respectively, according to ordinarily used terms in the field
of child development.22,31,32 The correlation between the two
factors was acceptable (Table 3).
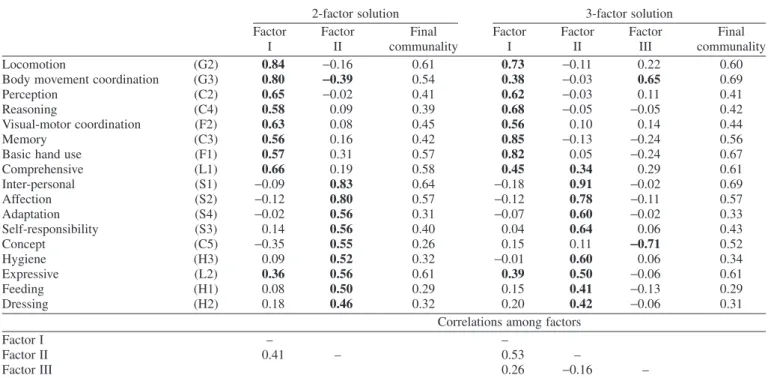
1-year-old group (12–23 months)
The same analysis procedures were used for the 1-year-old
group. The KMO was 0.864 with a significant Bartlett test (P<
0.001). Both the scree test and eigenvalue > 1 yielded three
factors, while parallel analysis suggested two factors. The factor loadings and final communality estimates for two- and three-factor solutions are reported in Table 4. RMSR was 0.055 for the two-factor solution and 0.040 for the three-factor solution. For the three-factor solution, it was difficult to label Factor III because only G3 (loading positively) and C5 (loading negatively) had relatively larger loadings on it. Thus, the two-factor solution appeared superior to the three-factor solution considering the interpretability of the results. For the two-factor solution, there were eight subdomains (C2, C3, C4, G2, G3, F1, F2, and L1) loaded relatively large on Factor I and nine subdomains (S1, S2, S3, S4, H1, H2, H3, C5, and L2) loaded relatively large on Factor II. The two factors were again named the “Perceptual-motor” and the “Social-adaptive” factors for Factors I and II for this age group. A correlation coefficient of 0.41 between the two factors was found.
2-year-old group (24–35 months)
The KMO was 0.896 with a significant Bartlett test (P< 0.001).
The methods of eigenvalue > 1 and scree test resulted in three
factors while parallel analysis suggested two factors. The factor loadings and final communality estimates for two- and
three-Table 2 Descriptive analysis of developmental quotients of subdomains of the Comprehensive Developmental Inventory for Infants and Toddlers Subtests Subdomains Infant (n= 364) 1-year (n= 169) 2-year (n= 412) Preschool (n= 140)
Mean SD Mean SD Mean SD Mean SD
Cognition Attention (C1) 101.7 6.9 99.5 5.0 99.8 3.2 100.0 – Perception (C2) 100.4 6.3 93.3 14.9 89.7 12.6 101.9 15.7 Memory (C3) 96.3 11.1 90.5 12.2 90.5 17.4 102.9 14.4 Reasoning (C4) 96.8 11.5 97.4 13.4 97.1 9.8 101.6 15.0 Concept (C5) 102.0 4.0 117.5 23.9 90.0 14.0 104.6 15.6 Language Comprehensive (L1) 105.6 14.6 95.0 14.1 89.5 13.6 106.2 16.2 Expressive (L2) 104.8 12.4 98.8 16.8 92.4 20.9 107.3 14.1
Motor Antigravity control (G1) 98.5 14.0 98.2 8.6 99.6 4.5 99.7 3.9
Locomotion (G2) 99.0 11.9 97.6 16.3 86.7 10.4 98.1 13.7
Body movement coordination (G3) 99.5 13.3 82.7 15.2 84.8 16.0 96.8 17.1
Basic hand use (F1) 95.8 16.0 99.5 19.4 91.7 12.7 98.6 8.4
Visual-motor coordination (F2) 97.0 9.9 93.4 15.8 91.7 14.8 93.0 16.3 Social Inter-personal (S1) 106.2 20.7 95.5 17.9 103.0 18.9 107.7 11.9 Affection (S2) 97.7 12.6 87.9 15.3 95.6 16.4 100.8 17.1 Self-responsibility (S3) 104.7 14.5 104.0 17.2 105.9 14.5 99.7 13.7 Adaptation (S4) 124.8 24.9 103.1 18.6 110.8 24.3 103.6 15.8 Self-help Feeding (H1) 96.3 14.0 91.0 17.9 91.7 16.8 96.3 17.1 Dressing (H2) 97.6 11.4 93.9 15.1 97.4 16.0 103.0 15.3 Hygiene (H3) 102.7 17.2 95.8 15.2 101.0 17.9 100.1 12.6
factor solutions are reported in Table 5. RMSR was 0.053 for the two-factor solution and 0.036 for the three-factor solution. Both the two-factor and three-factor solutions were reasonable. For the two-factor solution, seven subdomains (C2, C3, C5, F2, G3, L1, and L2) were loaded on Factor I, and eight subdomains (S1, S2, S3, S4, H1, H2, H3, and F1) were loaded on Factor II. G2 had small loadings on both factors, but was relatively large on Factor II. Factors were also named “Perceptual-motor” and “Social-adaptive” for Factors I and II according to their item content. For the three-factor solution, the same seven subdomains (C2, C3, C5, F2, G3, L1, and L2) were loaded on Factor I, but Factor II in the two-factor solution was split into two factors in the three-factor solution. Finally, four subdomains (S1, S2, S3, and S4) were loaded on Factor II and five subdomains (H1, H2, H3, G2, and F1) were loaded on Factor III. Factors were named “Perceptual-motor”, “Social”, and “Adaptive-motor” for Factors I, II, and III. The correlations among the factors in both solutions were also acceptable.
Preschool group (48–71 months)
The KMO was 0.859 with a significant Bartlett test (P< 0.001).
The method of eigenvalue> 1 suggested three factors, while the
scree test and the parallel analysis resulted in two factors. The factor loadings and final communality estimates for two- and three-factor solutions are reported in Table 6. RMSR was 0.056 for the two-factor solution and 0.043 for the three-factor solution. A simple structure was presented for both solutions.
For the two-factor solution, there were nine subdomains (C2, C3, C4, C5, F2, G2, G3, L1, and L2) loaded on Factor I and seven subdomains (S1, S2, S3, S4, H1, H2, and H3) loaded on Factor II. Therefore, as for the 2-year-old group, “Perceptual-motor” was named for Factor I and “Social-adaptive” for Factor II. The “Social-adaptive” factor remained unchanged in the three-factor solution, while “Perceptual-motor” factor in the two-factor solu-tion was split into two factors with the three-factor solusolu-tion. Finally, seven subdomains (C2, C3, C4, C5, F2, L1, and L2) were loaded on Factor I and two subdomains (G2 and G3) were loaded on Factor III for a three-factor solution. Factors I and III were named “Cognition–language” and “Gross-motor-coordination”, respectively. The factors were appropriately correlated both in the two-factor and three-factor solutions. Thus, both solutions could be applied according to the interest domains for examiners. Table 7 summarizes the originally proposed five constructs of the CDIIT and factors derived from EFA across four age groups, and the subdomains contained in the new constructs or factors. Discussion
The findings of this study indicated that there were only two or three interpretable constructs underlying the CDIIT. The number of constructs as expected was less than five, which is the number of constructs postulated in the CDIIT manual. The inter-relationships between factors for all age levels supported the assumption of simultaneous or parallel development in all
domains of child development.20–22Furthermore, the factor
struc-tures for the four different age groups were not identical. None of
T able 3 Factor loadings and inter -f actor correlations for the Inf ant group (n = 364) 2-f actor solution 3-f actor solution 4 -f actor solution Factor I Factor II Final communality Factor I Factor II Factor III Final communality Factor I Factor II Factor III Factor V Final communality Body mo v ement coordination (G3) 0.85 -0.03 0.70 0.82 0.01 0.06 0.71 0.87 0.04 0.06 -0.04 0.78 Locomotion (G2) 0.70 -0.09 0.46 0.73 0.01 -0.06 0.49 0.67 -0.03 -0.03 0.06 0.48 Antigra vity control (G1) 0.61 -0.06 0.35 0.72 0.03 -0.06 0.38 0.69 0.05 -0.06 -0.05 0.41 Reasoning (C4) 0.49 -0.08 0.23 0.36 -0.20 0.26 0.25 0.18 -0.26 0 .28 0.19 0.28 Memory (C3) 0.33 0.06 0.12 0.12 -0.23 0.49 0.24 0.58 -0.15 0.46 0.02 0.22 Basic hand use (F1) 0.34 0.22 0.21 0.22 0.05 0.32 0.23 -0.30 -0.08 0.36 0.35 0.30 V isual-motor coordination (F2) 0.28 0.23 0.17 0.20 0.12 0.22 0.17 -0.03 -0.01 0 .22 0.38 0.24 Af fection (S2) -0.19 0.54 0.27 -0.1 1 0.55 -0.01 0.29 -0.04 0.53 -0.04 0.07 0.29 Inter -personal (S1) -0.09 0.41 0.16 0.00 0.47 -0.07 0.20 0.04 0.43 -0.08 0.09 0.19 Comprehensi v e (L1) 0.07 0.48 0.26 -0.07 0.24 0.42 0.30 0.04 0.40 0.42 -0.15 0.40 Feeding (H1) 0.12 0.49 0.29 0.14 0.45 0.09 0.30 0.1 1 0.39 0.06 0.20 0.29 Expression (L2) 0.12 0.47 0.27 -0.1 1 0.14 0.61 0.42 -0.10 0.25 0.56 0.02 0.41 Hygiene (H3) -0.13 0.42 0.16 -0.1 1 0.38 0.06 0.16 -0.03 0.40 0.02 0.02 0.17 Adaptation (S4) 0.14 0.33 0.15 0.23 0.42 -0.10 0.21 -0.01 0.21 -0.19 0.62 0.42 Self-responsibilities (S3) 0.20 0.23 0.12 0.18 0.19 0.10 0.12 0.05 0.10 0.09 0.26 0.13 Correlations among factors Factor I – – – Factor II 0.30 – 0.14 – -0.01 – Factor III 0.43 0.45 – 0 .47 0 .28 – Factor V 0.48 0.22 0.34 – For 2-f actor solution, Factor I = Perceptual-motor , and Factor II = Social-adapti v e.
the three hypotheses of this study were rejected. The factors were named following commonly used terms in child
development.22,31,32
The results of this study showed that the “Perceptual-motor” and the “Social-adaptive” factors might be retained throughout the infant to 1-year-old groups. It indicated that in early life,
children’s development was not well differentiated. However, at the age of 2 years, more factors started to emerge. The increased number of factors implies the effect of gradual differentiation of developmental domains from younger to older ages. Because this study lacked the data from 36–47 months, the differentiation of the factors underlying CDIIT can only be speculated for children
Table 4 Factor loadings and inter-factor correlations for the 1-year-old group (n= 169)
2-factor solution 3-factor solution Factor I Factor II Final communality Factor I Factor II Factor III Final communality Locomotion (G2) 0.84 -0.16 0.61 0.73 -0.11 0.22 0.60
Body movement coordination (G3) 0.80 -0.39 0.54 0.38 -0.03 0.65 0.69
Perception (C2) 0.65 -0.02 0.41 0.62 -0.03 0.11 0.41
Reasoning (C4) 0.58 0.09 0.39 0.68 -0.05 -0.05 0.42
Visual-motor coordination (F2) 0.63 0.08 0.45 0.56 0.10 0.14 0.44
Memory (C3) 0.56 0.16 0.42 0.85 -0.13 -0.24 0.56
Basic hand use (F1) 0.57 0.31 0.57 0.82 0.05 -0.24 0.67
Comprehensive (L1) 0.66 0.19 0.58 0.45 0.34 0.29 0.61 Inter-personal (S1) -0.09 0.83 0.64 -0.18 0.91 -0.02 0.69 Affection (S2) -0.12 0.80 0.57 -0.12 0.78 -0.11 0.57 Adaptation (S4) -0.02 0.56 0.31 -0.07 0.60 -0.02 0.33 Self-responsibility (S3) 0.14 0.56 0.40 0.04 0.64 0.06 0.43 Concept (C5) -0.35 0.55 0.26 0.15 0.11 -0.71 0.52 Hygiene (H3) 0.09 0.52 0.32 -0.01 0.60 0.06 0.34 Expressive (L2) 0.36 0.56 0.61 0.39 0.50 -0.06 0.61 Feeding (H1) 0.08 0.50 0.29 0.15 0.41 -0.13 0.29 Dressing (H2) 0.18 0.46 0.32 0.20 0.42 -0.06 0.31
Correlations among factors
Factor I – –
Factor II 0.41 – 0.53 –
Factor III 0.26 -0.16 –
For 2-factor solution, Factor I= Perceptual-motor, and Factor II = Social-adaptive.
Table 5 Factor loadings and inter-factor correlations for the 2-year-old group (n= 412)
2- factor solution 3-factor solution Factor I Factor II Final communality Factor I Factor II Factor III Final communality Comprehensive (L1) 0.91 -0.08 0.75 0.90 0.02 -0.09 0.75 Memory (C3) 0.82 -0.09 0.59 0.81 0.03 -0.11 0.60 Concept (C5) 0.76 0.01 0.59 0.76 0.10 -0.07 0.60 Perception (C2) 0.75 -0.02 0.54 0.74 -0.08 0.08 0.55 Visual-motor coordination (F2) 0.54 0.07 0.34 0.54 -0.15 0.25 0.37 Expressive (L2) 0.44 0.22 0.35 0.44 0.19 0.05 0.35
Body movement coordination (G3) 0.46 0.09 0.27 0.46 -0.10 0.21 0.29
Inter-personal (S1) 0.05 0.72 0.56 0.03 0.88 -0.07 0.73 Adaptation (S4) -0.06 0.65 0.38 -0.07 0.74 -0.03 0.48 Affection (S2) -0.04 0.74 0.51 -0.04 0.67 0.13 0.54 Self-responsibility (S3) 0.25 0.55 0.51 0.25 0.47 0.13 0.52 Dressing (H2) -0.02 0.69 0.40 -0.06 0.02 0.77 0.57 Locomotion (G2) 0.09 0.26 0.10 0.08 -0.09 0.40 0.15 Hygiene (H3) 0.02 0.69 0.48 0.00 0.18 0.61 0.55
Basic hand use (F1) 0.18 0.35 0.23 0.18 -0.05 0.46 0.29
Feeding (H1) -0.08 0.58 0.29 -0.08 0.21 0.43 0.30
Correlations among factors
Factor I – –
Factor II 0.56 – 0.52 –
Factor III 0.48 0.63 –
For 2-factor solution, Factor I= Perceptual-motor and Factor II = Social-adaptive; for 3-factor solution, Factor I = Perceptual-motor, Factor II = Social, and Factor III = Adaptive-motor.
aged from 6 months to 35 months. The evidence of the differen-tiation in the 2-year-old group showed in this study that the “Social-adaptive” in the two-factor solution could be further divided into “Social” and “Adaptive-motor” in the three-factor solution. The “Adaptive-motor” factor contains locomotion (G2), basic hand use (F1), and all self-help subdomains. The motor abilities in “Adaptive-motor”, such as dressing, or going up/down stairs, are performed more frequently in daily life. Compared with the motor items in “Perceptual-motor”, they are more related to the contextual setting.
In sum, two- or three-factor solutions of the CDIIT have their interpretability for children aged 24–35 months. Clinicians may choose to use either solution depending on clinical needs. If general development is the focus of interest, the two-factor solu-tion would be sufficient to give a whole picture of child devel-opment. If the social abilities of children aged 24–35 months were the main concern, the three-factor solution would be appro-priate for further explaining the test scores of the CDIIT.
The study by Wachs and Hubert employed EFA to investigate the constructs of the Infant Psychological Development Scale (IPDS) for children in three age groups (14-, 18-, and 22-months) and found that there were three factors for children at the age of
14 and 18 months, and four factors for those at 22 months.16
Furthermore, the factor structures also changed with age.16In the
present study, the number of factors and factor structures were, however, fairly stable under 2 years of age. The different findings may result from different content of these two measures: the IPDS encompasses cognition and perceptual-motor items while the CDIIT includes Cognition, Language, Motor, Social, and Self-help. Compared with IPDS, the CDIIT contains more items in the social-adaptive area. The different content of these two developmental tests would yield various factor patterns by EFA.
In general, the factor structure remained stable before 2 years of age. The “Perceptual-motor” factor contained the original subdomains of Cognition and Motor subtests of the CDIIT, while the “Social-adaptive” factor consisted of Self-help, Language, and Social subtests for children younger than 2 years of age. For structure change, the original subdomains of the Language subtest seemed to shift from “Social-adaptive” to “Perceptual-motor” with age. The L1 or L2 subdomain moved from “Social-adaptive” at the infant age to “Perceptual-motor” at 1-year or 2-year ages. The whole Language subtest (L1 and L2) was con-sistently grouped with all subdomains in the Cognition subtest (C2, C3, C4, and C5) and part of the Motor subtest to form “Perceptual-motor” in the two older age groups. That the lan-guage development was more correlated with cognition at an older age than a younger age is also supported by previous
studies.31,33
A previous longitudinal study, following about 150 children at four ages (6, 12, 18, 24 months), conducted the principal
com-ponent analysis of all items for the Gesell developmental test.31
The item loadings of the first component for the four ages were compared with each other. For the 6- and 12-month groups, the first component loaded heavily on manipulation of objects that yield perceptual contingencies, while for the older two ages, the first component gradually loaded heavily on
social–vocal–verbal-related items.31 The correlation strength among three domains
(Cognition, Language, and Motor) in the Bayley Scales of Infant
and Toddler Development – third edition (BSID-III)33can also
help with explaining the factor structure change. In BSID-III, the correlation between Cognition and Motor domains was higher than that between Cognition and Language domains for children aged 6–25 months. For children more than 25 months of age, the
strength of correlations was reversed.33 Other studies revealed
Table 6 Factor loadings and inter-factor correlations for the Preschool Group (n= 140)
2-factor solution 3- factor solution Factor I Factor II Final communality Factor I Factor II Factor III Final communality Comprehensive (L1) 0.80 -0.11 0.60 0.85 -0.08 -0.07 0.63 Concept (C5) 0.81 -0.09 0.61 0.78 -0.08 0.05 0.61 Reasoning (C4) 0.74 0.01 0.55 0.74 0.03 0.00 0.55 Expressive (L2) 0.70 -0.02 0.48 0.71 0.00 -0.03 0.49 Memory (C3) 0.65 -0.01 0.42 0.71 0.02 -0.09 0.46 Perception (C2) 0.76 0.02 0.59 0.70 0.02 0.10 0.58 Visual-motor coordination (F2) 0.64 0.03 0.42 0.53 0.02 0.17 0.42 Affection (S2) -0.23 0.82 0.59 -0.19 0.83 -0.09 0.60 Inter-personal (S1) -0.01 0.81 0.65 -0.04 0.81 0.02 0.65 Adaptation (S4) -0.05 0.66 0.42 -0.18 0.64 0.20 0.45 Dressing (H2) 0.24 0.50 0.40 0.24 0.51 -0.01 0.40 Feeding (H1) 0.02 0.52 0.27 -0.01 0.52 0.03 0.27 Hygiene (H3) 0.06 0.46 0.23 0.21 0.51 -0.27 0.31 Self-responsibility (S3) 0.29 0.49 0.42 0.25 0.49 0.04 0.41 Locomotion (G2) 0.51 0.06 0.28 0.03 -0.08 0.92 0.83
Body movement coordination (G3) 0.53 0.23 0.41 0.27 0.18 0.44 0.50
Correlations among factors
Factor I – –
Factor II 0.35 – 0.34 –
Factor III – 0.51 0.31 –
For 2-factor solution, Factor I= Perceptual-motor and Factor II = Social-adaptive; for 3-factor solution, Factor I = Cognition–language, Factor II= Social-adaptive, and Factor III = Gross-motor-coordination.
T able 7 Comparisons among the original constructs and factors deri v ed in four age groups Original constructs Inf ant group 1-year -old group 2-year -old group Preschool group 5 constructs 2-f actor solution 2-f actor solution 2-f actor solution 3-f actor solution 2-f actor solution 3-f actor solution Subtests Sub- domains Factors Sub- domains Factors Sub- domains Factors Sub- domains Factors Sub- domains Factors Sub- domains Factors Sub- domains Cognition C1 Perceptual-motor C3 Perceptual-motor C2 Perceptual-motor C2 Perceptual-motor C2 Perceptual-motor C2 Cognition– language L1 C2 C4 C3 C3 C3 C3 C5 C3 G1 C4 C5 C5 C4 C4 C4 G2 L1 L1 L1 C5 L2 C5 G3 G2 L2 L2 L1 C3 Language L1 F1 G3 G3 G3 L2 C2 L2 F2 F1 F2 F2 F2 F2 Motor G1 Social-adapti v e L1 F2 Social-adapti v e S1 Social S1 G2 Gross-motor -coordination G2 G2 L2 Social-adapti v e C5 S2 S2 G3 G3 G3 S1 L2 S3 S3 Social-adapti v e S1 Social-adapti v e S1 F1 S2 S1 S4 S4 S2 S2 F2 S3 S2 G2 Adapti v e-motor G2 S3 S3 Social S1 S4 S3 F1 F1 S4 S4 S2 H1 S4 H1 H1 H1 H1 S3 H3 H1 H2 H2 H2 H2 S4 H2 H3 H3 H3 H3 Self-help H1 H3 H2 H3 C1, attention; C2, perception; C3, memory; C4, reasoning; C5, concept; F1, basic hand use; F2, visual-motor coordination; G1, antigra vity control; G2, locomotion; G3, body mo v ement coordination; H1, feeding; H2, dressing; H3, hygiene; L1, comprehensi v e; L2, expressi v e; S1, inter -personal; S2, af fection; S3, self-responsibi lity; S4, adaptation.
that a speedy improvement in cognitive development, such as symbolic play and using multiple schemes, was correlated with
language development at ages older than 2 years.20,34All the
previous and present substantial findings help clarify the factor structure change of “Perceptual-motor” by adding Language as a key element at older ages.
Factors underlying CDIIT in Infants and the 1-year-old group
The meaning of the “Perceptual-motor” factor is considered as primary cognitive performance for children younger than 2 years
from Piaget’s sensorimotor stage of cognitive development.35
Infants show a wholly practical, perceiving-and-doing, action-bound kind of intellectual functioning. As infants do not possess adequate language ability, cognition has to be assessed based on perception and motor performance. An ecological approach to perceptual learning and development is another theory that
sup-ports the “Perceptual-motor” construct in early life.36Information
about object properties and especially about what they afford is activated by exploring. The object–exploratory system that emerges around 4–5 months provides the child with the possibil-ity of approaching multiple new affordances. Major components of the object–exploratory system are the capabilities of the visual system, postural control, and development of reaching, grasping,
and locomotion.36Another derived factor, “Social-adaptive”,
con-sists of subdomains from the original Social and Self-help sub-tests in the CDIIT. The factor structure of the Social-adaptive construct of the 1-year-old group was similar to that for the infant group, except L1 was re-grouped into “Perceptual-motor” for the 1-year-old group. Overall, the subdomains in “Social-adaptive” required the cooperation and adaptive behavior of children to get higher scores. The possible explanation for L1 loading on the “Social-adaptive” factor in infancy is that L1 mainly included items about the infant’s response to social interaction, such as “orients to sounds”, and “body motion following music rhythm”. If the caregiver provides more language or social stimulation during feeding, the infant will obtain feeding abilities as well as language and social interaction skills.
Factors underlying CDIIT in 2-year-old and Preschooler groups
For the 2-year-old and Preschool groups, the subdomains of Language appeared in “Perceptual-motor” in the two-factor solu-tion. Thus, the “Perceptual-motor” factor contained subdomains from original Cognitive, Motor, and Language subtests in the CDIIT. As mentioned before, perception, the prerequisite of
cog-nition, is highly correlated with motor function,35and correlation
between cognition and language developments is high in children
older than two years of age.33Kastner and May monitored 280
children from kindergarten to first grade and found that language scales and the Stanford Achievement Test (cognitive function)
were correlated and formed one factor by EFA.37The cerebellum
deficit hypothesis for dyslexia and learning disability at an elder age,38–41which proposed that cognitive–language and motor func-tions share the same neurological origin, might also support the “Perceptual-motor” construct at these two ages.
For the three-factor solution in the Preschool group, all sub-domains from Self-help and Social subtests in the original CDIIT formed “Social-adaptive”, and Cognition, Language, and Fine motor subtests formed “Cognitive–language”, and that from the Gross motor subtest formed the “Gross-motor-coordination”. As mentioned before, the language scales and mental scales com-bined to form one factor at the age from kindergarten to first grade in Kastner and May’s study, in which a separated gross
motor function was also found.37This finding supports the
dif-ferentiation of “Perceptual-motor” to “Cognition–language” and “Gross-motor-coordination” in the three-factor solution at around starting school age. “Cognition–language” represents the mental function and verbal communication skills, and “Gross-motor-coordination” represents advanced postural control and bilateral body coordination for this age.
One purpose of the present study was to provide clinicians with a parsimonious and interpretable method for explaining the test scores of the CDIIT. Factor scores of the derived factors can be calculated to describe the child’s developmental profile in the future. Furthermore, the interdependence among multiple newly emerged constructs suggested that simultaneous or parallel development in multi-domains should be considered as an impor-tant issue in child development before school age.
One limitation in this study is that we did not enroll ages from 36 months to 47 months according to the previous follow-up schedule in collecting the CDIIT data. The factor differentiation phenomenon should be cautiously explained for ages older than the 2-year-old group. More samples, especially for preschool age, will be needed to confirm the results of the newly factored structures of CDIIT in the future. The other limitation is that some subdomains were removed for analysis. Consequently, these removed subdomains, even if they were important, were not possibly retained in any constructs or factors and might influence the results of EFA. The removed subdomains were those where over 90% of the children had the same scores on them due to ceiling or basal effects. For example, C1 only covers items on the attention abilities of infants aged 3–5 months and this causes ceiling effects for children aged older than 6 months. Attention
development is actually a lengthy process,42 in which children
first learn to orient to, to shift between, and to maintain focus on events, objects, tasks, and finally to maintain focus on problems in the external world. Therefore, more items to test attention ability at higher ages are recommended in the revised version of the CDIIT in the future.
In conclusion, there were fewer developmental constructs than originally proposed domains in CDIIT. The factor structures were fairly stable before 2 years of age. The factor structure change and structure differentiation happened at the 2-year age level. The factor structure change indicated that language items shifted from “Social-adaptive” factor before 2 years to “Perceptual-motor” factor at 2–3 years.
Acknowledgments
This study was supported in part by Grants BHP-PHRC-92-4, DOH92-TD-1016, DOH93-HP-1702, and DOH94-HP-1702 awarded by the Department of Health, ROC (Taiwan) and by
Grant NSC 96-2314-B-002-074-MY3 awarded by the National Science Council, ROC (Taiwan).
References
1 MedicineNet.com. Webster’s New World Medical Dictionary, 2nd edn. Wiley, New York, 2003.
2 Frankenburg WK. The Denver approach to early case finding. In: Frankenburg WK, Emde RN, Sullivan JW (eds). Early Identifica-tion of Children at Risk – An InternaIdentifica-tional Perspective, A Division of Plenum Publishing Corporation, New York, 1985; 135–58. 3 Shonkoff JP, Meisels SJ. Handbook of Early Childhood
Interven-tion, 2nd edn. Cambridge University Press, New York, 2000. 4 Losardo A, Notari-Syverson A. Traditional and contemporary
assessment models. In: Losardo A, Notari-Syverson A (eds). Alter-native Approaches to Assessing Young Children. Paul H. Brookes Publishing Co., Baltimore, 2001; 13–26.
5 Anastasi A, Urbina S. Psychological Testing, 7th edn. Prentice Hall, Upper Saddle River, NJ, 1997.
6 Wang TM, Su CW, Liao HF, Lin LY, Chou KS, Lin SH. [The standardization of the Comprehensive Developmental Inventory for Infants and Toddlers.] Psychol. Test 1998; 45: 19–46 (in Chinese).
7 Liao HF, Wang TM, Yao G, Lee WT. Concurrent validity of the Comprehensive Developmental Inventory for Infants and Toddlers with the Bayley Scales of Infant Development-II in preterm infants. J. Formos. Med. Assoc. 2005; 104: 731–37.
8 Liao HF, Pan YL. Test-retest and inter-rater reliability for the Comprehensive Developmental Inventory for Infants and Toddlers Diagnostic and Screening Tests. Early Hum. Dev. 2005; 81: 927– 37.
9 Wu HY, Liao HF, Yao G, Lee WT, Wang TM, Hsieh JY. [Diag-nostic accuracy of the motor subtest of Comprehensive Develop-mental Inventory for Infants and Toddlers and the Peabody Developmental Motor Scales-Second Edition.] Formos. J. Med. 2005; 9: 312–22 (in Chinese).
10 Wang TM, Liao HF. [Assessment accuracy and cut-off points of Comprehensive Developmental Inventory for Infants and Toddlers (CDIIT).] Bull. Spec. Educ. 2007; 32: 1–15 (in Chinese). 11 Wang TM. [Predictive validity of Comprehensive Developmental
Inventory for Infants and Toddlers (CDIIT).] Bull. Spec. Educ. 2005; 29: 1–24 (in Chinese).
12 Liao HF, Yao G, Wang TM. Concurrent validity in Taiwan of the Comprehensive Developmental Inventory for Infants and Toddlers who were full-term infants. Percept. Mot. Skills 2008; 107: 29–44. 13 Murphy KR, Davidshofer CO. Validity of measurement: Content and construct-oriented validation strategies. In: Pearson L (ed). Psychological Testing: Principles and Applications, 6th edn. Pren-tice Hall, Upper Saddle River, NJ, 2001; 153–77.
14 Kaufman AS. Piaget and Gesell: A Psychometric analysis of tests built from their tasks. Child Dev. 1971; 42: 1341–60.
15 Silverstein AB, McLain RE, Brownlee L, Hubbell M. Structure of Ordinal Scales of Psychological-Development in infancy. Educ. Psychol. Meas. 1976; 36: 355–59.
16 Wachs TD, Hubert NC. Changes in the structure of cognitive-intellectual performance during the 2nd year of life. Infant Behav. Dev. 1981; 4: 151–61.
17 Banerji M. Factor structure of the Gesell School Readiness Screen-ing Test. J. Psychoeduc. Assess. 1992; 10: 342–54.
18 Reilly A, Eaves RC. Factor analysis of the Minnesota Infant Devel-opment Inventory based on a Hispanic migrant population. Educ.
Psychol. Meas.2000; 60: 271–85.
19 Brookshire B, Levin HS, Song JX, Zhang L. Components of execu-tive function in typically developing and head-injured children. Dev. Neuropsychol. 2004; 25: 61–83.
20 Brownell CA. Combinatorial skills: Converging developments over the second year. Child Dev. 1988; 59: 675–85.
21 Corrigan R. Cognitive correlates of language: Differential criteria yield differential results. Child Dev. 1979; 50: 617–31.
22 Dunn J, Creps C. The Emanuel Miller Memorial Lecture 1995. Children’s relationships: Bridging the divide between cognitive and social development. J. Child Psychol. Psychiatry 1996; 37: 507–18.
23 Chen MH, Chen PC, Jeng SF et al. High perinatal seroprevalence of cytomegalovirus in northern Taiwan. J. Paediatr. Child Health 2008; 44: 166–69.
24 Rin H, Schooler C, Caudill WA. Symptomatology and hospitaliza-tion: Culture, social structure and psychopathology in Taiwan and Japan. J. Nerv. Ment. Dis. 1973; 157: 296–312.
25 Fabrigar LR, Wegener DT, MacCallum RC, Strahan EJ. Evaluating the use of exploratory factor analysis in psychological research. Psychol. Methods 1999; 4: 272–99.
26 Sharma S. Factor analysis. In: Kent T, Sellers P, eds. Applied Multivariate Techniques. John Wiley & Sons, New York, 1996; 90–143.
27 Cliff N. The relation between sample and population characteris-tics vectors. Psychometrika 1970; 35: 163–78.
28 Tucker LR, Koopman RF, Linn RL. Evaluation of factor analytic research procedures by means of simulated correlation matrices. Psychometrika 1969; 34: 421–60.
29 Horn JL. A rationale and test for the number of factors in factor analysis. Psychometrika 1965; 30: 179–85.
30 Salter K, Jutai JW, Teasell R, Foley NC, Bitensky J, Bayley M. Issues for selection of outcome measures in stroke rehabilitation: ICF Participation. Disabil. Rehabil. 2005; 27: 507–28.
31 McCall RB, Hogarty PS, Hurlburt N. Transitions in infant sen-sorimotor development and prediction of childhood IQ. Am. Psychol. 1972; 27: 728–48.
32 Gioia GA, Isquith PK. Ecological assessment of executive function in traumatic brain injury. Dev. Neuropsychol. 2004; 25: 135–58. 33 Bayley N. Bayley Scales of Infant and Toddler
Development-Technical Manual, 3rd edn. The Psychological Corporation, San Antonio, 2006.
34 Shore C. Combinational play, conceptual development, and early multiword speech. Dev. Psychol. 1986; 22: 184–90.
35 Piaget J. The Origins of Intelligence in Children. International University Press, New York, 1952.
36 Gibson EJ, Pick AD. An Ecological Approach to Perceptual Learning and Development. Oxford University, Oxford, 2000. 37 Kastner JW, May W, Hildman L. Relationship between language
skills and academic achievement in first grade. Percept. Mot. Skills 2001; 92: 381–90.
38 Fawcett AJ, Nicolson RI, Maclagan F. Cerebellar tests differentiate between groups of poor readers with and without IQ discrepancy. J. Learn. Disabil. 2001; 34: 119–35.
39 Nicolson RI, Fawcett AJ. Developmental dyslexia, learning and the cerebellum. J. Neural Transm. Suppl. 2005; 69: 19–36.
40 White S, Milne E, Rosen S et al. The role of sensorimotor impair-ments in dyslexia: A multiple case study of dyslexic children. Dev. Sci. 2006; 9: 237–55.
41 Diamond A. Close interrelation of motor development and cogni-tive development and of the cerebellum and prefrontal cortex. Child Dev. 2000; 71: 44–56.
42 Shaffer DR, Willoughby T, Wood E. Cognitive development: Information-processing perspectives. In: Symington S, ed. 1st Canadian edn. Developmental Psychology: Childhood and Adoles-cence. Nelson Thomson Learning, Toronto, 2002; 258–99.