Quantifying the
Future
Impact
of
Disease
on
Society: Life
Table-Based
1Measures of Potential
Life
Lost
Wen-Chung Lee, MD, PhD
Introduction
Quantifying
health status in humanpopulations
has long been ofconsiderableinterest
toepidemiologists
andpublc
health workers.For this purpose, mortal-ityrates, including age-specific and age-adjustedones, arefrequentlyused. How-ever, themortaity
rate does not fully address the issue of premature mortality, theimpact of diseaseordeath, and its cost to society. In recent years, attention has expanded to include such indices as"years
ofpotential
life lost"(YPLL).2
The statisticmeasures the total number of lifeyearslostowingtoprematuredeath
in a population from a certain cause. The definition ofprematuredeath is somewhat arbitrary and varies; for example, deathat theageof lessthan65, 70,or75 years,or>irfls.<
less than the average lifeexpectacy.
Gardner andSanbom2
proposed another approach: estimating the impact ofdeath
W;''''2.'/
by dividing
the lifetime into three seg-ments-investment,production, and con-sumption.Theresultingindex ofpotential 3life
lost is termed"valued
years ofpotential
life lost"(VYPLL).
Tobroaden thescopeofpotential
life losttoreflectthe full impact and the loss to society fromimpairment
ordisability,
Linn andSheps3
recently suggested a modification using the overall
percentage
ofpermanent
dis-abiity
to obtain estimates of "years ofpotential
productivity
lost"
(YPPL).
How-evermanyforms theconceptofpotential
life lost maytake,
indices of this kind have an intuitiveappeal
and are well-suitedtocompare therelativeimportance
of differentcausesofdeathforaparticular
population.
It must be
remembered, however,
that theaforementioned indices of
poten-tial life lostarecross-sectionalin
nature-they
quantify,
foraparticular
disease,
thecurrent losses to the
society.
In otherwords, they are indices for a specific populationat aspecificpoint in time. It is true that the
current
losses appropriately reflectthedisease burdenin apopulation. Yet theeventsof deathordisability tallied in such cross-sectional indices have al-ready takenplace and thus are nolonger preventable.Whensetting health goals for preventingandcontrollingdiseases, whatreally
counts,therefore, liesin thesocietal impacts of the various diseases in the future but not in the present. In this respect, a prospective index ofpotential life lost isasimportantas across-sectional one,ifnotmoreso.Inconstructinganindex ofpotential life lost that embraces the prospective sense, along-ignored problem has to be takenon
properly,
thatis, theproblem of competing risk. In a population, deaths occur notalways from thecauseofdeath underconcern.
Rather, alarge number of causesarein competition totake humanlives.4
Itis
conceivablethat themagnitude ofimpactaparticular causeof deathcanexert onthesocietydepends also onthis
competition.
In apopulation
where themortality
rate from competing causes is very high, the societal impact of theparticular
cause may bediminished
be-cause a vast number ofsubjects
in thispopulation
will die from other causes(competing
deaths) and thereforehavenochance to die from the cause under
concern.
Inasimilarvein,
theimpact
ofaThe author is with the Graduate Institute of
Epidemiology, College of Public Health, Na-tional Taiwan University, and the National Defense MedicalCenter,Taipei,Taiwan.
Requests for reprints should be sent to Wen-Chung Lee,MD,PhD,Graduate Institute of
Epidemiology, National TaiwanUniversity,No.
1,Jen-AiRd,1st Sec,Taipei, Taiwan,Republicof
China.
This paper was accepted November 8,
1996.
particular cause may be higher in a populationwith low competition. Unfortu-nately,theaforementionedcross-sectional indicescannot reflect this simple fact.
Inthis paper I propose new indices ofpotential life lost that are prospective in nature andcanproperlyreflectthe effects of competing risks. The computation of thenewindices isas simple as that of the old ones, requiring no more than a standard life-table calculation. I will illustratethe methodologywith real-world aswell as hypothetical data.
Life
Table-Based
Measures
ofPotential
Life Lost
We begin by introducing "lifetime yearsofpotential life lost" (LYPLL) as a new measureofhealth status in a popula-tion. LYPLL is defined as the expected years ofpotential life lost owing to the particular cause under concern during a subject's lifetime.Asubject loses nothing if heorshelives long enoughto passthe upper cutoff age in the definition of premature mortality. Alternatively, the subject may die young, and therefore someyearsof potentiallifearelost.If the causeof thisprematuredeath happensto be the one underconcern, thelostyears naturally should be counted. If not, the loss is not attributed to the particular cause. The best way to calculate the expected value ofyears lost under these various
possibilities
is to resort to a life-tablemethodology.5
In this case a hypothetical cohort of 100 000 individu-als is defined at age0. Subsequently, the numberofperson-years canbecalculated in each5-yearage groupof the hypotheti-cal cohort. Theage groups are0-4, 5-9,
...
80-84,
85+ and are indexedby
i(i= 1,
2, ...,
18). The number of person-yearsin eachagegroupcalculated from the life table is denoted byyi.
LYPLL for a particular cause can then be esti-mated with thefollowingsimple
formula: LYPLL= Yi mi (75
-(Si-
2.5))]/100 000,
wheremi
is theage-specific
mortality
rateof the
particular
cause under concern. Notethatherethecutoffageofprematuremortality
isdefinedas75years;however,
the formula can
easily
be modified for other definitions ofprematuremortality.
The life-table
methodology
can also beapplied
toestimate lifetime VYPLL and YPPL. Thecalculationspresented
inthispaper rely on an abridged life table (5-year age groups); for a more refined estimation, one can resort to a complete life table.
Itis of interesttofollowa hypotheti-cal cohortbeginningat an ageother than 0,say25, andcalculate the expected value of lost years, using the same principle outlined above. The result can be inter-pretedas the expected years of potential life lost (EYPLL) during the remaining lifetime (or simply, in the future) of a subject now aged 25. Such an index is denoted
EYPLL25
(EYPLLX forage x, in general). Note that the previously dis-cussed LYPLL isjust theEYPLLO
now. Just as a table with life expectancies at various agesis frequentlyused as a basis for the computation of life insurance premiums, annuities, and other life contin-gencies,atable ofEYPLLXatvariousages x may then have much to tell. For one thing, it helpstoidentify
whowillbenefit moreif thecauseof death underconcern iseliminated from the population.The above proposition discusses expected years lost in the future for a single subject. Now we can consider expected years lost in the future for an entire
population.
Apopulation
is com-posed ofsubjects
of varied ages. Letqi(i
= 1,2,
..., 18) denote its age structure, that is,qi
is the proportion ofsubjects
in the i'th age group. The expected(future)
years ofpotential
life lostofarepresentative
sample of 100 000subjects
from thepopulation (denoted
as EYPLLP) can then be approximated by thefollowing
formula:EYPLLP
=| qi
EYPLL5i-5]
100 000.Mathematically,
theaboveexpression
for EYPLLPis similarto thatof YPLLper 100000population
(YPLL per 100000=[i1qi*mi.
*(75-(5i-2.5))]
.100
000),
bothbeing
weighted
measuresbasedontheage structureof the
popula-tion.HoWever,
the traditional YPLL is cross-sectional in nature,measuring
the current lost yearsowing
to thecause-specific
death in thepopulation,
whereas the EYPLLP embraces theprospective
sense,
quantifying
the cumulative lost years from now on for thesubjects
presently
alivein thepopulation.
Itshould benoted that thenewindicesofpotential
life lost(LYPLL,
EYPLL,
andEYPLLP),
although they
haveaprospective
interpre-tation,
areactually
based on across-sectional life table.Thecredibilityof such anapproachwill be discussedlater.
Besides having the desirable feature ofbeing prospective (futuristic) in nature, the newly proposed indices have also properly taken into account theeffectof competing causes of death. The key hinges on the use of life table-derived person-years. Everything else being the same, apopulation withahigher mortality rate from competing causes will have fewerperson-years left in the successive ageintervalsduring thefollow-up of the life-table cohort and therefore will be associated with lower values of LYPLL, EYPLL, and EYPLLP. Conversely, a population withalower competing death ratewillhavemore person-yearsleft and thus be associated withhigher values of these indices. In other words, the life table-derived indices ofpotential life lost doaccurately reflectourbelief that, ina population where deaths from othercauses are dominant, the cause of death under concern shouldnaturally playarelatively minorrole, and inapopulation where the competing deathrateislower, the particu-larcause mayhaveachancetofullyexert itsimpact.
Examples
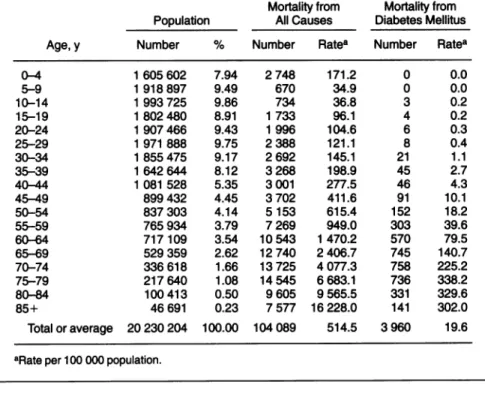
Table 1 presentsthe
population
size and structure and mortality rates for all causes and for diabetes mellitus in Tai-wan, 1990, extracted from the official vital statistics. The purpose here is to characterize theimpact
of death from diabetesin theTaiwanesepopulation.
The impactmay differ between the male and femalepopulations;
for ease ofillustra-tion,
ananalysis by
sex isnotpresented.
Using 5-year
agegroupage-specific
totalmortality
rates,webegin by
applying
the standard life-tabletechnique
(Chiang's
method5)
to derive the person-years in each5-year
age groupafter thefollow-up
ofhypothetical
cohorts. Thecohortsstartfromages
0, 5,..
.,70,
respectively.
Next we calculate,using
the aforementionedformula,
the EYPLLX at various ages x(for
x=0,
5,
...,70)
and the EYPLLP. The resultsareshown in Table 2. Foreaseof
interpretation,
the results ofEYPLLx
are
presented
indays,
notyears. Note that LYPLL isEYPLLO
(64.6
days)
for theage group 0-4 years. Forcomparison,
the table also shows thetraditionally
defined YPLL(owing
todiabetesmellitus)
for the entirepopulation
aswell as per 100 000population.
The EYPLL and LYPLL are
TABLE
1-Population
Size andStructure andMortality
Ratesfor AllCauses and for Diabetes Mellitus In Taiwan, 1990Mortality from Mortality from Population AllCauses Diabetes Mellitus
Age, y Number % Number Ratea Number Ratea
0-4 1605 602 7.94 2 748 171.2 0 0.0 5-9 1 918 897 9.49 670 34.9 0 0.0 10-14 1993725 9.86 734 36.8 3 0.2 15-19 1802480 8.91 1 733 96.1 4 0.2 20-24 1907466 9.43 1 996 104.6 6 0.3 25-29 1971 888 9.75 2 388 121.1 8 0.4 30-34 1855475 9.17 2 692 145.1 21 1.1 35-39 1642 644 8.12 3268 198.9 45 2.7 40-44 1081 528 5.35 3 001 277.5 46 4.3 45-49 899432 4.45 3702 411.6 91 10.1 50-54 837303 4.14 5153 615.4 152 18.2 55-59 765 934 3.79 7269 949.0 303 39.6 60-64 717109 3.54 10543 1470.2 570 79.5 65-69 529 359 2.62 12 740 2 406.7 745 140.7 70-74 336618 1.66 13 725 4 077.3 758 225.2 75-79 217 640 1.08 14 545 6 683.1 736 338.2 80-84 100 413 0.50 9 605 9565.5 331 329.6 85+ 46691 0.23 7577 16 228.0 141 302.0 Total or average 20 230 204 100.00 104 089 514.5 3 960 19.6 aRate per 100 000population.
TABLE 2-LifeTable-DerivedIndices of PotentialLifeLostowing to Diabetes MellitusIn Taiwan,1990
Person-Years from Follow-upof100000Subjects,
Startingfrom EYPLLa Age, y Age0 Age 5 ... Age65 Age 70 (inDays)
0-4 497869.7 ... ... ... ... 64.6b 5-9 495307.1 499563.9 ... ... ... 65.1 10-14 494419.7 498668.9 ... ... ... 65.3 15-19 492780.2 497015.3 ... ... ... 65.2 20-24 490313.0 494526.9 ... ... ... 65.3 25-29 487554.3 491744.5 ... ... ... 65.3 30-34 484321.5 488483.9 ... ... ... 65.4 35-39 480176.6 484303.3 ... ... ... 65.0 40-44 474496.7 478574.7 ... ... ... 63.7 45-49 466405.9 470414.4 ... ... ... 62.1 50-54 454612.2 458519.3 ... ... ... 58.2 55-59 437243.6 441001.4 ... ... ... 52.5 60-64 411736.2 415274.8 ... ... ... 42.1 65-69 374094.5 377309.6 ... 471623.8 ... 26.5 70-74 319063.3 321805.4 ... 402245.4 453748.1 9.3 75-79 245519.6 247629.7 ... 309528.4 349159.8 0.0 80-84 165033.4 166451.8 ... 208058.9 234698.3 0.0 85+ 154754.8 156084.8 ... 195100.5 220080.8 0.0 EYPLLP 16494.0 years
YPLLfor theentire 31020.0years
population
YPLL per 100 000 153.3years
population
interpreted accordingly. We see that the
LYPLLindex isequalto64.6. Thismeans
that a Taiwanese will, on average, lose 64.6daysofpotentiallifeduringhisorher
lifetimeowingtodiabetesmellitus.From the EYPLLindices, onealso notices that
the impact of diabetes is different for subjects of different ages. For all age
groups younger than 45 years, the
ex-pectedloss in thefutureowingtodiabetes is approximately equal, whereas the
ex-pected future loss declines sharply for
every yearasubjectmanagestostayalive
past45. Onecanalsoconsiderthe "what if" scenario. It can be seen that those
subjects aged 30-34 years in Taiwan would receive the most benefit (i.e., EYPLL attains maximum) if diabetes mellituswere nolongerathreattohuman
lives. Without theproposednew indices,
all thesefindingsarenoteasilydiscernible from a simple inspection of a table of
age-specific mortalityrates.
Itisof interesttocompareEYPLLP with YPLL, inasmuch as they are both
population-level
indices.When thepopu-lation size is standardized to 100000, EYPLLP is considerably larger than YPLL(16494.0vs153.3).This isbecause EYPLLP,asexplained earlier,isa
cumula-tive indexcapturingthe presentaswellas
futureloss,whilethe YPLL index reflects
onlythe loss in the currentyear.
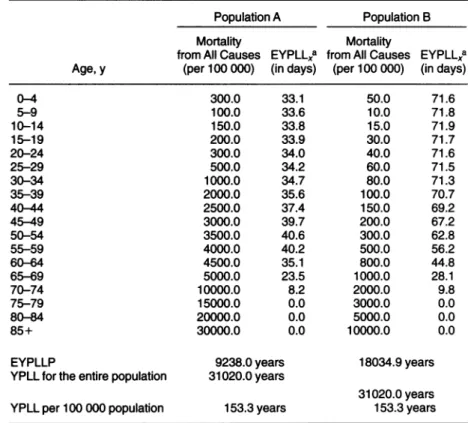
Next, let us consider the effect of
competing deaths. Table 3 presents two
hypothetical populations, A and B. The
populationsizes andstructuresaswellas
themortalityratesfrom diabetes mellitus
ofthesetwopopulationsarethesame as
those of the Taiwanese population, but
competingcauses of death playdifferent
roles. Population A has a
highet
totalmortalityratethan that of the Taiwanese
population, while population B has a
lower one.The EYPLLindices differ in thesepopulations, especiallyforthe
youn-gersubjects.Compared with the
Taiwan-ese population, the EYPLL indices are
lower for allagesforpopulation A,while
thereverseistrueforpopulationB. These
findings make sense because the
impor-tanceof death from diabetesmellitus fora
subjectinagivenpopulationisbasednot
only onthe magnitudeofmortalityfrom
diabetesper se buton themagnitude of
competingdeathsaswell.The maximum
value of EYPLL occurs at age 50 in
populationA(vsage30 in the Taiwanese
population)andatage10inpopulationB. These findings imply that if diabetes mellitus were eliminated, the benefit a
subject would enjoy depends on which populationhe or shebelongsto, and that
Note. EYPLL=expected yearsofpotentiallifelost; EYPLLP = EYPLL ofa
representative
sampleof 100 000subjectsfrom thepopulation;YPLL=years ofpotentiallifelost. aForx=0,5,10,...,70.
the group of subjects (young,
middle-aged, or old) who would benefit most
differsfrompopulationtopopulation. As forthepopulation-levelindex of EYPLLP, its value is lower (9238.0) in population A and higher (18034.9) in population B than in the Taiwanese population (16494.0). Thus we see that
although the current burden of deaths from diabetes is the same in these three
populations(YPLLper100000= 153.3),
futureimpactsarenot(ifcurrentmortality prevails). Froma public health point of
view, the prevention and control of diabetes mellitus should be given ahigh
priority in population B, while it is comparatively lessurgentin population A.
Discussion
In this paper Ipropose newindices
of potential life lost to quantify future impacts of specific causes of death on
society. Similar approaches that also rely
on life-table methodology have been
reported.6'7 In those studies, the contribu-tionofaspecificcauseofdeathtogeneral mortality is measured by the "potential gain in life expectancy," defined as the differencebetweentheexpectation of life before and after the complete or partial
elimination of that cause. While the
potential gain in life expectancy also
answersthe "whatif"question, I believe
themethod described here, which modi-fiestheexisting indices of YPLL, VYPLL,
and YPPL, better and more succinctly
reflectsthesocietal and economic impacts ofaspecific disease inapopulation.
It should be pointed out, however, that the proposed new indices, though
claimed to be prospective in nature, are
actually basedon a"current" rather thana
"cohort" life table. A current life table projects the lifespanofeachindividual in a hypothetical cohorton the basisofthe
cross-sectional death rates. The assump-tionanderlying theprocedureisthat each
subjectin thepopulation will be subject throughout his or her life to the same
age-specific mortality rates prevailing in
the current year. Clearly, this is a bold
assumption. To avoid the problem, one
couldrecord the actual mortality
experi-enceofaparticulargroupof individualsin
thegiven populationfromthe first birthto
the last death, construct the cohort life
table, and then calculate the
cohort-specific indices of potential life lost.
However, this is an all but impossible task.Recently,theage-period-cohort mod-eling technique has been adopted to overcome this kind of difficulty. This
technique has successfully obtained,
with-out actual follow-up, the cohort-specific lifetime risks of breastcancerin Connecti-cut8 and the cohort life expectancies in
Taiwan.9 Thesametechniquecanalsobe
appliedtothe present context. However, suchamodeling technique is beyond the scopeofthispaper.
It is of interest to note that the individual-level indices of LYPLL and
EYPLL are defined only through the
age-specificmortalityrates(forthecause
under concern and for all causes) and
therefore are invariant with respect to
changes in population sizes and struc-tures. Thisproperty maybe useful when
onewishestomake acomparisonof the
impacts of a particular disease between different populations or across different
districthealth authorities.By contrast,the
traditional YPLL index, being an index
lacking a denominator, can confound a
valid between-population comparison.'0 Another application for the
individual-levelindicesmaybetotheproblemofage
adjustment. LYPLL, for example,canbe
viewed as a summary condensing the
whole table of age-specific rates into a
single value. Such a summarization pro-cess is what characterizes the dozen
different indices of age adjustment, of
which the"comparativemortalityfigure" (direct adjustment) and the "standard
mortality ratio" (indirect adjustment) are
themostfrequently used.1' Both of these
indices, however, call for an external
"standardpopulation"onwhich compari-sonsof the mortalityratesoftwoor more
populations canbe based. The choice of
this external standardpopulationisnot at
allstandardized but oftenquite arbitrary, leadingto opendebates. In contrast, one can see that, as demonstrated here, the
calculationofLYPLL doesnotneedany
"standard"-neither in the sense of a
standard population structure, as in the
direct age-adjustment methodology, nor
in thesenseofstandardmortality rates,as
in theindirect one-because the LYPLL
index quantifies a certain aspect of the
TABLE
3-Indices
ofPotential Life Lost in Two Hypothetical Populations, ShowingtheEffect of Competing Causes of DeathPopulation A Population B
Mortality Mortality
from All Causes EYPLLXa fromAllCauses EYPLLXa
Age,y (per100000) (in days) (per 100 000) (in days)
0-4 300.0 33.1 50.0 71.6 5-9 100.0 33.6 10.0 71.8 10-14 150.0 33.8 15.0 71.9 15-19 200.0 33.9 30.0 71.7 20-24 300.0 34.0 40.0 71.6 25-29 500.0 34.2 60.0 71.5 30-34 1000.0 34.7 80.0 71.3 35-39 2000.0 35.6 100.0 70.7 40-44 2500.0 37.4 150.0 69.2 45-49 3000.0 39.7 200.0 67.2 50-54 3500.0 40.6 300.0 62.8 55-59 4000.0 40.2 500.0 56.2 60-64 4500.0 35.1 800.0 44.8 65-69 5000.0 23.5 1000.0 28.1 70-74 10000.0 8.2 2000.0 9.8 75-79 15000.0 0.0 3000.0 0.0 80-84 20000.0 0.0 5000.0 0.0 85+ 30000.0 0.0 10000.0 0.0
EYPLLP 9238.0 years 18034.9 years
YPLLfor the entire population 31020.0 years
31020.0years YPLLper100000population 153.3years 153.3years Note.Thepopulationsizes and structures as well as the mortality rates from diabetes mellitus
arethesame asthoseofthe Taiwanesepopulation,but thecompetingcausesofdeath play
different roles. PopulationAhas a higher total mortality rate than that of the Taiwanese
population,whilepopulationB has a lower one. EYPLL=expected years of potential life
lost;EYPLLP=EYPLLofarepresentative sample of 100 000 subjects from thepopulation; YPLL=yearsof potential life lost.
health status of the subjects in a given population. Such information (expected loss during lifetime)represents an inher-ent characteristic of the population in question and naturally does not concern anyotherpopulations. With this desirable property of indifference to thechoice of standard, the application of the LYPLL index as an alternative method of age adjustment deserves further study. E
References
1. Rothman KJ. ModemEpidemiology. Bos-ton, Mass:Little, Brown & Co Inc; 1986. 2. Gardner JW,SanbornJS. Yearsof potential
life lost (YPLL)-what does itmeasure? Epidemiology. 1990; 1:322-329.
3. Linn S, Sheps S.Disability and the years of
potential productivity lost: modifying the yearsofpotentiallife lost and the invest-ment-production-consumer model by dis-ability level. Epidemiology. 1993;4:449-454.
4. Chiang CL. Competing risks in mortality analysis. Annu Rev Public Health. 1991;12: 281-307.
5. Chiang CL. The Life Table and Its Applica-tions. Melbourne, Fla: Krieger Publishing
Co;1984.
6. Tsai SP, Lee ES, Hardy RJ. The effect ofa
reduction in leading causes of death: potential gains in life expectancy. Am J Public Health. 1978;68:966-971. 7. TsaiSP, Lee ES, Kautz JA. Changes in life
expectancy in the United States due to declines in mortality, 1968-1975. Am J EpidemioL1982;116:376-384.
8. Campbell MK, Feuer EJ, Wun LM. Cohort-specific risks of developing breast cancer to age 85 in Connecticut. Epidemiology.
1994;5:290-296.
9. Lee WC, Hsieh RL. Estimatinglife expec-tancyusing an age-cohort model in Tai-wan. J Epidemiol Community Health.
1996;50:214-217.
10. Marlow AK. Potential years of life lost: what is the denominator? J Epidemiol Community Health. 1995;49:320-323. 11. Inskip H, Beral V, Fraser P. Methods for
age-adjustment ofrates.StatMed. 1983;2: 455-466.
AMERICA'S
CHILDREN:
TRIUMPH
OR TRAGEDY
ByCharles N. Oberg, MD, MPH, Nicholas A. Bryant, andMarilyn L Bach, PhD
America's children are in astate of crisis. Their represen-tationamongthepooranddisadvantaged hasgrown at
anunprecedented rate. By describing tragiccasesand presenting aggregate data this bookconveystheseriousness andpervasiveness of these problems. The facts are startling. In theworld's richest country
El 21.9% of thechildren live in poverty
L 9.8million children under age 18 are without health
insurance
LI 100,000children fall asleep homeless every night The authors of this book propose a solution to this plight in theform of an "IntegratedChildren's Network." This network outlines sixinterlocking "gears"necessaryforthe
health of ourchildren: economicsecurity, medical care, shelter, proper nutrition, child care,andearlyeducation.
Specific recommendationsareprovidedon how current
mechanisms can be improved toenhanceservices forour
children in these areaswithoutcreatingnewbureaucracies. America'sChildren: TriumphorTragedy ISBN 0-87553-218-7 *(StockNo.071) * 1994 * 94pp.
$22.50for nonmembers $15.75for APHA members*
Toorder:(301) 893-1894 Tofax:(301) 843-0159 (Add shipping&handlingcosts toallprices)
*APHAmembersmaypurchaseupto2copiesof the bookatthisprice. American Public HealthAssociation PublicationsSales
Department 753