* Corresponding author. E-mail: [email protected]
Texture classification using fuzzy uncertainty texture
spectrum
Yih-Gong Lee*, Jia-Hong Lee, Yuang-Cheh Hsueh Department of Computer and Information Science, National Chiao Tung University,
Hsinchu 30050, Taiwan, ROC
Received 22 October 1995; accepted 30 November 1997
Abstract
A new method using fuzzy uncertainty, which measures the uncertainty of the uniform surface in an image, is proposed for texture analysis. A grey-scale image can be transformed into a fuzzy image by the uncertainty definition. The distribution of the membership in a measured fuzzy image, denoted by the fuzzy uncertainty texture spectrum (FUTS), is used as the texture feature for texture analysis. To evaluate the performance of the proposed method. supervised texture classification and rotated texture classification are applied. Experimental results reveal high-accuracy classification rates and show that the proposed method is a good tool for texture analysis. ( 1998 Elsevier Science B.V. All rights reserved.
Keywords: Fuzzy set theory; Texture classification; Uniform surface uncertainty
1. Introduction
Texture analysis is an import technique in image processing. The major problem of texture analysis is the extraction of texture features. The general methods for feature extraction are to estimate local features at each pixel in a texture image and then derive a set of statistics from the distributions of the local features. The surveys and comparisons of different methods for feature extraction can be found [3,6]. A new method for texture feature extraction based on fuzzy theory is presented. Fuzzy set theory [2,8] is a mathematical tool in modeling ambiguity or uncertainty and has been applied in image processing [4,5,7]. In texture analysis, we define uniform surface
0925-2312/98/$ — see front matter ( 1998 Elsevier Science B.V. All rights reserved.
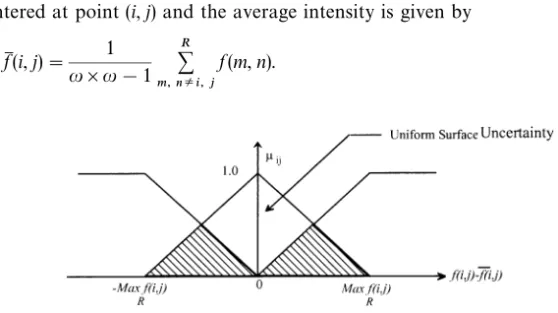
Fig. 1. Fuzzy membership function for a uniform surface.
uncertainty, which ranges from 0 to 1, for a point p in the texture as the degree of p belong to uniform physical surface (as defined by the neighborhood average intensity). Therefore, we can transform a grey-scale image into a fuzzy image by suing the uncertainty definition. For a more rough texture, the intensity of pixels in its corresponding fuzzy image will cause a smaller value. The membership distribution of the fuzzy image which transformed from a texture, denoted as Fuzzy Uncertainty Texture Spectrum (FUTS), is then used as a distinguishing feature for texture classi-fication. alternatively, FUTS owns the rotation invariant property and this seems to be desirable. It is important in object recognition from texture and inspection applications where controlling the environment to ensure that the samples to be tested have the same orientations as the training samples is either costly, difficult, or even impossible. To evaluate the performance of the proposed method, supervised texture classification and rotated texture classification are applied to discriminate natural texture images extracted from Brodatz album [1]. Experimental results reveal high-accuracy rates by the proposed method.
2. Fuzzy uncertainty texture spectrum and rotation invariant property
A grey-scale image f can be transformed into a fuzzy image by a fuzzification function/. A variety of fuzzification functions can be used to reflect the degree to which a pixel intensity represents a uniform physical surface. However, textural properties need neighborhood information about the pixel in order to define ad-equately membership functions. Here, a simplified triangular membership function used to describe a uniform surface illustrated in Fig. 1 and the uniform surface uncertainty is defined as
kij"1!
C
D f (i, j)!fM (i, j)DmaxR f (i, j)D
, (1) where maxR f (i, j) is the maximum intensity within the (u]u) surface region R centered at point (i, j) and the average intensity is given byfM (i, j)" 1 u]u!1 R + m, nEi, j f (m, n). (2)
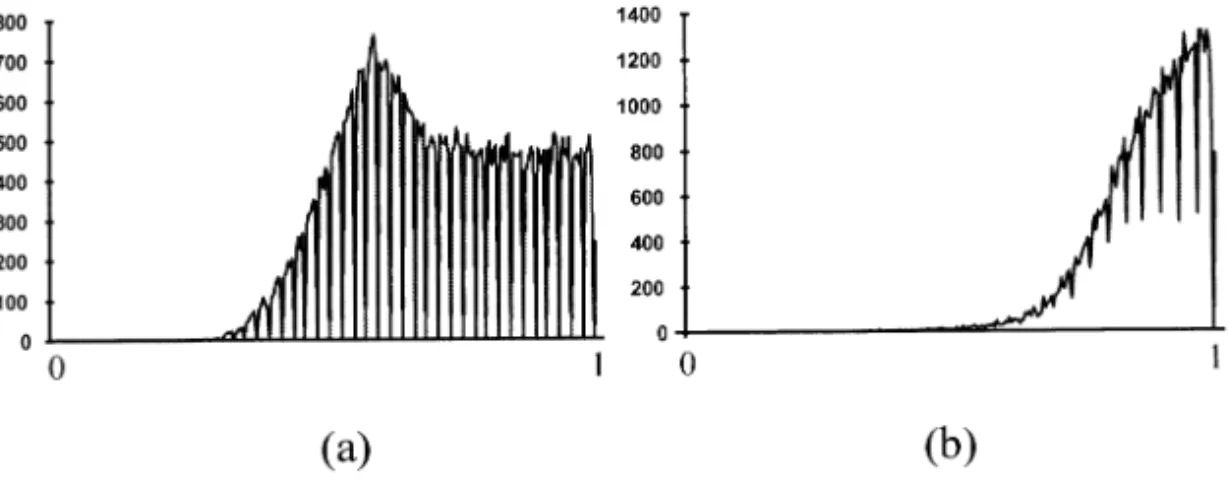
Fig. 2. Fuzzy image and FUTS of texture (a) D77, (b) D90, respectively.
Note that if f (i, j) is equal to the average neighborhood intensity fM (i, j) then f (i, j) possesses “full membership” to the surface region R; meaning of the pixel lies on uniform surface, Alternatively, if f (i, j) is significantly different than the average neighborhood intensity fM (i, j), then kijP0. That means the pixel f(i, j) not lies on uniform surface.
To analyze a texture image, we can transform it into its corresponding fuzzy image by using Eq. (1). As the value in fuzzy image represents the local aspect, the statistics of these values in the fuzzy image should reveal its texture surface information. The occurrence distribution of these values is called the fuzzy uncertainty texture spectrum (FUTS), with the abscissa indicating the belief degree and the ordinate representing its occurrence frequency. In the practical application of classification, the uniform surface uncertainty values (range from 0 to 1) in a fuzzy image are uniformly quantized into ¸ levels to reduce the calculation time for the pursuit statistics. Formally, the unnormalized frequency is defined by
Sj(v)"dMv"xki, j](¸!1)y; (i, j)3f N, (3)
whered denotes the number of elements in image f and 04v4¸!1.
To evaluate the performance of the extracted feature by using the proposed method, we calculate and compare the FUTS for two Brodatz textures D77 and D90 [8], respectively (Fig. 2). The two textures are shown in Fig. 3f and g and their corre-sponding FUTS are displayed in Fig. 2a and b. From Fig. 2, we can find that the measured FUTS are distinguishable from each other so they can serve as a good discriminating tool in texture classification. The FUTS of D90 shows a higher frequency than D77 when the measured uncertainty is closed to 1 and this gives that the texture image D90 is more smooth than D77.
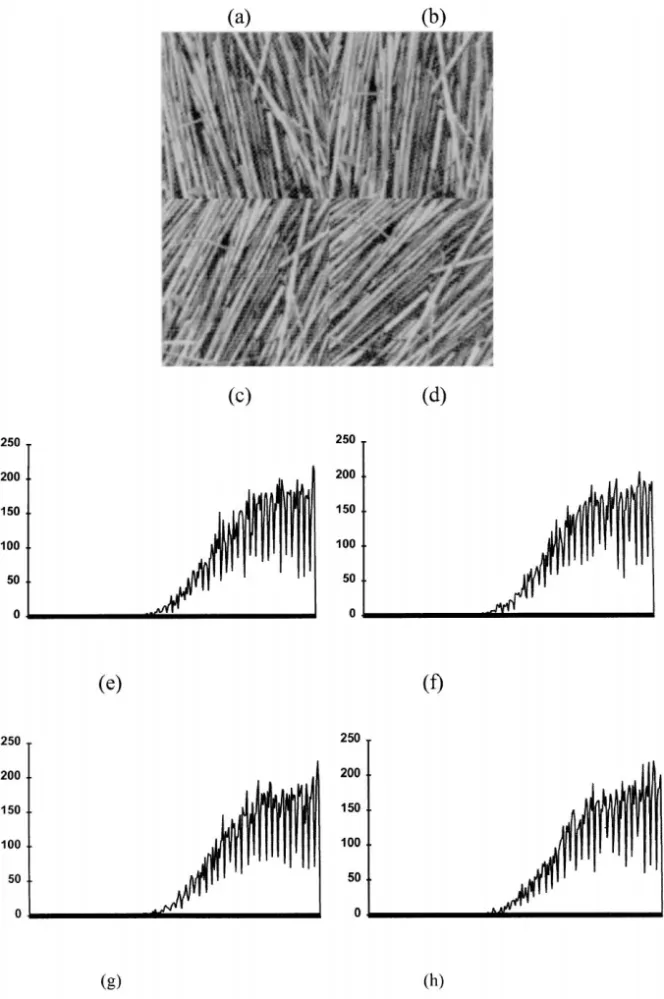
In most practical applications of texture classification, the rotation invariant property seems to be desirable. The definition of Eq. (1) is rotation invariant if we use a disk region to compute the fuzzy uncertainty. This implies that the corresponding FUTS is rotation invariant. Fig. 4a—d displays an example of straw textures with different orientations and their corresponding FUTS with 7]7 surface region. From
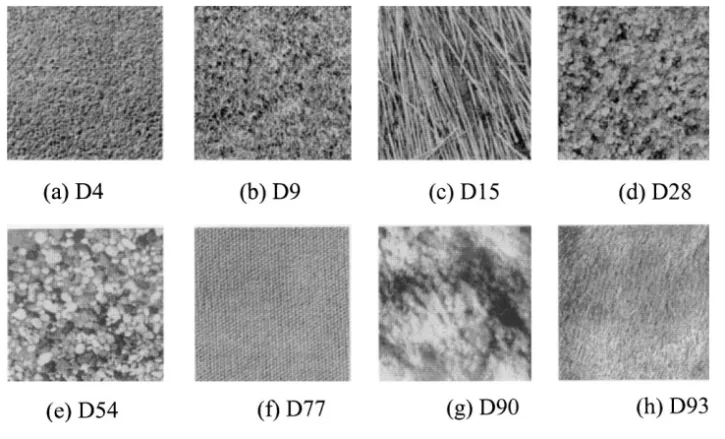
Fig. 3. Eight texture images extracted from Brodatz Album.
Fig. 4e—h, we can find that these FUTS are similar from each other and this shows the ability of FUTS to classify rotated texture images.
3. Texture classification and results
To demonstrate the discrimination performance of the FUTS, we use a supervised classification with minimum distance rule to classify nature images, extracted from Brodatz album. Eight 256]256 natural images with 256 gray levels are used for the texture classification (see Fig. 3). Each texture image is divided into 16 nonoverlap-ping 64]64 subimages. The subimages are further divided into two sets — training and test set. The evaluation is performed using a supervised classification over these test subimages. In the process of classification, the uniform surface uncertainty values (range from 0 to 1) in a fuzzy image are uniformly quantized into 256 levels to reduce the calculation time for the pursuit statistics. The procedure of our experiment is described as follows:
Step 1: When this supervised texture classification algorithm is applied. We have to select one subimage as the training set from each texture image.
Step 2: For each texture type k, calculate the FUTS of the corresponding training samples and denote it as Sk, where Sk"Sk( j), k"1—8 and j"0,2,255.
Fig. 4. (a)—(d) are four natural texture images with different orientations, and (e)—(h) are their corresponding FUTS, respectively.
Table 1
The result of test set classified by using FUTS method (average accuracy rate is 97.5%). The average surface intensity, fM (i, j), is given over an (7]7) region
Classification result ID. D4 D9 D15 D28 D54 D77 D90 D93 D4 15 D9 15 D15 15 D28 15 D54 15 D77 15 D90 2! 13 1! D93 15 ! Misclassification.
Step 3: Calculate the FUTS for each considered test subimages and denote it as T, T"¹( j).
Step 4: Calculate the distance of FUTS between the considered test subimage and all the training result Sk as
D(T, Sk)"255+
j/0D¹( j)!Sk( j)D.
(4) Step 5: The test subimage will be assigned to class l such that D(T, Sl) is the minimum among all the D(T, Sk)@s.
The experimental result listed in Table 1 shows 97.5% average accuracy rate.
4. Rotated texture classification
In order to show the goodness of the proposed method in capturing the rotation effects on real texture, we show synthesized realizations of real textures that are subjected to different rotations and compare them to rotated real textures. Eight different natural textures (see Fig. 3) chosen from Brodatz album have been tested. The experiments were performed in two stages. The first stage is the training phase where for each texture class a 128]128 image was taken and assumed as a rotation of 0°. We compute the corresponding FUTS of each training sample. In the second stage of the experiment, which is the classification stage, each texture class is imaged into eight 128]128 tested images under different rotations which are randomly selected from 0° to 360°. For each considered tested image, we calculate its corresponding FUTS and compute the distance of the FUTS between the considered test sample and
the training result using Eq. (4). Finally, the test sample will be assigned to one class by using minimum distance classifier. The experimental results 100% accuracy classi-fication rates when we use 3]3, 5]5, 7]7, and 9]9 surface regions. This shows that the proposed method is a good tool to classify rotated texture images.
5. Conclusions
A new method using FUTS is proposed for texture analysis in this paper. The classification method is simple, and the number of mathematical operations applied to FUTS is small. Promising results have been obtained with accuracy rate 97.5% by using only one training sample for each texture type. Alternatively, we employ FUTS to rotated texture classification and the result shows 100% accuracy rate. From these experimental results, we conclude that FUTS is an excellent discriminating tool in texture analysis and classification.
Acknowledgements
This work was supported partially by the National Science Council, Republic of China under grant NSC 84-2213-E-009-045. We would like to thank reviewers for their helpful suggestions.
References
[1] P. Brodatz, Textures, A Photographic Album for Artists and Designers, Reinhold Publication, New York, 1968.
[2] J.C. Bezdek, S.K. Pal (Eds.), Fuzzy Models for Pattern Recognition, IEEE Press, New York, 1992. [3] R.W. Conners, C.A. Harlow, A theoretical comparison of texture algorithms, IEEE Trans. Patter Anal.
Mach. Inlell. 2 (1980) 204—222.
[4] K.K. George, M.G. Madan, Fuzzy uncertainty measures in image processing, J. Electron. Imaging 3 (2) (1994) 142—153.
[5] Y.G. Lee, Y.C. Hsueh, Fuzzy logic approach for removing noise, Neurocomputing 9 (1995) 349—355. [6] T.R. Reed, J.M.H. du Buf, A review of recent textures segmentation and feature extraction techniques,
CVGIP: Image Understanding 57 (1993) 359—372.
[7] A. Taguchi, H. Takashima, Y. Murata, Fuzzy filter for image smoothing, SPIE, Nonlinear Image Processing 4 (2180) (1994) 332—339.
[8] L.A. Zadeh, Outline of a new approach to analysis of complex systems and decision process, IEEE Trans. SMC 3 (1973) 28—44.
Yih-Gong Lee was born on 19 March 1969 in Taiwan, Republic of China. He received the B.S. degree in mathematics from National Chung-Hua University of Education in 1991, and he is currently doing his Ph.D in the Department of Computer and Information Science at National Chiao Tung University. His current research interests include fuzzy set theory, texture analysis, genetic algo-rithms and mathematical morphology.
Jia-Hong Lee was born on 11 November 1965 in Taichung, Taiwan, Republic of China. He received the B.S. degree in computer engineering from Tatung Institu-tion of Technology in 1989, and M.S. degree in the Department of Computer and Information Science at National Chiao Tung University from 1989 to 1991. He is currently doing his Ph.D. at the same university. His current research interests include computer graphics, mathematical morphology, fractal geometry, and texture analysis.
Yuang-Chen Hsueh was born on 25 August 1954 in Keelung, Taiwan, Republic of China. He received the B.S. degree in applied mathematics from National Chiao Tung University in 1976, and Ph.D. degree in mathematics from UCLA in 1983. Since 1983, he has been an Associate Professor of the Department of Computer and Information Science at National Chiao Tung University. His current research and teaching interests lie mainly in computeral geometry, computer graphics, mathematical morphology, image algebra, and fuzzy set theory.