Introduction
!Magnolol (M;l"Fig. 1) is a polyphenolic lignan in
the bark of Magnolia officinalis Rehhder & E. Wil-son (Magnoliaceae), which is a frequently pre-scribed Chinese herb for the treatment of anxiety, fever, headache, and neurosis [1]. Various benefi-cial activities of M have been reported, including anti-inflammation [2–5], anticancer [6–9], anti-biotic [5, 10, 11], antispasmodic [12], and antide-pression effects [13, 14]. Most of the in vitro bio-activities of M reported were mainly of the parent form. Nonetheless, in the analysis of the biological fate of polyphenols, it has been increasingly rec-ognized that their parent forms were generally not present in circulation [15]. Therefore, whether the in vitro bioactivities of M could pre-dict the in vivo effects and what are the actual molecules working in vivo remain unanswered. Even if the intravenous pharmacokinetics of M and oral pharmacokinetics of [ring-14C] labeled
M have been previously reported [16, 17], more detailed information of the pharmacokinetics and tissue distribution of M and its metabolites is still lacking. Therefore, this study investigated the pharmacokinetics and tissue distribution of M and magnolol sulfates/glucuronides (M S/G) following intravenous and oral administrations in rats.
Materials and Methods
!Plant material
The crude drug of the bark of Magnolia officinalis was purchased from a Chinese drugstore in Tai-chung, Taiwan. The origin was identified by Dr. Yu-Chi Hou by microscopic examination, and a voucher specimen (CMU-P-1905-03) was depos-ited in the Graduate Institute of Chinese Pharma-ceutical Sciences, China Medical University, Tai-chung, Taiwan.
Abstract
!Magnolol (M) is a polyphenol antioxidant abun-dant in the bark of Magnolia officinalis Rehder & E. Wilson, a popular Chinese herb. To understand the pharmacokinetics and bioavailability of M, Sprague-Dawley rats were intravenously injected with a bolus of M (20 mg/kg) and orally given a single dose and seven doses of M (50 mg/kg). Blood samples were withdrawn via cardiopunc-ture at specific times. Organs including the liver, kidney, brain, lung, and heart were collected at 30 min after the 7th oral dose. The serum and tis-sue specimens were assayed by HPLC before and after hydrolysis withβ-glucuronidase and sulfa-tase. The results showed that after intravenous bolus, the systemic exposure of magnolol glucu-ronides (MG) was comparable with that of M while after oral administration, magnolol
sul-fates/glucuronides (M S/G) were predominant in the bloodstream. Conversely, M was predominant in the liver, kidney, brain, lung, and heart. Among the studied organs, the liver contained the highest concentrations of M and MG. In conclusion, M S/G was the major form in circulation, whereas M was predominant in the liver, kidney, brain, lung, and heart after oral administration of M; among these organs, the liver contained the highest concentra-tions of M and MG.
Abbreviations
!MRT: mean residence time
Supporting information available online at http://www.thieme-connect.de/ejournals/toc/ plantamedica
Pharmacokinetics, Bioavailability, and Tissue
Distribution of Magnolol Following Single and
Repeated Dosing of Magnolol to Rats
Authors Shiuan-Pey Lin1, Shang-Yuan Tsai1, Pei-Dawn Lee Chao1, Ying-Chen Chen2, Yu-Chi Hou1, 3
Affiliations 1School of Pharmacy, China Medical University, Taichung, Taiwan
2Institute of Chinese Pharmaceutical Sciences, China Medical University, Taichung, Taiwan 3Department of Medical Research, China Medical University Hospital, Taichung, Taiwan
Key words l" magnolol l" sulfates/glucuronides l" pharmacokinetics l" tissue distribution l" HPLC l" Magnolia officinalis l" Magnoliaceae received February 26, 2011 revised May 2, 2011 accepted May 3, 2011 Bibliography DOI http://dx.doi.org/ 10.1055/s-0030-1271159 Published online June 1, 2011 Planta Med 2011; 77: 1800–1805 © Georg Thieme Verlag KG Stuttgart · New York · ISSN 0032‑0943
Correspondence Dr. Yu-Chi Hou School of Pharmacy, China Medical University No. 91 Hsueh-Shih Road Taichung 40402 Taiwan
Phone: + 88 6 4 22 03 10 28 Fax: + 88 6 4 22 03 10 28 hou5133@gmail.com
Chemicals
Butyl paraben, cremophor EL, 1,2-propanediol,β-glucuronidase (type B-1 from bovine liver, containing 1 240 000 units/g of β-glu-curonidase) and sulfatase (type H-1 from Helix pomatia, contain-ing 14 000 units/g of sulfatase and 498 800 units/g of β-glucuro-nidase) were purchased from Sigma. L(+)-ascorbic acid and or-tho-phosphoric acid were obtained from Riedel-deHaën AG. Ace-tonitrile, ethyl acetate, and methanol were obtained from J. T. Baker, Inc. Magnolol was obtained from Wako (purity 99 %). n-Hexane was purchased from ALPS Chemical, Ltd. Sodium acetate was obtained from Kohusan Chemical Works, Ltd. Milli-Q plus water (Millipore) was used for all processes.
Instrumentation
The high-performance liquid chromatography (HPLC) apparatus included a pump (LC-6AD; Shimadzu), an UV spectrophotometric detector (SPD-6A; Shimadzu), a chromatopac (C-R6A; Shimadzu), and an autosampler (Series 200; Perkin Elmer). RP-18e column (LiChrospher, 250 × 4.0 mm) was used with a prefilter (Isolation Technologies).
Animals and drug administration
All animal experiments adhered to“The Guidebook for the Care and Use of Laboratory Animals” published by the Chinese Society of Animal Science, Taiwan, ROC). The animal protocol (95-159-D) was approved by the Institutional Animal Care and Use Commit-tee of the China Medical University, Taiwan. Male Sprague-Daw-ley rats (350–450 g) were supplied by BioLASCO and kept at least 2 weeks under a conditioned environment with free access to food and water. Before the experiment, the rats were fasted over-night but drinking water was allowed ad libitum. Food was sup-plied 3 h after M dosing. M solution was prepared by dissolving M in a vehicle composed of equal weight of 1,2-propanediol and cremophor EL to afford a concentration of 20 mg/mL. For the pharmacokinetic study, five rats were given an intravenous bolus of M at 20 mg/kg; in addition, rats were orally given a single dose (n = 5) and seven doses (n = 6) of M at 50 mg/kg by gastric gavage. For the tissue distribution studies, three rats were orally given 50 mg/kg of M thrice daily for seven doses prior to the sacrifice for tissue collection.
Blood specimen collection
In the pharmacokinetic study, blood samples (0.7 mL) were col-lected via cardiac puncture at 5, 10, 15, 20, 30, 45, 60, 120, 240, and 480 min after intravenous dosing and at 5, 10, 15, 30, 60, 120, 240, and 480 min after oral administration. In the tissue distribution study, a blood sample was withdrawn at 30 min after the 7th dose of oral M. The sera were collected by centrifug-ing at 10 000 g for 15 min to obtain the supernatants and stored at−30°C until analysis.
Tissue collection and pretreatment
At 30 min after the 7th dose of M, rats were sacrificed by inhaling CO2and systemically perfused with cool normal saline. Then, the
organs including the brain, liver, lung, heart, and kidney were re-moved, blotted dry with filter paper and accurately weighed. The tissues were homogenized with normal saline (700 mg/mL), and the homogenates were stored at−30°C until analysis.
Quantitation of M in serum and tissue homogenates
To determine the serum concentration of M, 100 µL of serum was added to 100 µL of acetate buffer (pH 5.0), 50 µL of ascorbic acid (200 mg/mL), and 50 µL of 0.1 N HCl, then partitioned with 300 µL of ethyl acetate containing 5.0 µg/mL of butyl paraben as the internal standard. After centrifuging at 10 000 g for 15 min, the supernatant was dried under nitrogen gas and reconstituted with an appropriate volume of acetonitrile before HPLC analysis. For the determination of M concentration in various tissue ho-mogenates, 500 µL of homogenate was added to 100 µL of acetate buffer (pH 5.0), 100 µL of ascorbic acid (200 mg/mL), and 20 µL of 0.1 N HCl, then partitioned with 700 µL of ethyl acetate contain-ing 0.5 µg/mL of butyl paraben as the internal standard. The later procedures followed that of serum samples. For HPLC analysis of both serum and tissues, the mobile phase used was acetonitrile/ 0.1 % ortho-phosphoric acid (48 : 52), and it was run isocratically. The flow rate was 1.0 mL/min with the detection wavelength set at 290 nm.Quantitation of M S/G in serum and tissue homogenates
For serum analysis, 100 µL of serum, 100 µL of sulfatase solution (containing 10 units of sulfatase and 210 units ofβ-glucuronidase in pH 5.0 acetate buffer), and 50 µL of ascorbic acid (200 mg/mL) were added into a light protected test tube and incubated at 37 °C for 120 min, which had been determined by a preliminary study for reaching optimum hydrolysis. For tissue analysis, 500 µL of various tissue homogenates, 100 µL of sulfatase solution (con-taining 10 units of sulfatase and 210 units ofβ-glucuronidase in pH 5.0 acetate buffer), and 100 µL of ascorbic acid (200 mg/mL) were added into a light protected tube and incubated at 37 °C for 120 min, which had been determined by a preliminary study. The concentration of M S/G was calculated from the total M concen-tration after hydrolysis minus that before hydrolysis. The later procedures followed that described above for the quantitation of M in tissue.Quantitation of MG in serum and tissue homogenates
For the analysis of serum, 100 µL of serum, 100 µL of β-glucuroni-dase solution (containing 100 units ofβ-glucuronidase in pH 5.0 acetate buffer), and 50 µL of ascorbic acid (200 mg/mL) were added into a light protected test tube and incubated at 37 °C for 60 min, which had been determined by a preliminary study for reaching optimum hydrolysis. For tissue analysis, 500 µL of ho-mogenates, 100 µL ofβ-glucuronidase solution (containing 100Fig. 1 Chemical struc-ture of magnolol (MW 266.33).
units ofβ-glucuronidase in pH 5.0 acetate buffer), and 100 µL of ascorbic acid (200 mg/mL) were added into a light protected tube and incubated at 37 °C for 120 min, which had been determined by a preliminary study. The concentration of MG was calculated from the total M concentration after hydrolysis minus that before hydrolysis. The later procedures followed that described above for the quantitation of M in tissue.
Validation of assay methods
The precision and accuracy of the assay methods were evaluated by intraday and interday analysis of triplicates at concentrations of 0.5, 3.1, and 25.0 µg/mL of M in serum, and 0.16, 0.63, and 2.5 µg/mL of M in various tissue homogenates over a period of three days. Lower limit of quantitation (LLOQ) represents the lowest concentration of analyte in a sample that can be deter-mined with acceptable precision and accuracy, whereas limit of detection (LOD) represents the lowest concentration of analyte in a sample that can be detected (with S/N > 3).
Calculation of pharmacokinetic parameters
and statistical analysis
Pharmacokinetic parameters were calculated by a noncompart-ment model of WinNonlin (version 1.1 SCI software; Statistical Consulting, Inc). The peak serum concentration (Cmax) and the
time to peak concentration (Tmax) were calculated based on
ex-perimental measurements. The areas under the curves (AUC0-t)
from time zero to last were calculated by the trapezoidal rule. The oral absolute bioavailability (F) of M was calculated by the following equation:
F¼AUCPO=DosePO
AUCIV=DoseIV
One-way ANOVA with Scheffeʼs test was used for statistical com-parisons.
Supporting information
The method of magnolol isolation and validation of the analytical methods are available as Supporting Information.
Results
!The calibration curve of M in the range of 0.13–50.0 µg/mL in se-rum showed good linearity (r > 0.99). The precision evaluation showed that all coefficients of variation were below 8.6 %, and the accuracy analysis demonstrated that the relative errors to the true concentrations were below 8.0 %. The recoveries of M from serum were 86.7–96.5% at 0.5, 5.0, and 20.0 µg/mL. The LLOQ and LOD of M in serum were 0.13 and 0.06 µg/mL, respec-tively.
For tissue analyses, good linearities (r > 0.99) were obtained in the ranges of 0.16–2.5 µg/mL of M in the brain homogenate and 0.08–2.5 µg/mL in the homogenates of the liver, kidney, lung, and heart. The precision evaluation showed that all coefficients of variation were below 17.2 %, and the accuracy analysis deter-mined that the relative errors to the true concentrations were be-low 12.5 %. The recoveries of M from the brain, liver, lung, heart, and kidney were 106.4–108.5%; 104.3–113.7%; 85.1–106.4%; 95.2–113.7%; and 81.6–98.6%, respectively, at 0.2, 0.6, and 2.5 µg/mL. The LLOQ of M was 0.16 µg/mL in the brain
homoge-nate and 0.08 µg/mL in other tissues. The LOD was 0.04 µg/mL in all tissue homogenates.
The mean serum concentration-time profiles of M, MG, and M S/ G after an intravenous bolus of M are shown inl"Fig. 2. The
re-sults showed that M S/G emerged instantaneously and the serum profiles of M, MG, and M S/G were largely superposable. The pharmacokinetic parameters of M, MG, and M S/G are listed in l"Table 1. The AUC0–480of M, MG, and M S/G were comparable.
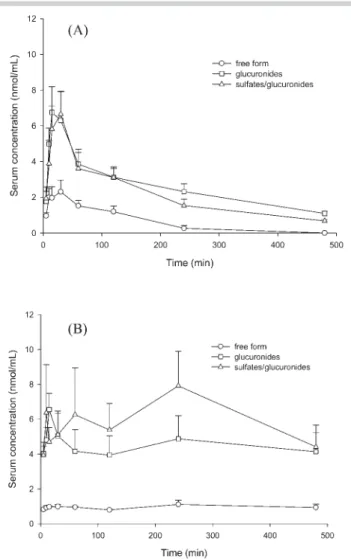
l"Fig. 3 A and B depict the mean serum concentration-time
pro-files of M, MG, and M S/G after oral administrations of a single dose and the 7th dose of M, respectively. M and M S/G emerged
Fig. 2 Mean (± SE) serum concentration-time profiles of magnolol, mag-nolol glucuronides, and magmag-nolol sulfates/glucuronides after an intrave-nous bolus of magnolol (20 mg/kg) to five rats.
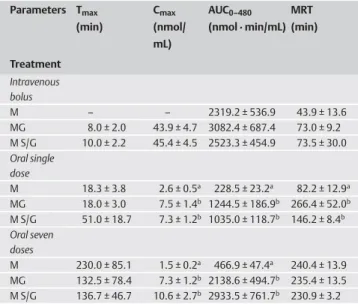
Table 1 Pharmacokinetic parameters of magnolol (M), magnolol glucuro-nides (MG), and magnolol sulfates/glucuroglucuro-nides (M S/G) after intravenous bo-lus (20 mg/kg, n = 5), oral administration of a single dose (n = 5), and seven doses (n = 6) of 50 mg/kg of magnolol to rats.
Parameters Tmax (min) Cmax (nmol/ mL) AUC0–480 (nmol · min/mL) MRT (min) Treatment Intravenous bolus M – – 2319.2 ± 536.9 43.9 ± 13.6 MG 8.0 ± 2.0 43.9 ± 4.7 3082.4 ± 687.4 73.0 ± 9.2 M S/G 10.0 ± 2.2 45.4 ± 4.5 2523.3 ± 454.9 73.5 ± 30.0 Oral single dose M 18.3 ± 3.8 2.6 ± 0.5a 228.5 ± 23.2a 82.2 ± 12.9a MG 18.0 ± 3.0 7.5 ± 1.4b 1244.5 ± 186.9b 266.4 ± 52.0b M S/G 51.0 ± 18.7 7.3 ± 1.2b 1035.0 ± 118.7b 146.2 ± 8.4b Oral seven doses M 230.0 ± 85.1 1.5 ± 0.2a 466.9 ± 47.4a 240.4 ± 13.9 MG 132.5 ± 78.4 7.3 ± 1.2b 2138.6 ± 494.7b 235.4 ± 13.5 M S/G 136.7 ± 46.7 10.6 ± 2.7b 2933.5 ± 761.7b 230.9 ± 3.2
Values are means ± SE. Cmax: maximum serum concentration; AUC0–480: area under serum concentration-time curve to the last time (480 min); MRT0–t: mean residence time. Means in a column without a common superscript differ, p < 0.05
in the blood rapidly after oral dosing, and the serum profile of M was much lower than that of M S/G. The pharmacokinetic param-eters are listed inl"Table 1. After single-dose administration, the
Cmaxand AUC0–480of M S/G were significantly higher than those
of M by 180 % and 350 %, respectively. After the 7th dose, the Cmax
and AUC0–480of M S/G were significantly higher than those of M by 606 % and 584 %, respectively. Comparison of the Cmaxof M
be-tween two treatments showed that single-dose administration resulted in a higher Cmaxof M than the 7th dose by 73 %. On the
contrary, the AUC0–480of M and M S/G after the 7th dose was sig-nificantly higher than those after a single dose by 104 % and 183 %, respectively.
The distribution of M, MG, and M S/G in various tissues after the 7th dose of M are shown inl"Fig. 4. Contrary to the finding in
se-rum, the major molecule in each organ was M rather than M S/G. The concentration of M in the liver was the highest and those in the kidney, brain, lung, and heart were much lower and compa-rable. All organs assayed contained higher concentrations of M than serum. The liver also contained the highest concentration of M S/G than other organs and even higher than serum, whereas only traces of M S/G were present in the lung, heart, brain, and
kidney. The concentrations of M S/G were comparable with those of MG in these organs.
Discussion
!In this study, we established and validated the quantitation method of M in serum and various tissue homogenates. The ana-lytical precision and accuracy as well as recoveries were satisfac-tory. Owing to the unavailability of authentic standards of MG and magnolol sulfates (MS),β-glucuronidase and sulfatase were used to hydrolyze them, and then the released M was deter-mined. The commercial sulfatase (type H-1) used in this study contained not only sulfatase but also a considerable amount of β-glucuronidase. Therefore, both sulfates and glucuronides were hydrolyzed when treated with sulfatase. Through comparing the released amounts of M between treatments with sulfatase/glu-curonidase andβ-glucuronidase, the concentration of MS could be estimated.
A previous study reported the intravenous pharmacokinetics of M in rats, but only M had been quantitated [17]. In this study, we determined not only M but also M S/G. After an intravenous bolus, the serum profiles revealed that M was instantaneously me-tabolized by the liver into M S/G [18, 19]. Comparable AUC0–480 be-tween MG and M S/G, shown inl"Table 1, indicated that the
ma-jor conjugates in the circulation were MG whereas MS were neg-ligible. The AUC0–480of M and MG was comparable, implying that they were equally exposed to the vascular system.
When rats were orally administered with a single dose of M (50 mg/kg), both M and M S/G were found in the serum.l"Fig. 3 A
revealed that M was rapidly absorbed and metabolized exten-sively by conjugation reactions like other polyphenols [18–21]. The presence of a free form in serum is not quite usual among polyphenols, which were known to be exclusively metabolized during the first pass [22, 23]. The comparable AUC0-tbetween
MG and M S/G indicated that MG were the major conjugates. The significantly higher Cmaxand AUC0-tof MG than M revealed
that the major molecules in serum were MG. This finding was consistent with a previous study reporting that bile contained 48–49% of MG, 7% of M, and 2% of MS after oral administration
Fig. 4 Mean (± SE) concentration of magnolol, magnolol glucuronides, and magnolol sulfates/glucuronides in serum and various organs collected at 30 min after oral administration of the 7th dose of magnolol (50 mg/kg) to three rats.
Fig. 3 Mean (± SE) serum concentration-time profiles of magnolol, mag-nolol glucuronides, and magmag-nolol sulfates/glucuronides after oral adminis-tration of a single dose of magnolol (50 mg/kg, n = 5) (A) and the 7th dose (50 mg/kg, n = 6) of magnolol (B) to rats.
of M to rats [16]. The absolute bioavailability of M was calculated as being only 4 % which is similar to a previous study [24]. The low bioavailability might be partly explained by the high metab-olism during the passage through the gut and liver [16]. If the AUC0–480of M S/G was added into the calculation, the oral
bio-availability of M became 17.8 %. The poor biobio-availability of M might be accounted for by its low solubility in gastrointestinal juice.
In order to understand the steady-state pharmacokinetics of M, rats were orally given 50 mg/kg of M three times a day for 7 doses.l"Fig. 3 B depicting the serum profiles after the 7th dose
revealed an apparently different pattern from that inl"Fig. 3 A.
The concentrations of M appeared at a lower and stable level whereas those of M S/G were much higher and with three peaks at 15, 60, and 240 min, which was in agreement with a previous study suggesting enterohepatic circulation of M conjugates [16]. The AUC0-tof M S/G was higher than that of MG by 58 % although
statistical significance was not reached (p = 0.08). In contrast to single-dose pharmacokinetics, we speculate that after repeated dosing, the glucuronidation of M might have been saturated and sulfation took a turn as an alternative metabolic pathway. In ad-dition, serum specimens had been collected right before the 4th and 7th dose and quantitated. The concentrations of M S/G were 1.5 ± 0.3 and 3.4 ± 0.4 nmol/mL, respectively, whereas M was not detected. This evidence indicated that there was accumulation of M S/G but not M.
For tissue distribution analysis, in order to prevent the interfer-ence of residual blood, rats were systemically perfused with cool normal saline before organ collection. The results show that M was the major form in various organs, which was opposite to the finding in serum in which M S/G were predominant. We specu-late that M S/G in the blood were hydrolyzed byβ-glucuronidase or sulfatase in the surface cells of various organs and then perme-ated into the organs [25–27]. Among the assayed organs, compa-rable concentrations of M S/G and MG indicated that MG were the major conjugated metabolites. The liver contained the highest concentration of M and M S/G, which was in good agreement with the finding of a previous study using [ring-14C] labeled M
[16]. Nevertheless, the previous study was not able to distinguish M from M S/G. In contrast, our study found that both M and MG were present in the liver, and M was the major form.
Despite the anti-hepatoma activity of M demonstrated by in vitro studies [6, 8], the reported effective concentration (100 nmol/mL) may not be achievable in vivo based on the estimation from our pharmacokinetic findings. Besides, the liver also contained the highest concentration of MG among the studied organs. In the past, the conjugated metabolites were thought to be inactive and eliminated as the final products of drugs from the body. However, the conjugated metabolites of polyphenols increasingly attracted the interest of researchers. For instance, the paregoric effect of morphine 6-glucuronide was found to be more potent than the one of morphine, and a clinical trial of morphine 6-glu-curonide is ongoing [28, 29]. In addition, the glu6-glu-curonides of mo-rin and quercetin showed potential bioactivities [30–33]. Till now, most in vitro bioactivity studies investigated M only, rather than M S/G [6, 7, 9, 11]. Given that abundant M S/G were present in the bloodstream and liver, the bioactivities of M S/G in the vas-cular system and liver warrant future studies.
In summary, M S/G were the major forms in circulation, whereas M was predominant in the liver, kidney, brain, lung, and heart after oral administration of M. Among the tissues, the liver con-tained the highest concentrations of M and MG.
Acknowledgements
!This work was supported in part by the National Science Council (Grant Number NSC96-2320-B039-006-MY3, NSC 96-2320-B-039-037-MY3), Taiwan Department of Health Cancer Research Center of Excellence (Grant Number DOH99-TD-C-111-004), and China Medical University (Grant Number S-32, CMU98-S-34).
Conflict of Interest
!The authors report no conflict of interest. References
1 Chen QS. Houpo. In: Chang HM, But PPH, editors. Pharmacology and ap-plications of Chinese materia medica. Singapore: World Scientific; 1986: 878–880
2 Wang JP, Hsu MF, Raung SL, Chang LC, Tsao LT, Lin PL, Chen CC. Inhibition by magnolol of formylmethionyl-leucyl-phenyl alanine-induced respi-ratory burst in rat neutrophils. J Pharm Pharmacol 1999; 51: 285–294 3 Lin YR, Chen HH, Ko CH, Chan MH. Effects of honokiol and magnolol on acute and inflammatory pain models in mice. Life Sci 2007; 81: 1071– 1078
4 Lee J, Jung E, Park J, Jung K, Lee S, Hong S, Park J, Park E, Kim J, Park S, Park D. Anti-inflammatory effects of magnolol and honokiol are medi-ated through inhibition of the downstream pathway of MEKK‑1 in NF-kappaB activation signaling. Planta Med 2005; 71: 338–343
5 Park J, Lee J, Jung E, Park Y, Kim K, Park B, Jung K, Park E, Kim J, Park D. In vitro antibacterial and anti-inflammatory effects of honokiol and mag-nolol against Propionibacterium sp. Eur J Pharmacol 2004; 496: 189– 195
6 Lin SY, Chang YT, Liu JD, Yu CH, Ho YS, Lee YH, Lee WS. Molecular mech-anisms of apoptosis induced by magnolol in colon and liver cancer cells. Mol Carcinogen 2001; 32: 73–83
7 Nagase H, Ikeda K, Sakai Y. Inhibitory effect of magnolol and honokiol from Magnolia obovata on human fibrosarcoma HT-1080. Invasiveness in vitro. Planta Med 2001; 67: 705–708
8 Lin SY, Liu JD, Chang HC, Yeh SD, Lin CH, Lee WS. Magnolol suppresses proliferation of cultured human colon and liver cancer cells by inhibit-ing DNA synthesis and activatinhibit-ing apoptosis. J Cell Biochem 2002; 84: 532–544
9 Ikeda K, Nagase H. Magnolol has the ability to induce apoptosis in tu-mor cells. Biol Pharm Bull 2002; 25: 1546–1549
10 Chang B, Lee Y, Ku Y, Bae K, Chung C. Antimicrobial activity of magnolol and honokiol against periodontopathic microorganisms. Planta Med 1998; 64: 367–369
11 Ho KY, Tsai CC, Chen CP, Huang JS, Lin CC. Antimicrobial activity of hon-okiol and magnolol isolated from Magnolia officinalis. Phytother Res 2001; 15: 139–141
12 Chan SS, Zhao M, Lao L, Fong HH, Che CT. Magnolol and honokiol ac-count for the anti-spasmodic effect of Magnolia officinalis in isolated guinea pig ileum. Planta Med 2008; 74: 381–384
13 Nakazawa T, Yasuda T, Ohsawa K. Metabolites of orally administered Magnolia officinalis extract in rats and man and its antidepressant-like effects in mice. J Pharm Pharmacol 2003; 55: 1583–1591
14 Watanabe K, Watanabe H, Goto Y, Yamaguchi M, Yamamoto N, Hagino K. Pharmacological properties of magnolol and honokiol extracted from Magnolia officinalis: central depressant effects. Planta Med 1983; 49: 103–108
15 DʼArchivio M, Filesi C, Di Benedetto R, Gargiulo R, Giovannini C, Masella R. Polyphenols, dietary sources and bioavailability. Ann Ist Super Sanita 2007; 43: 348–361
16 Hattori M, Endo Y, Takebe S, Gargiulo R, Giovannini C, Masella R. Metab-olism of magnolol from Magnoliae cortex. II. Absorption, metabMetab-olism and excretion of [ring-14C]magnolol in rats. Chem Pharm Bull (Tokyo)
1986; 34: 158–167
17 Tsai TH, Chou CJ, Chen CF. Pharmacokinetics and brain distribution of magnolol in the rat after intravenous bolus injection. J Pharm Pharma-col 1996; 48: 57–59
18 Shipkova M, Wieland E. Glucuronidation in therapeutic drug monitor-ing. Clin Chim Acta 2005; 358: 2–23
19 Ritter JK. Roles of glucuronidation and UDP-glucuronosyltransferases in xenobiotic bioactivation reactions. Chem Biol Interact 2000; 129: 171–193
20 Kauffman FC. Sulfonation in pharmacology and toxicology. Drug Metab Rev 2004; 36: 823–843
21 Kaminsky LS, Zhang QY. The small intestine as a xenobiotic-metaboliz-ing organ. Drug Metab Dispos 2003; 31: 1520–1525
22 Rice-Evans C, Spencer JP, Schroeter H, Rechner AR. Bioavailability of fla-vonoids and potential bioactive forms in vivo. Drug Metabol Drug In-teract 2000; 17: 291–310
23 Liu Z, Hu M. Natural polyphenol disposition via coupled metabolic pathways. Expert Opin Drug Metab Toxicol 2007; 3: 389–406 24 Tsai TH, Chou CJ, Lee TF, Wang LCH, Chen CH. Pharmacokinetic and
phar-macodynamic studies of magnolol after oral administration in rats. Pharm Sci 1996; 2: 191–193
25 Sperker B, Murdter TE, Schick M, Eckhardt K, Bosslet K, Kroemer HK. In-terindividual variability in expression and activity of human β-glucu-ronidase in liver and kidney: consequences for drug metabolism. J Pharmacol Exp Ther 1997; 281: 914–920
26 Hanson SR, Best MD, Wong CH. Sulfatases: structure, mechanism, bio-logical activity, inhibition, and synthetic utility. Angew Chem Int Ed Engl 2004; 43: 5736–5763
27 Coughtrie MW, Sharp S, Maxwell K, Innes NP. Biology and function of the reversible sulfation pathway catalysed by human sulfotransferases and sulfatases. Chem Biol Interact 1998; 109: 3–27
28 Wittwer E, Kern SE. Role of morphineʼs metabolites in analgesia: con-cepts and controversies. AAPS J 2006; 8: E348–E352
29 Joshi GP. Morphine-6-glucuronide, an active morphine metabolite for the potential treatment of post-operative pain. Curr Opin Investig Drugs 2008; 9: 786–799
30 Yang JH, Hsia TC, Kuo HM, Chao PD, Chou CC, Wei YH, Chung JG. Inhibi-tion of lung cancer cell growth by quercetin glucuronides via G2/M ar-rest and induction of apoptosis. Drug Metab Dispos 2006; 34: 296–304 31 Moon JH, Tsushida T, Nakahara K, Terao J. Identification of quercetin 3-O-β-D-glucuronide as an antioxidative metabolite in rat plasma after oral administration of quercetin. Free Radic Biol Med 2001; 30: 1274– 1285
32 Fang SH, Hou YC, Chang WC, Hsiu SL, Chao PD, Chiang BL. Morin sulfates/ glucuronides exert anti-inflammatory activity on activated macro-phages and decreased the incidence of septic shock. Life Sci 2003; 74: 743–756
33 Hsieh CL, Chao PD, Fang SH. Morin sulphates/glucuronides enhance macrophage function in microgravity culture system. Eur J Clin Invest 2005; 35: 591–596