行政院國家科學委員會補助專題研究計畫成果報告
※※※※※※※※※※※※※※※※※※※※※※※※※※
※
※
成人急性骨髓性白血病長期存活患者之
「調整品質後存活時間」分析
※
※
※※※※※※※※※※※※※※※※※※※※※※※※※※
計畫類別:□個別型計畫
■整合型計畫
計畫編號:NSC90-2320-B-002-129-M56
執行期間: 88 年 7 月 1 日至 91 年 6 月 30 日
計畫主持人:
唐季祿 助理教授 國立台灣大學醫學院醫學系及附設醫院內科部
共同主持人:
田蕙芬教授 國立台灣大學醫學院醫學系及附設醫院內科部
王榮德教授 國立台灣大學公共衛生學院職業醫學與工業衛生研
究所
許駿醫師 國立台灣大學醫學院附設醫院腫瘤醫學部
計畫參與人員:
陳耀昌教授 國立台灣大學醫學院醫學系及附設醫院檢驗醫學部
姚明醫師 國立台灣大學醫學院醫學系及附設醫院內科部
張雪梅 護理長 國立台灣大學醫學院附設醫院護理部
黃景祥 研究員 中央研究院統計所
執行單位:國立台灣大學醫學院內科
中
華
民
國
91
年
10
月
14
日
Intr oduction
Quality of life (QOL) has been increasingly recognized as an important endpoint in the evaluation of efficacy of cancer therapy. It is especially informative when alternative treatment options are available and when a trade-off between survival benefit and treatment-related toxicity needs to be considered. Incorporation of QOL assessment into clinical decision making will thus take into accounts both the quality and quantity of survival.
We have developed a novel approach to quantifying the impact of QOL by direct integration of the patient cohort’s survival function with the QOL function, the latter can be estimated by a cross-sectional survey of the surviving patients in the cohort.1 Since most QOL questionnaires have a multi-dimensional construct, the integration of the psychometric scores from different dimensions with the survival function will generate a survival-weighted ‘health profile’ of the patient cohort. Furthermore, the calculation of the survival-weighted psychometric scores (SWPS) can be extrapolated beyond the follow-up limit of the patient cohort to produce life-long estimation of QOL changes.2
The Sur vival-weighted Health Pr ofile for Long-ter m Sur vivor s of Acute Myelogenous Leukemia (AML)
High-dose chemotherapy plus allogeneic bone marrow transplantation (BMT) has an established role in the treatment of AML. For AML patients who have achieved complete remission after induction chemotherapy, BMT is often recommended as consolidation treatment for young patients who have a human leukocyte antigen-compatible sibling donor because BMT will produce a lower rate of disease relapse and longer disease-free survival.3,4 However, many studies indicated that BMT patients may suffer from prolonged physical as well as psychosocial problems. Therefore, the choice between different treatment strategies will depend on both the potential survival benefit and the patients’ long-term subjective QOL assessment.
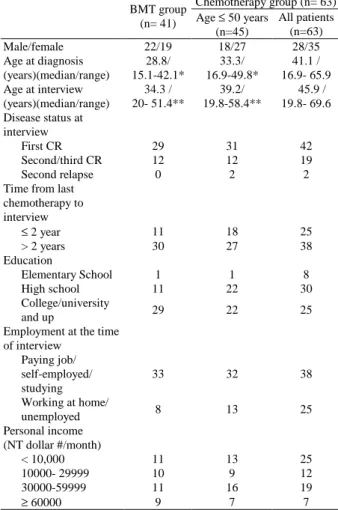
In the first part of this study we sought to construct a ‘health profile’ for long-term survivors of AML by using the survival-weighted psychometric scores (SWPS). The study cohort included all patients who had been diagnosed and treated in National Taiwan University Hospital from 1985 to 1999 and achieved complete remission after standard chemotherapy (n=259). At the time of this study, 134 patients had died during follow-up. One hundred and four of the 125 surviving patients agreed to be interviewed to estimate the QOL function of the cohort. Forty-one patients underwent BMT as consolidation or salvage therapy; 63 received chemotherapy alone. Two QOL questionnaires were used: the European Organization for the Research and Treatment of Cancer (EORTC)-QLQ-C30 questionnaire and the brief form of World Health Organization quality of life questionnaire (WHOQOL-BREF). The clinical characteristics of the interviewed patients were summarized in Table 1.
Table 1. Clinical characteristics of the AML patients
Chemotherapy group (n= 63) BMT group (n= 41) Age ≤ 50 years (n=45) All patients (n=63) Male/female 22/19 18/27 28/35 Age at diagnosis (years)(median/range) 28.8/ 15.1-42.1* 33.3/ 16.9-49.8* 41.1 / 16.9- 65.9 Age at interview (years)(median/range) 34.3 / 20- 51.4** 39.2/ 19.8-58.4** 45.9 / 19.8- 69.6 Disease status at interview First CR 29 31 42 Second/third CR 12 12 19 Second relapse 0 2 2
Time from last chemotherapy to interview ≤ 2 year 11 18 25 > 2 years 30 27 38 Education Elementary School 1 1 8 High school 11 22 30 College/university and up 29 22 25
Employment at the time of interview Paying job/ self-employed/ studying 33 32 38 Working at home/ unemployed 8 13 25 Personal income (NT dollar #/month) < 10,000 11 13 25 10000- 29999 10 9 12 30000-59999 11 16 19 ≥ 60000 9 7 7
and WHOQOL-BREF did not differ significantly between patients who received BMT or those who received chemotherapy only (p>0.01). SWPS for every functioning domain and symptom item was obtained by direct integration of the mean QOL function with the survival function of the cohort:
E(SWPS)=
∫
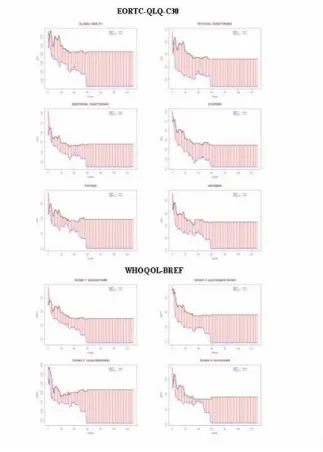
∞ 0 ) ( )] ( [q t S t dt EA Monte Carlo method was used to extrapolate the life-long SWPS beyond the follow-up limit. In the following figures the estimation and extrapolation of SWPS were shown, using QOL results from the global health domain of EORTC-QLQ-C30 in the calculation.
(A ) and (B) represent the survival function curve (solid lines) and the quality-of-life function curve (dashed lines) for patients who received BMT or chemotherapy alone. The hatched area under the curves represents the cumulated SWPS. (C ) and (D) represent the logit of W curve over time for the two groups of patients. W represents the ratio of SWPS between the study cohort and the reference population (W= SWPSstudy(t) / SWPSref(t)) . (E )
and (F)represent extrapolation of SWPS
curves in the two graphs represent SWPS curves of the reference population, which equal to the overall survival curve because the QOL value was set to be 1 (normal health). The lower curves represent the SWPS curves of the study cohort.
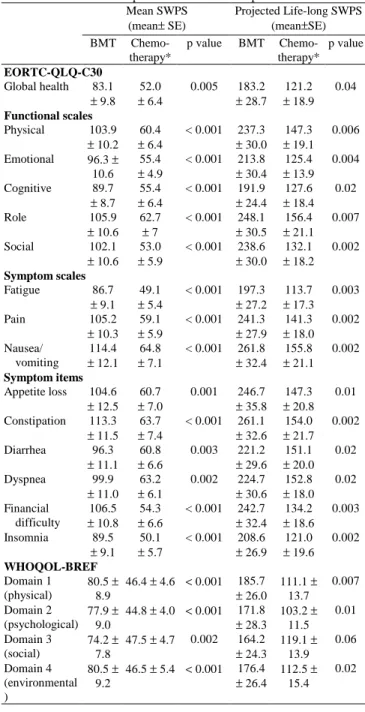
The mean SWPS and the life-long extrapolation of SWPS were summarized in Table 2.
Table 2. Mean and extrapolated SWPS for AML patients Mean SWPS (mean± SE) Projected Life-long SWPS (mean±SE) BMT Chemo-therapy* p value BMT Chemo-therapy* p value EORTC-QLQ-C30 Global health 83.1 ± 9.8 52.0 ± 6.4 0.005 183.2 ± 28.7 121.2 ± 18.9 0.04 Functional scales Physical 103.9 ± 10.2 60.4 ± 6.4 < 0.001 237.3 ± 30.0 147.3 ± 19.1 0.006 Emotional 96.3 ± 10.6 55.4 ± 4.9 < 0.001 213.8 ± 30.4 125.4 ± 13.9 0.004 Cognitive 89.7 ± 8.7 55.4 ± 6.4 < 0.001 191.9 ± 24.4 127.6 ± 18.4 0.02 Role 105.9 ± 10.6 62.7 ± 7 < 0.001 248.1 ± 30.5 156.4 ± 21.1 0.007 Social 102.1 ± 10.6 53.0 ± 5.9 < 0.001 238.6 ± 30.0 132.1 ± 18.2 0.002 Symptom scales Fatigue 86.7 ± 9.1 49.1 ± 5.4 < 0.001 197.3 ± 27.2 113.7 ± 17.3 0.003 Pain 105.2 ± 10.3 59.1 ± 5.9 < 0.001 241.3 ± 27.9 141.3 ± 18.0 0.002 Nausea/ vomiting 114.4 ± 12.1 64.8 ± 7.1 < 0.001 261.8 ± 32.4 155.8 ± 21.1 0.002 Symptom items Appetite loss 104.6 ± 12.5 60.7 ± 7.0 0.001 246.7 ± 35.8 147.3 ± 20.8 0.01 Constipation 113.3 ± 11.5 63.7 ± 7.4 < 0.001 261.1 ± 32.6 154.0 ± 21.7 0.002 Diarrhea 96.3 ± 11.1 60.8 ± 6.6 0.003 221.2 ± 29.6 151.1 ± 20.0 0.02 Dyspnea 99.9 ± 11.0 63.2 ± 6.1 0.002 224.7 ± 30.6 152.8 ± 18.0 0.02 Financial difficulty 106.5 ± 10.8 54.3 ± 6.6 < 0.001 242.7 ± 32.4 134.2 ± 18.6 0.003 Insomnia 89.5 ± 9.1 50.1 ± 5.7 < 0.001 208.6 ± 26.9 121.0 ± 19.6 0.002 WHOQOL-BREF Domain 1 (physical) 80.5 ± 8.9 46.4 ± 4.6 < 0.001 185.7 ± 26.0 111.1 ± 13.7 0.007 Domain 2 (psychological) 77.9 ± 9.0 44.8 ± 4.0 < 0.001 171.8 ± 28.3 103.2 ± 11.5 0.01 Domain 3 (social) 74.2 ± 7.8 47.5 ± 4.7 0.002 164.2 ± 24.3 119.1 ± 13.9 0.06 Domain 4 (environmental ) 80.5 ± 9.2 46.5 ± 5.4 < 0.001 176.4 ± 26.4 112.5 ± 15.4 0.02
Patients who received BMT had significantly (p<0.01) better SWPS in all of the functioning domains and symptom items
of EORTC-QLQ-C30 and all four domains of WHOQOL-BREF. However, when the life-long extrapolation of SWPS was made, these differences diminished in global health and several symptom items of EORTC-QLQ-C30 as well as in the social and environmental domains of WHOQOL-BREF. Patients’ perspective on QOL may be domain-specific and may evolve over time.
The above results indicate that SWPS may be useful to evaluate the efficacy of different treatment strategies for AML. Confirmation of the relative merit of bone marrow transplantation vs. chemotherapy alone from prospective studies is needed.
(Accepted for publication in Quality of Life Research)
The Sur vival-weighted Health Profile for Patients with Hematological Malignancies: Compar ison Between Patients who
Under went BMT vs. Per ipher al Blood Stem Cell Tr ansplantation (PBSCT)
The relative merits of BMT vs. PBSCT in patients with hematological malignancies remain undetermined.5 The advantages of PBSCT include faster engraftment after transplantation, lower hospital stay and medical cost, and convenience for the donors.6,7 On the other hand, the larger number of donor lymphocytes in peripheral blood stem cells seems to be a two-edge sword. It may induce greater graft-versus-leukemia effect and result in lower relapse rate and longer survival.8,9 It may also increase the risk
of graft-versus-host disease (GVHD) and thus increase the long-term morbidity of the patients.10,11 A meta-analysis of 16 studies comparing BMT and PBSCT indicates that PBSCT is associated with higher incidence of both acute and chronic GVHD. The relapse rate may be lower for PBSCT but the long-term overall survival appears similar.12
Therefore, to determine the relative merits of BMT vs. PBSCT, the long-term
treatment-related morbidity and the patients’
quality of life (QOL) must be taken into account.
In the second part of this study we use the SWPS approach to compare the long-term QOL between patients with hematological malignancies who underwent BMT or PBSCT. The study cohort consisted of 120 patients with hematological malignancies and underwent hematopoietic stem cell
transplantation in National Taiwan University Hospital (74 BMT, 46 PBSCT). The 85 surviving patients agreed to be interviewed by using EORTC-QLQ-C30 and
WHOQOL-BREF questionnaires to estimate the QOL function. SWPS for every
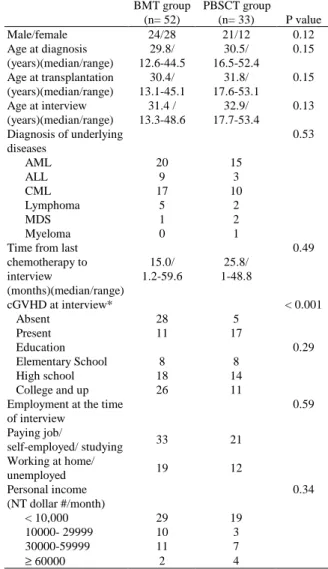
functioning domain and symptom item was calculated by direct integration of the mean QOL function with the survival function of the cohort. Estimation of SWPS was extrapolated by 5 years beyond the follow-up limit by a Monte Carlo method as described above. The clinical characteristics of the interviewed patients were summarized in Table 3.
Table 3. Clinical characteristics of the interviewed patients BMT group (n= 52) PBSCT group (n= 33) P value Male/female 24/28 21/12 0.12 Age at diagnosis (years)(median/range) 29.8/ 12.6-44.5 30.5/ 16.5-52.4 0.15 Age at transplantation (years)(median/range) 30.4/ 13.1-45.1 31.8/ 17.6-53.1 0.15 Age at interview (years)(median/range) 31.4 / 13.3-48.6 32.9/ 17.7-53.4 0.13 Diagnosis of underlying diseases 0.53 AML 20 15 ALL 9 3 CML 17 10 Lymphoma 5 2 MDS 1 2 Myeloma 0 1
Time from last chemotherapy to interview (months)(median/range) 15.0/ 1.2-59.6 25.8/ 1-48.8 0.49 cGVHD at interview* < 0.001 Absent 28 5 Present 11 17 Education 0.29 Elementary School 8 8 High school 18 14 College and up 26 11
Employment at the time of interview 0.59 Paying job/ self-employed/ studying 33 21 Working at home/ unemployed 19 12 Personal income (NT dollar #/month) 0.34 < 10,000 29 19 10000- 29999 10 3 30000-59999 11 7 ≥ 60000 2 4
were included.
The 5-year overall survival rate was similar between patients who received BMT or PBSCT (56.6% vs. 34.7%, p=0.36). The mean and extrapolated SWPS for patients who received BMT or PBSCT were summarized in Table 4. Patients who underwent BMT had significantly better SWPS in global health and most of the functioning domains of
EORTC-QLQ-C30 and the psychological domain of WHOQOL-BREF. The differences persisted when estimation of SWPS was extrapolated by 5 years.
Table 4. SWPS between patients who underwent BMT and PBSCT Mean SWPS (± SE) Projected SWPS (± SE) BMT PBSCT p value BMT PBSCT p value EORTC-QLQ-C30 Global health 30.6 ± 3.2 22.4 ± 3.1 0.02 55.5 ± 7.0 35.4 ± 7.5 0.02 Functional scales Physical 35.4 ± 3.2 25.6 ± 3.6 0.02 63.1 ± 6.6 40.2 ± 8.6 0.01 Emotional 35.3 ± 3.3 26.9 ± 3.7 0.04 64.3 ± 6.8 42.1 ± 8.4 0.02 Cognitive 34.3 ± 3.2 27.6 ± 3.7 0.07 62.0 ± 6.6 41.4 ± 8.5 0.03 Role 33.0 ± 3.2 23.2 ± 3.5 0.02 57.2 ±7.5 37.5 ± 8.4 0.05 Social 33.3 ± 3.4 23.5 ± 3.3 0.02 60.5 ± 7.7 38.2 ± 9.2 0.03 Symptom scales Fatigue 28.6 ± 3.0 22.1 ± 3.5 0.08 52.3 ± 6.4 34.2 ± 7.3 0.04 Pain 36.0 ± 3.4 27.9 ± 4.0 0.06 65.8 ± 7.8 44.9 ± 8.7 0.03 Nausea/ vomiting 39.7 ± 3.6 29.5 ± 4.4 0.04 71.6 ±7.2 46.9 ± 10.6 0.03 Symptom items Appetite loss 34.4 ± 3.4 26.2 ± 4.2 0.07 62.1 ± 7.5 40.9 ± 10.0 0.05 Constipation 41.5 ± 3.6 33.6 ± 4.4 0.10 75.4 ± 7.8 53.6 ± 11.3 0.06 Diarrhea 37.6 ± 3.4 32.2 ± 4.5 0.15 68.5 ± 7.1 49.5 ± 10.5 0.06 Dyspnea 35.8 ± 3.4 24.3 ± 3.8 0.02 62.6 ± 7.5 37.3 ± 8.9 0.01 Financial difficulty 33.3 ± 3.2 25.7 ± 3.4 0.07 60.1 ± 7.2 41.3 ± 8.3 0.04 Insomnia 32.0 ± 3.2 23.0 ± 3.8 0.03 57.7 ± 6.3 36.0 ± 8.4 0.02 WHOQOL-BREF Domain 1 (physical) 26.8±2. 8 20.0±2. 6 0.04 47.4±5. 9 30.2±6. 7 0.03 Domain 2 (psychological) 28.5±2. 5 20.2±3. 0 0.01 51.5±5. 2 31.6±7. 1 0.01 Domain 3 (social) 25.7±2. 8 19.4±2. 7 0.05 47.6±6. 3 30.6±6. 8 0.03 Domain 4 (environmental) 27.9±2. 7 22.7±3. 1 0.11 50.7±5. 6 35.2±7. 7 0.06 Comparison of extrapolated SWPS in selected EORTC-QLQ-C30 and
WHOQOL-BREF items was shown
hatched area denoted the difference of E(SWPS) between patients who underwent BMT or PBSCT.
The above data suggest that for patients with hematological malignancies, those who received PBSCT may have worse QOL than those who received BMT. (Accepted for presentation in the Annual Meeting of the American Society of Hematology 2002 in Philadelphia)
Futur e Resear ch: Pr oblems and Pr ospects
The SWPS approach has several clinically useful features. First, the QOL data can be obtained by interview with the surviving patients in the study cohort. The estimated QOL function thus reflects what the patients did experience when they received the specific treatment. Second, the QOL function obtained by multi-dimensional questionnaires may detect the change of different QOL facets that may be variably affected by the disease course or treatment-related toxicity. Thus, SWPS assessment may provide a more comprehensive view than a single utility value can. 13 , 14 Third, extrapolation of SWPS estimation beyond the follow-up limits may
help predict the long-term outcome of different treatments. The use of a reference population has also been proposed in another cost effectiveness study.15 In our model, we assume a linear relationship of the logit of quality adjusted survival ratio (SWPSstudy(t) / SWPSref(t)) between the study cohort and the
reference population. Our data fit well with the assumption.
It is arguable to use the psychometric scores from Likert-type questionnaires to represent the QOL values, because these scores are not true interval scores, and thus comparisons among different items may be difficult. Studies by other investigators have shown satisfactory ‘scalability’ of most of the functioning domains and symptom items of EORTC-QLQ-C30, although improvement in reliability may be needed for domains that relied on the scores of only one to two items. To improve the accuracy of SWPS comparison, future quality of life research may incorporate instruments using true interval scales.
In the study between patients who underwent BMT or PBSCT, comparison of SWPS between patients with or without chronic GVHD did not show significant difference (data not shown), although chronic GVHD is a major factor in the patients’ QOL impairment. This may be due to the heterogeneity in manifestation and extent of chronic GVHD. Because of the limited number of patients, further stratification by extent of chronic GVHD or other important disease- or treatment-related factors is not allowed. The limited patient number may also affect the precision of SWPS estimation. Our previous simulation study suggested that a sample size of 100 or more in each group might be needed to reduce the bias of long-term SWPS estimation to less than 5 to 7 percent. Another problem is the sensitivity of QOL instruments. 16 Therefore, more patients are needed to improve the sensitivity and validity of the SWPS as an endpoint for evaluation of clinical efficacy.
1
Hwang JS, Tsauo JY, Wang JD: Estimation of expected
quality adjusted survival by cross-sectional survey. Stat Med 1996; 15: 93-102
2
Hwang JS, Wang JD: Monte Carlo estimation of extrapolation of quality-adjusted survival for follow-up studies. Stat Med 1999; 18: 1627-1640
3
Zittoun RA, Mandelli F, Willemze R, et al: Autologous or allogeneic bone marrow transplantation compared with intensive chemotherapy in acute myelogenous leukemia. N Engl J Med 1995; 332: 217-23
4
Cassileth PA, Harrington DP, Appelbaum FR, et al: Chemotherapy compared with autologous or allogeneic bone marrow transplantation in the management of acute myeloid leukemia in first remission. N Engl J Med 339:1649-56, 1998
5 Bensinger WI, Deeg HJ: Blood or marrow? Lancet 2000;
355: 1199-1200 (Editorial)
6
Bensinger WI, Clift R, Martin P, et al: Allogenic peripheral blood stem cell transplantation in patients with advanced hematologic malignancies: a retrospective comparison with marrow transplantation. Blood 1996; 88: 2794-2800
7 To LB, Haylock DN, Simmons PJ, et al: The biology and
clinical use of blood stem cells. Blood 1997; 89: 2233-2258
8
Champlin R, Schmitz N, Horowitz MM, et al: Blood stem cells compared with bone marrow as a source of
hematopoietic cells for allogeneic transplantation. Blood 2000; 95: 3702-3709
9
Powles R, Mehta J, Kulkarni S, et al: Allogeneic blood and bone marrow stem cell transplantation in haematological malignant diseases: a randomized trial. Lancet 2000; 355: 1231-1237
10
Storek J, Gooley T, Siadak M, et al: Allogeneic peripheral blood stem cell transplantation may be associated with a high risk of chronic graft-versus-host disease. Blood 1997; 90: 4705-4709
11
Brown RA, Adkins D, Khoury H, et al: Long-term follow-up of high-risk allogeneic peripheral blood stem cell transplant recipients: graft-versus-host disease and transplant-related mortality. J Clin Oncol 2000; 17: 806-812
12
Cutler C, Giri S, Jeyapalan S, et al: Acute and chronic graft-versus-host disease after allogeneic peripheral-blood stem-cell and bone marrow transplantation: a meta-analysis. J Clin Oncol 2001; 19: 3685-3691
13
McQuellon RP, Russel GB, Rambo TD, et al: Quality of life and psychological distress of bone marrow transplant recipients: the ‘time trajectory’ to recovery over the first year. Bone Marrow Transplant 1998; 21: 477-486
14
Neitzert CS, Ritvo P, Dancey J, et al: The psychosocial impact of bone marrow transplantation: a review of the literature. Bone Marrow Transplant 1998; 22: 409-422
15
Mark DB, Hlatky MA, Califf RM, et al: Cost effectiveness of thrombolytic therapy with tissue plasminogen activator as compared with streptokinase for acute myocardial infarction. N Eng J Med 1995; 332: 1418-1424
16
Testa MA, Simmons DC: Assessment of quality-of-life outcomes. N Engl J Med 1996; 334: 835-840