國 立 交 通 大 學
電子工程學系 電子研究所碩士班
碩 士 論 文
用於 IEEE 802.16d 及 IEEE 802.11a/g 之
CORDIC 多模同步電路設計
CORDIC Based Multimode Synchronization
Circuit Design for IEEE 802.16d and
802.11a/g systems
研 究 生:楊士賢 Shih-Hsien Yang
指導教授:溫瓌岸 博士 Dr. Kuei-Ann Wen
用於 IEEE 802.16d 及 IEEE 802.11a/g 之 CORDIC
多模同步電路設計
CORDIC Based Multimode Synchronization Circuit
Design for IEEE 802.16d and 802.11a/g systems
研 究 生:楊士賢 Student:Shih-Hsien Yang
指導教授:溫瓌岸 博士 Advisor:Dr. Kuei-Ann Wen
國立交通大學
電子工程學系 電子研究所碩士班
碩士論文
A Thesis
Submitted to the Department of Electronics Engineering & Institute of
Electronics College of Electrical and Computer Engineering
National Chiao Tung University
In Partial Fulfillment of the Requirements
For the Degree of Master of Science
In
Electronic Engineering
June, 2008
HsinChu, Taiwan, Republic of China
中華民國 九十七年六月
I
用於 IEEE 802.16d 及 IEEE 802.11a/g
之 CORDIC 多模同步電路設計
研究生: 楊士賢 指導教授: 溫瓌岸博士
國立交通大學 電子工程學系 電子研究所碩士班摘要
本論文提出一個適用於IEEE802.11a/g 及 IEEE802.16d 之多模同步電路。所提出 的同步電路中可以細分為訊框偵測,分數載波頻率漂移估測,整數載波頻率漂移 估測及符元邊界偵測。在訊框偵測中,本論文提出一個修改過的絕對值近似方法. 這個方法可以使近似的誤差降低2~3 倍。在分數載波頻率漂移估測中,本論文提 出一個修改過的座標旋轉數位計算機電路。相對於傳統的方法,這個座標旋轉數 位計算機電路可以使得硬體複雜度降低46%。在整數載波頻率漂移中,本論文使 用一個簡化的匹配濾波器以降低非共用電路所佔的比例。系統模擬是建構在 MathWorks 的 MATLAB 平台上。整個電路架構也已經在 Verilog 語言下實現出來。在UMC 0.18 微米的製程環境下使用新思科技的 Design Compiler 所合成出
II
CORDIC Based Multimode
Synchronization Circuit Design for IEEE
802.16d and 802.11a/g systems
Student: Shih-Hsien Yang Advisor: Dr. Kuei-Ann Wen
Department of Electronics Engineering Institute of ElectronicsNational Chiao-Tung University
Abstract
In this thesis, a multimode synchronization circuit is presented. It consists of frame detection, fractional carrier frequency offset estimation, and integral carrier frequency offset estimation and symbol boundary detection. In frame detection, a modified absolute value approximation circuit (AVAC) is provided. It improves accuracy 2~3 times the accuracy of traditional method. In fractional carrier frequency offset estimation, a modified CORDIC circuit is proposed. The hardware reduction is at least 46% comparing to conventional method. In integral carrier frequency offset estimation, a reduced match filter is used. System simulation has done in Matlab. The architecture has been implemented in Verilog. By synthesizing to UMC 0.18um CMOS standard cell technology library with Synopsys Design Compiler, the overall gate count is about 124k.
III
誌 謝
首先,第一個要感謝的是指導教授,溫瓌岸教授。感謝老師在兩年研究生涯 中,不斷的給予指導與督促。溫老師的循循教誨,讓學生在學習訓練的路途上, 能夠快速而正確的修正自己的研究方向,並且保持不鬆懈的心態進行研究。也感 謝 TWT_LAB 在這兩年中提供的豐富研究資源,讓我在研究上無後顧之憂。 感謝實驗室的學長們的指導與照顧:彭嘉笙,溫文燊,林立協,趙皓名,陳 哲生,鄒文安,蔡彥凱,張懷仁。感謝兩年來一起打拚的同學:黃謙若,黃俊彥, 葉柏麟,林佳欣,王磊中,黃國爵。大家在生活上的互相扶持與鼓勵,讓原本辛 苦煩悶的研究工作,也變的輕鬆愉快許多。同時也要感謝實驗室的助理:淑怡, 智伶,恩齊,慶宏,宛君,苑佳,有妳們幫忙處理實驗室的雜務,才能讓我們能 夠專心致力於研究。 最後,感謝默默支持我的家人和女朋友。你們不斷的支持與鼓勵,讓我覺得 更需要努力來回報你們。IV
Contents
中文摘要……..………..….I Abstract………..II 誌謝…….………..…...III Contents………..….IV List of Tables………..….VI List of Figures………..….VII Chapter1 Introduction ... 1 1.1. Motivation. ... 1 1.2. OFDM Basic. ... 31.3 Overview of IEEE 802.16d System. ... 6
1.4 Overview of IEEE 802.11a/g System. ... 9
1.5 Channel Model ... 11
1.5.1 Simulation Channel ... 11
1.5.2 SUI Channel model ... 13
1.5.3 Exponentially decaying Channel Model ... 15
V
2.1 Synchronization Scheme ... 17
2.2 Synchronization Architecture for IEEE 802.11a/g System ... 19
2.3 Synchronization Architecture for IEEE 802.16d System ... 19
2.4 Proposed Multimode Synchronization Architecture ... 20
Chapter3 Circuit Design for Multimode Synchronization Blocks... 22
3.1 Frame Detection ... 22
3.1.1 Algorithm ... 22
3.1.2 Absolute value approximation circuit ... 25
3.1.3 Multimode Circuit Design for Frame Detection ... 28
3.2 Fractional CFO Estimation and Compensation ... 29
3.2.1 Algorithm ... 29
3.2.2 CORDIC Cell Circuit Design ... 30
3.2.3 Angle Consideration of Estimation ... 32
3.2.4 Angle Consideration of Compensation ... 33
3.2.5 Multimode Circuit Design for Fractional CFO Estimation and Compensation ... 34
3.3 Integral CFO Estimation ... 35
3.3.1 Algorithm ... 35
VI
3.4 Symbol boundary Detection ... 38
3.4.1 Algorithm ... 38
3.4.2 Multimode Circuit Design for Symbol Boundary Detection ... 40
Chapter4 Simulation and FPGA Emulation ... 41
4.1 Simulation Result and Performance Analysis ... 41
4.1.1 Simulation Setup ... 41
4.1.2 Frame Detection Performance ... 42
4.1.3 Fractional CFO Estimation Performance ... 43
4.1.4 Integral CFO Estimation Performance ... 45
4.1.5 BER Performance in IEEE 802.16d ... 45
4.1.6 BER Performance in IEEE 802.11a/g ... 47
4.2 Hardware comparison ... 48
4.3 FPGA Emulation ... 49
Chapter5 Conclusions and Future Work... 51
5.1 Conclusions ... 51
VII
List of Figures
Figure 1.1: IEEE 802.11a/g system diagram ... 2
Figure 1.2: IEEE 802.16d system diagram ... 2
Figure 1.3: Difference between OFDM system and traditional multicarrier system 3 Figure 1.4: Spectra of orthogonal subcarriers ... 4
Figure 1.5: Effect of multipath with zero padding in the guard time ... 5
Figure 1.6: OFDM symbol with cyclic extension ... 6
Figure 1.7: IEEE 802.16d OFDM Frame structure with FDD ... 7
Figure 1.8: IEEE 802.11a/g OFDM Frame structure... 9
Figure 1.9: Simulation channel diagram ... 11
Figure 1.10: Mismatches between ADC/DAC sample frequencies ... 12
Figure 1.11: Cir of the exponential decaying model with rms delay spread 50ns ... 16
Figure 2.1: IEEE 802.11a/g synchronization architecture 1 ... 19
Figure 2.2: IEEE 802.11a/g synchronization architecture 2 ... 19
Figure 2.3: IEEE 802.16d synchronization architecture 1 ... 20
Figure 2.4: IEEE 802.16d synchronization architecture 2 ... 20
Figure 2.5: Proposed multimode synchronization architecture ... 21
Figure 3.1: Normalized autocorrelation diagram ... 23
Figure 3.2: Correlation diagram ... 23
Figure 3.3: Frame detection distribution in IEEE 802.11a/g ... 24
Figure 3.4: Frame detection distribution in IEEE 802.16d ... 25
Figure 3.5: Approximation error plots ... 26
Figure 3.6: Distribution of IEEE 802.11a/g ... 27
Figure 3.7: Distribution of IEEE 802.16d ... 27
Figure 3.8: Multimode frame detection circuit ... 29
Figure 3.9: Rotation in Cartesian coordinate system ... 30
Figure 3.10: Modified CORDIC cell ... 32
VIII
Figure 3.12: Cascaded CORDIC stage ... 35
Figure 3.13: Integral CFO Estimation circuit ... 37
Figure 3.14: Match Filter circuit ... 37
Figure 3.15: Reduced multiplier ... 38
Figure 3.16: Multipath effect on symbol boundary detection ... 38
Figure 3.17: Response of MSBD(n) and MMSBD(n) ... 39
Figure 3.18: Multimode circuit design for symbol boundary detection ... 40
Figure 4.1: Simulation setup ... 41
Figure 4.2: Frame detection performance in 802.11a/g ... 42
Figure 4.3: Frame detection performance in 802.16d... 43
Figure 4.4: Fraction CFO estimation performance in 802.11a/g... 44
Figure 4.5: Fractional CFO Estimation performance in 802.16d ... 44
Figure 4.6: Integral CFO Estimation performance in 802.16d ... 45
Figure 4.7: BER performance of IEEE 802.16d ... 46
Figure 4.8: PER performance of IEEE 802.16a/g ... 47
Figure 4.9: FPGA emulation plan ... 49
Figure 4.10: VeriComm Pro software and the Xilinx FPGA ... 50
Figure 4.11: FPGA synthesis report ... 50
IX
List of Tables
Table 1.1: IEEE 802.16d system parameter list ... 8
Table 1.2: IEEE 802.16d system available bandwidth list ... 8
Table 1.3: IEEE 802.11a/g rate-dependent parameters ... 10
Table 1.4: IEEE 802.11a/g time-related parameters ... 10
Table 1.5: Classification of SUI channel models ... 13
Table 1.6: SUI channel model parameters ... 14
Table 1.7: Normalization factor list ... 15
Table 2.1: frequency offset analysis ... 18
Table 3.1: Approximation performance of IEEE 802.11a/g ... 28
Table 3.2: Approximation performance of IEEE 802.16d ... 28
Table 3.3: Sequence of elementary rotations for estimation ... 32
Table 3.4: Sequence of elementary rotations for compensation ... 33
Table 3.5: Proposed sequence of elementary rotations for compensation... 34
Table 3.6: Gate level selection ... 37
Table 4.1: System simulation constraint of IEEE 802.16d ... 46
Table 4.2: System simulation constraint of IEEE 802.11a/g ... 47
Table 4.3: Hardware comparison of fractional CFO estimation and compensation 48 Table 4.4: Hardware comparison of synchronization circuit ... 48
1
Chapter1
Introduction.
1.1. Motivation.
For the common human nature, there is an aspiration to have ability to communicate with people no matter where they are. In order to assuage the desire, people have developed several wired or wireless communication systems. Especially, wireless communication systems have been reached and developed enthusiastically. The institute of Electrical and Electronics Engineers (IEEE) has defined four different wireless standards. IEEE 802.11a/g standard is the widely used WLAN spec for now. The IEEE 802.11a/g system diagram is shown in Fig. 1.1.The major application of IEEE 802.11a/g is to provide a high data rate link in indoor environments, such as office buildings, library, coffee bar, etc. In many portable applications, IEEE 802.11a/g standard is adopted because of the need of internet access. In recent years, IEEE 802.16d standard has got a lot of interest for the sake of internet access anywhere. The IEEE 802.16d system diagram is shown in Fig. 1.2. IEEE 802.16d standard can make up the deficiency of IEEE 802.11a/g. If there is a portable device with these two standards, the device let people get internet information anywhere.
2
IEEE 802.11a/g and IEEE 802.16d have adopted OFDM as their key modulation scheme for high data rate transmissions. Because Synchronization is the most important functional block in OFDM systems, this thesis choose synchronization for IEEE 802.11a/g and IEEE 802.16d as research target.
Figure 1.1 IEEE 802.11a/g system diagram
3
1.2. OFDM Basic.
Orthogonal frequency division multiplexing (OFDM) has been adopted in several standards such as IEEE 802.11a/g, IEEE 802.16d, HIPERLAN/2, DVB, DAB and so on. The main advantage of OFDM is its spectrum efficiency as depicted in Fig. 1.1
Figure 1.3 Difference between OFDM system and traditional multicarrier system
OFDM systems can transmit a large number of data simultaneously via orthogonal subcarriers. By splitting high data-rate data stream into several low rate streams, OFDM systems have a larger symbol time and are more robust to timing errors. OFDM has many advantages such as better spectrum efficiency, better immunity against multipath effects and relaxed timing constraint. However, the main disadvantage of this technique is the sensitivity to carrier frequency offset (CFO).A small amount of CFO will cause loss of orthogonality and severely degrade system performance. The equivalent complex baseband OFDM symbol start at t=ts can be written as [6] 1 2 2 ( ) 2 2
( )
(
),
( ) 0,
s s s s N k j t t s T N s s k N k s st t
x t
X
e
t
t t
T
T
x t
t t or t t
T
p -+=
-=
P
£ £ +
=
<
> +
å
g
g
(1.1)4
pulse shaping filter is defined as
1,
( )
2
2
0,
T
T
t
t
T
otherwise
-ì
£ £
ï
P
= í
ïî
(1.2) The orthogonality between subcarriers can be derived by integrating any two subcarriers within a symbol period' ' 2 ( ) 2 ( ) '
1,
0,
s s s s k k t T j t t j t t T T t tfor k
k
e
e
for k
k
p p + - -=ì
=
= í
¹
î
ò
(1.3)Because of the orthogonality, every OFDM data symbol can be demodulated by correlating with corresponding subcarrier.
' ' 2 ( ) 1 2 2 ( ) 2 2 2 ( ) , ( ) s s s s s s s s s s k t T j t t T s s t t N k k t T j t t T N t t N s k k N k x t e t t t T X e X N p p + - -= - -+ -= + + = -£ -£ + = =
ò
å
ò
g g g (1.4)Thus, ideally each data symbol has no interfere from other data symbols.
1
s
T
5
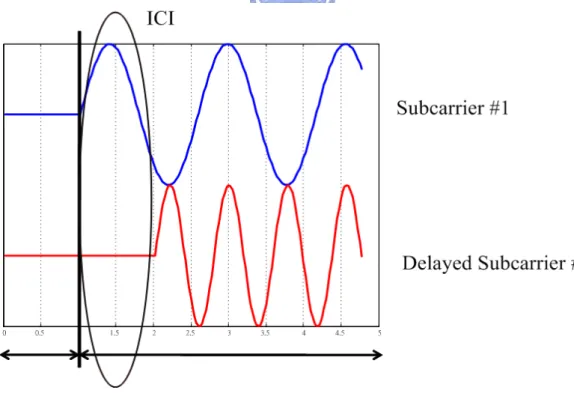
Note that, from eq. (1.1), each subcarrier has an integer number of cycles in the interval T, and the number of cycles between adjacent subcarriers differs by exactly one. If there is no other impairment, each subcarrier is orthogonal and the spectral peak of each subcarrier will coincide with the zero crossing of all the other carriers as depicted in Fig. 1.2.Inter-symbol interference (ISI) will cause by convolution of transmitted signals and channel response. A guard time which is larger than the multipath delay spread is need for OFDM symbols. If guard time is zero padding as showed in Fig. 1.3 [13], there will be Inter-carrier interference (ICI) because of loss of orthogonality. In order to eliminate ICI, Fig. 1.4 shows that OFDM symbol is cyclically extended in the guard time.
6 0 0.5 1 1.5 2 2.5 3 3.5 4 4.5 5 FFT time G uard time Delayed Subcarrier #2 Subcarrier #1
Figure 1.6 OFDM symbol with cyclic extension
1.3 Overview of IEEE 802.16d System.
In IEEE 802.16d standard [1], the frame consists of a downlink subframe and an uplink subframe. According to different duplexing methods, there are two frame structures. Fig. 1.6 shows the FDD frame structure. The downlink PHY PDU starts with a long preamble. The preamble is followed by a FCH burst which specify burst profile and length of the one or several downlink bursts immediately following the FCH. After FCH, data bursts are transmitted.
The frequency domain sequences for preamble is derived from sequence PALL(-100:100)= {1-j, 1-j, -1-j, 1+j, 1-j, 1-j, -1+j, 1-j, 1-j, 1-j, 1+j, -1-j, 1+j, 1+j, -1-j, 1+j, -1-j, -1-j, 1-j, -1+j, 1-j, 1-j, -1-j, 1+j, 1-j, 1-j, -1+j, 1-j, 1-j, 1-j, 1+j, -1-j, 1+j, 1+j, -1-j, 1+j, -1-j, -1-j, 1-j, -1+j, 1-j, 1-j, -1-j, 1+j, 1-j, 1-j, -1+j, 1-j, 1-j, 1-j, 1+j, -1-j, 1+j, 1+j, -1-j, 1+j, -1-j, -1-j, 1-j, -1+j, 1+j, 1+j, 1-j, -1+j, 1+j, 1+j, -1-j, 1+j, 1+j, 1+j, -1+j, 1-j, -1+j, -1+j, 1-j, -1+j, 1-j, 1-j,1+j, -1-j, -1-j, -1-j, -1+j, 1-j, -1-j, -1-j, 1+j, -1-j, -1-j, -1-j, 1-j, -1+j, 1-j, 1-j, -1+j, 1-j, -1+j,-1+j, -1-j, 1+j, 0, -1-j, 1+j, -1+j, -1+j, -1-j, 1+j,
7 1+j, 1+j, -1-j, 1+j, 1-j, 1-j, 1-j, -1+j, -1+j, -1+j, -1+j, 1-j, -1-j, -1-j, -1+j, 1-j, 1+j, 1+j, -1+j, 1-j, 1-j, 1-j, -1+j, 1-j, -1-j, -1-j, -1-j, 1+j,1+j, 1+j, 1+j, -1-j, -1+j, -1+j, 1+j, -1-j, 1-j, 1-j, 1+j, -1-j, -1-j, -1-j, 1+j, -1-j, -1+j, -1+j, -1+j, 1-j, 1-j, 1-j, 1-j, -1+j, 1+j, 1+j, -1-j, 1+j, -1+j, -1+j, -1-j, 1+j, 1+j, 1+j, -1-j, 1+j, 1-j, 1-j, 1-j, -1+j, -1+j, -1+j, -1+j, 1-j, -1-j, -1-j, 1-j, -1+j, -1-j, -1-j, 1-j, -1+j, -1+j, -1+j, 1-j, -1+j,1+j, 1+j, 1+j, -1-j, -1-j, -1-j, -1-j, 1+j, 1-j, 1-j} (1.5)
The first preamble in the downlink PHY PDU consists of two consecutive OFDM symbols. The first OFDM symbol uses only subcarriers the indices of which are a multiple of four and the second OFDM symbol uses only even subcarriers. The resulting time domain structure of preamble is shown in Fig. 1.7
8
Table 1.1 IEEE 802.16d system parameter list
NFFT 256 Nused 200 Bandwidth BW Fs Floor(n *BW/8000)*8000 (2~32 MHz) Subcarrier specing Fs/NFFT (7.8125~125 KHz) Sampling factor 8/7 G 1/4, 1/8, 1/16, 1/32 Tb 1/subcarrier spacing Tg G*Tb Ts Tb+Tg (31.25~500ns)
Number of lower frequency guard subcarriers 28 Number of higher frequency guard subcarriers 27
Table 1.2 IEEE 802.16d available bandwidth list
BW Tb Tg=Tb/32 Tg=Tb/16 Tg=Tb/8 Tg=Tb/4 n=8/7 1.75 128 4 8 16 32 3.5 64 2 4 8 16 7.0 32 1 2 4 8 14.0 16 0.5 1 2 4 28.0 8 0.25 0.5 1 2
9
1.4 Overview of IEEE 802.11a/g System.
Fig. 1.7 shows the PPDU frame format defined in IEEE 802.11a/g [2]. It includes the OFDM PLCP preamble, OFDM PLCP header, PSDU, tail bits, and pad bits. The PLCP preamble contains ten short symbols and two long symbols. A short OFDM training symbol consists of 12 subcarriers which are modulated by the elements of the sequence S, given by 26 ,26( 13 / 6 ){0, 0,1 , 0, 0, 0, 1 , 0, 0, 0,1 , 0, 0, 0, 1 , 0, 0, 0, 1 , 0, 0, 0,1 , 0, 0, 0, 0, 0, 0, 0, 1 , 0, 0, 0, 1 , 0, 0, 0, 1 , 0, 0, 0,1 , 0, 0,1 , 0, 0,1 , 0, 0} S j j j j j j j j j j j j - + - - + - - - - + -- -- - - + + + (1.6)
A long symbol consists of 53 subcarriers which are modulated by the elements of the sequence L, given by 2 6 , 2 6 {1, 1, 1, 1, 1, 1, 1, 1, 1, 1, 1, 1, 1, 1, 1, 1, 1 , 1, 1, 1, 1, 1, 1, 1, 1, 1, 0 , 1, 1, 1, 1, 1, 1, 1, 1, 1, 1 , 1, 1, 1, 1, 1, 1, 1, 1, 1, 1, 1, 1, 1, 1, 1, 1} L- = - - - -- - - -- - - (1.7)
10
From Table 3, eight different kinds of data rates from 6 up to 54 Mbps, Table 4 shows the timing related parameters and the reason why 802.11a/g has a maximum data rate of 54 Mbps is derived in eq. (1.8)
3
6 48
250
54
4
date rate
= ´
´ ´
k
=
Mbps
(1.8)Table 1.3 IEEE 802.11a/g rate-dependent parameters
Data rate (Mbits/s)
Modulation Coding rate
Coded bits per subscribre Coded bits per OFDM symbol Data bits per OFDM symbol 6 BPSK 1/2 1 48 24 9 BPSK 3/4 1 48 36 12 QPSK 1/2 2 96 48 18 QPSK 3/4 2 96 72 24 16 QAM 1/2 4 192 96 36 16 QAM 3/4 4 192 144 48 64 QAM 2/3 6 288 192 54 64 QAM 3/4 6 288 216
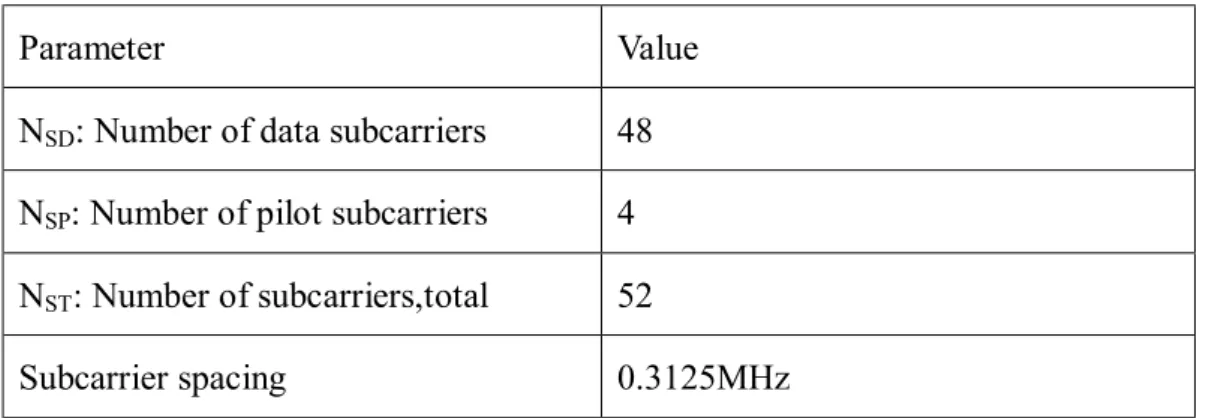
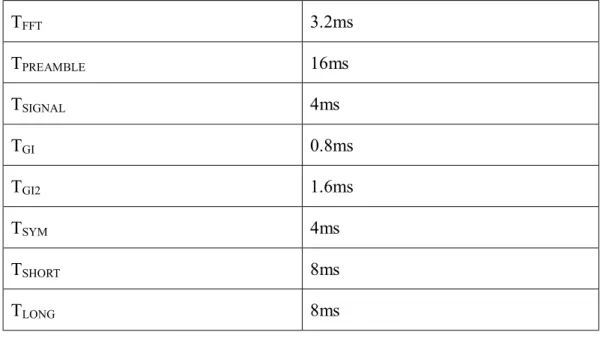
Table 1.4 IEEE 802.11a/g Timing-related parameters
Parameter Value
NSD: Number of data subcarriers 48
NSP: Number of pilot subcarriers 4
NST: Number of subcarriers,total 52
11 TFFT 3.2ms TPREAMBLE 16ms TSIGNAL 4ms TGI 0.8ms TGI2 1.6ms TSYM 4ms TSHORT 8ms TLONG 8ms
1.5 Channel Model
1.5.1 Simulation Channel
The simulation channel used is showed in Fig. 1.9 and three non-ideal effects are shown below.
Figure 1.9 Simulation channel diagram
In real implementation, the frequency difference between transmitter oscillator and receiver oscillator is impossible to be zero. This non-ideal effect will cause ICI and severely degrade system if no compensation process is used. Eq. 1.12 shows the CFO influence on transmitted data samples.
12 (2 ) (2 ) (2 ( ) ) (2 ( ) ) t r t r j f nT j f nT n n j f f nT n j f nT n
r
x e
e
x e
x e
p p p p -D=
=
=
(1.9)where ft and fr are the frequencies of oscillator at transmitter and receiver respectively.SCO is caused by the mismatch between ADC/DAC sampling frequencies, as illustrated in Fig. 1.9.
(1 )Ts
+
d
Ts
Transmitted
Samples
Received
Samples
0 1 2 3 4 5 6 7 8 9 10 0 1 2 3 4 5 6 7 8 9 10Figure 1.10 Mismatches between ADC/DAC sample frequencies.
Assume T is the transmitted sampling period, s d is the sampling clock offset value, and (1+d)Ts is the received sampling period. In frequency domain, SCO enlarging or narrowing the spectrum in horizontal destroys the orthogonality in OFDM, thus induces ICI in OFDM systems. To simulate the non-ideal effect, received signal is interpolated by using a raised cosine filter.
interp 2
cos( (
))
( )
sinc(
)
(
),
/ 2,... / 2
1 (2 (
) / )
n
h
n
w n N
n
N
N
n
a
t
t
t
a
t p
+
=
+ ´
+
=
--
+
(1.10)13
Gaussian random variable with zero mean and variance 2
0/ 2
N
s = , where
0 s/
N =E SNR , and E is defined as the average energy of one OFDM symbol. s
1.5.2 SUI Channel model
In 802.16d system, a series of Stanford University Interim (SUI) channel selected for three terrain types [3]. These models are very suitable for fixed broadband wireless applications. According to the difference in terrain and tree density, the six SUI channels can be assort into three categories as showed in table 5.
Table 1.5 Classification of SUI channel models Model Category
SUI5,SUI66 Hilly terrain with moderate-to-heavy tree densities SUI3,SUI4 Hilly terrain with light tree densities
SUI1,SUI2 Flat terrain with light tree densities
In small scale fading, K-factor is a key parameter in defining the fading distribution. It is defined as the ratio of fixed-component power and the scatter-component power. A K-factor model is presented as follows
s h b o
K
=
F F F K d u
g (1.11)Where Fs is a seasonal factor, Fs=1 in summer (leaves):2.5 in winter (no leaves) Fh is the receive antenna height factor, ( / 3)0.46
h
F = h
Fb is the beamwidth factor, ( /17) 0.62
b
F = b -
Ko andγ are regression coefficients,Ko=10;γ=-0.5
u is a lognormal variable which has zero dB mean and standard deviation of 8 dB
14
If K-factor equal to zero, the multipath fading tap is Rayleigh distributed. On the other hand, multipath fading tap is Ricean distributed with nonzero K-factor. Table 6 shows a parameter list of SUI channels
Table 1.6 SUI channel model parameters
Model RMS delay (us)
Parameter Tap1 Tap2 Tap3 K-factor
SUI-1 0.111 Delay(us) 0 0.4 0.9 [4 0 0] Power(dB) 0 -15 -20 Doppler Frequency (Hz) 0.4 0.3 0.5 SUI-2 0.202 Delay(us) 0 0.4 1.1 2 0 0] Power(dB) 0 -12 -15 Doppler Frequency (Hz) 0.2 0.15 0.25 SUI-3 0.264 Delay(us) 0 0.4 0.9 [1 0 0] Power(dB) 0 -5 -10 Doppler Frequency (Hz) 0.4 0.3 0.5 SUI-4 1.257 Delay(us) 0 1.5 4 [0 0 0] Power(dB) 0 -4 -8 Doppler Frequency (Hz) 0.2 0.15 0.25 SUI-5 2.842 Delay(us) 0 4 10 [0 0 0] Power(dB) 0 -5 -10 Doppler Frequency (Hz) 2 1.5 2.5 SUI-6 5.240 Delay(us) 0 14 20 [0 0 0] Power(dB) 0 -10 -14 Doppler Frequency (Hz) 0.4 0.3 0.5
15
The multipath fading taps generated from table 6 have a white spectrum since they are independent of each other. Considering the Doppler Effect, these taps should pass Doppler filter with power spectral density defined as follows:
2 4 0 0 0 0 0 1 1.72 0.785 , 1 ( ) 0 , 1 m f f f f S f where f f f ì - + £ ï =í = > ïî (1.12) After passing through the Doppler filter, a normalized factor needs to apply to these multipath fading taps. In order not to change the total power of transmitted signal, the total power of the Doppler filter has to be normalized to one. Table 7 shows the normalization factor of each SU channel model. Finally with the knowledge of Tap delay and system bandwidth, the channel impulse response can be generated.
Table 1.7 Normalization factor list
SUI Channel Models Normalization Factor (dB)
SUI-1 -0.1771 SUI-2 -0.3930 SUI-3 -1.5113 SUI-4 -1.9218 SUI-5 -1.5113 SUI-6 -0.5683
1.5.3 Exponentially decaying Channel Model
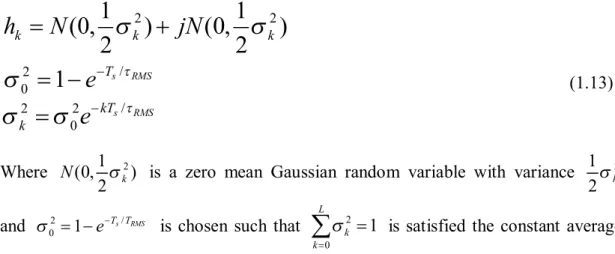
The channel model used is recommended by IEEE 802.11a/g standard specification. Eq. 1.11 shows the channel impulse response.
16 2 2 / 2 0 / 2 2 0
1
1
(0,
)
(0,
)
2
2
1
s RMS s RMS k k k T kT kh
N
jN
e
e
t ts
s
s
s
s
-=
+
=
-=
(1.13) Where (0,1 2) 2 kN s is a zero mean Gaussian random variable with variance 1 2
2s k
and 2 /
0 1 s RMS
T T
e
s = - - is chosen such that 2 0 1 L k k s = =
å
is satisfied the constant average received power. Fig. 1.8 shows the amplitude response of the recommended model.17
Chapter2
Multimode Synchronization
Architecture Design
2.1 Synchronization Scheme
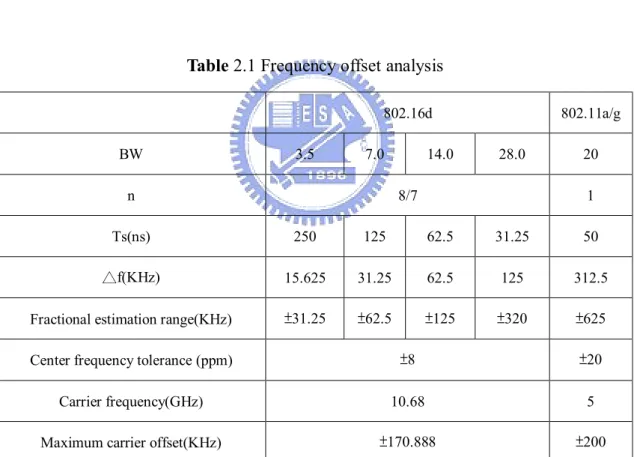
Basically, a synchronization block consists of three tasks: Frame detection: finding a data frame. CFO estimation and compensation: correcting CFO effect. Symbol boundary detection: selecting a correct FFT window. According to the different bandwidth and different frequency offset tolerance, the CFO estimation function block is different from each other. The estimation range of conventional method [] is two times subcarrier spacing. Table 2.1 shows the frequency difference between IEEE 802.16d and IEEE 802.11a/g. In IEEE 802.11a/g, the maximum carrier offset is derived in eq. (2.1) and the CFO estimation range is derived in eq. (2.2).
18
1
2
625(
)
50( ) 64
ns
KHz
´
=
´
(2.2)From eq. (2.1) and (2.2), the CFO estimation range is larger than the maximum carrier offset and so the conventional method is suitable for IEEE 802.11a/g. However, In IEEE 802.16d, the maximum carrier offset is derived in eq. (2.3) and the minimum CFO estimation range is derived in eq. (2.4).
10.68(
MHz
) (8 8) (
´
+
ppm
) 170.88(
=
KHz
)
(2.3)1
2
31.25(
)
250( ) 256
ns
KHz
´
=
´
(2.4)Table 2.1 Frequency offset analysis
802.16d 802.11a/g
BW 3.5 7.0 14.0 28.0 20
n 8/7 1
Ts(ns) 250 125 62.5 31.25 50
△f(KHz) 15.625 31.25 62.5 125 312.5
Fractional estimation range(KHz) ±31.25 ±62.5 ±125 ±320 ±625
Center frequency tolerance (ppm) ±8 ±20
Carrier frequency(GHz) 10.68 5
Maximum carrier offset(KHz) ±170.888 ±200
From eq. (2.3) and (2.4), the CFO estimation range is smaller than the maximum carrier offset and there will be another frequency offset estimation in IEEE 802.16d.
19
2.2
Synchronization Architecture for IEEE 802.11a/g System
In 802.11a/g system, two structures can be used to accomplish synchronization as shown in Fig. 2.1 and Fig. 2.2. In Fig. 2.1, received data is processed by symbol boundary detection, and then correct its frequency offset [4]. Symbol boundary detection block can be done before the CFO estimation block because of the real value long preamble. However, received data corrects its frequency offset, and then finds out the symbol boundary in Fig. 2.2 [5].
Figure 2.1 IEEE 802.11a/g synchronization architecture 1
Figure 2.2 IEEE 802.11a/g synchronization architecture 2
2.3 Synchronization Architecture for IEEE 802.16d System
In IEEE 802.16d system, there are also two architectures. The two architectures shown in Fig. 2.3 and Fig. 2.4 are like the architecture in Fig. 2.2. The symbol timing can’t be acquired before the two frequency correction blocks because of complex value long preamble. So the synchronization is done by correcting system frequency offset, and then finding out the symbol boundary. The difference between these two
20
architectures is at the last two functional blocks. Architecture shown in Fig. 2.3 uses time domain operation of integral CFO estimation and time domain operation of symbol boundary detection [11]. Architecture shown in Fig. 2.4 utilizes frequency domain operation of integral CFO estimation and frequency domain operation of symbol boundary detection [12]. Frequency domain operation of integral CFO estimation cost more hardware than time domain operation because of several complex multiplications. Moreover, frequency domain operation of symbol boundary detection is also more complex because it needs another FFT block to translate channel frequency response to channel impulse response.
Figure 2.3 IEEE 802.16d synchronization architecture 1
Figure 2.4 IEEE 802.16d synchronization architecture 2
2.4 Proposed Multimode Synchronization Architecture
Multimode synchronization architecture is proposed as shown in Fig. 2.5.the architecture 2 in Fig. 2.2 and architecture 1 in Fig. 2.3 is combined. The integral CFO block is overhead in IEEE 802.11a/g mode. In order to balance the hardware cost of
21
these standards, the proposed multimode synchronization architecture has a low complexity integral CFO block.
22
Chapter3
Circuit Design for Multimode
Synchronization Blocks
3.1 Frame Detection
3.1.1 Algorithm
The AGC and clock synchronization are supposed to be performed before frame detection. Conventional method often uses a normalized autocorrelation with a predefined threshold to detect the incoming frame [14]. Normalized autocorrelation is shown in eq. 3.1 to eq. 3.3 where r(n) are received data samples and D is delay between two sequence and L is the accumulating window length. The advantage of Conventional method is more robust to multipath fading channel. Fig. 3.1 shows the normalized autocorrelation diagram .
2 ( ) ( ) ( ) C n M n P n = (3.1) 1 * 0 ( ) L n i n i D i C n - r r+ + + = =
å
(3.2) 2 1 0 ( ) L n i D i P n - r+ + = =å
(3.3)23
Figure 3.1 Normalized autocorrelation diagram
The hardware complexity of normalized autocorrelation is high because of the division. However, a modified frame detection algorithm is proposed. The correlation term and power term shown in eq. 3.2 and eq.3.3 are calculated in step 1. The delay (D) is 64 for IEEE 802.16d and 16 for IEEE 802.11a/g. The accumulating window length (L) is 64 for these two standards. Fig. 3.2 shows the Correlation diagram.
24
We can see that the amplitude of correlation in eq. 3.2 will be influenced by multipath fading channel. If a fixed threshold is used to detect the frames, the position that indicates where the frame starts will vary for a large range. In step 2, eq. 3.4 is used to find out whether a frame is coming or not.
' '
arg min[ ( )
max( ( )) 0.8]
frame n
n
c n
P n
where n
n
=
>
´
£
(3.4)By comparing the correlation term and power term, the detection will be robust to multipath path fading. Fig. 3.3 and Fig. 3.4 show the frame detection distribution diagrams in IEEE 802.11a/g and IEEE 802,16d respectively.
Figure 3.3 Frame detection distribution in IEEE 802.11a/g
540 550 560 570 580 590 600 610 620 630 640 650 0 0.05 0.1 0.15 0.2 0.25 0.3 0.35 0.4 0.45 0.5 sample position F ra m e d et ec tion d is tr ibu tion
25
Figure 3.4 Frame detection distribution in IEEE 802.16d
Note that absolute value of C(n) is need in eq. 3.4. In order to reduce hardware complexity and maintain accuracy, an absolute value approximation circuit is proposed.
3.1.2 Absolute value approximation circuit
The absolute value of a complex number (I+jQ) is shown in eq. 3.6 and an absolute value approximation is shown in eq. 3.7. By comparing these two eq.s, we can find out the approximation error as shown in eq. 3.8
max( , ), min( , ) a= I Q b= I Q (3.5) 2 2 2 2 2 2 2 (1 b ) 1 (b ) a bj a b a a a a + = + = + = + (3.6) 2 2 2 2 2 2 1 2 ( ) ( ) b b b a a
index index a index a
+ = + + (3.7) 410 420 430 440 450 460 470 480 490 500 510 0 0.05 0.1 0.15 0.2 0.25 0.3 0.35 0.4 sample position F ra m e de te ct ion d is tr ibu tion
26 2 2 2 2 2 2 2 2 _ (2 ) ( ) ( ) b b b error index a index a index a = - + (3.8)
By investigating the index from 2 to 5, we can get the approximation error functions in eq. 3.9.The approximation error plot as a function of b/a is shown in Fig. 3.5. 2 2 2 2 2 2 2 2 2 2 2 2 2 2 2 2 2 2 2 2 2 2 2 2 2 2 2 2 2 2 2 2 2 (2 ) 2 2 3 (2 ) 3 3 4 (2 ) 4 4 5 (2 ) 5 5 b b b error a a a b b b error a a a b b b error a a a b b b error a a a = - + = - + = - + = - + (3.9)
Figure 3.5 Approximation error plots
By system simulation, the distribution of b/a can be found for IEEE 802.16d and IEEE 802.11a/g. Fig. 3.6 and Fig. 3.7 shows the distribution for these two standards. The product of error value and distribution in Fig. 3.6 and 3.7 is used to estimate approximation performance. Table 3.1 and Table 3.2 show the approximation
27
performance for IEEE 802.16d and IEEE 802.11a/g respectively. From table 3.1 and table 3.2 , the best approximation is a+b/4 in both standards. The approximation accuracy is 2~3 times the accuracy of a+b/2 [10].
Figure 3.6 Distribution of IEEE 802.11a/g
Figure 3.7 Distribution of IEEE 802.16d
0.1 0.2 0.3 0.4 0.5 0.6 0.7 0.8 0.9 1 0 5 10 15 20 25 30 35 b/a % 0.1 0.2 0.3 0.4 0.5 0.6 0.7 0.8 0.9 1 0 5 10 15 20 25 30 b/a %
28
Table 3.1 Approximation performance of IEEE 802.11a/g 802.11a/g error*distribution a+b/2 22.6873 a+b/3 9.5150 a+b/4 9.1302 a+b/5 10.6549
Table 3.2 Approximation performance of IEEE 802.16d 802.16d error*distribution a+b/2 23.9383 a+b/3 9.4477 a+b/4 7.3156 a+b/5 7.7097
3.1.3 Multimode Circuit Design for Frame Detection
The multimode circuit for frame detection is shown in Fig. 3.8. First of all, the autocorrelation circuit is implemented in an iterative form. The circuit only uses one complex multiplier and two complex adders. The proposed AVAC circuit follows the autocorrelation circuit. The n’’ is used to indicate incoming frames. The Max_c is the maximum that is used to estimate CFO.
29
Figure 3.8 Multimode frame detection circuit
3.2 Fractional CFO Estimation and Compensation
3.2.1 Algorithm
Inter-Carrier Interference will cause the degradation of system performance. The degradation in SNR was approximated by eq. 3.10 [15].
2 0 10 ( ) 3ln10 s Loss E SNR T f N p = D (3.10) where △f is the frequency offset as a fraction of the subcarrier spacing and T is the sampling period.. Thus, the carrier frequency offset needs to be compensated before the received data go through FFT. The received data are expressed as
2 ( ) ( ) ( ) , j n N f i r n s n e w n p e e e e -= + = + (3.11) Where s(n) are transmitted data and w(n) are AWGN noise and εf is fractional CFO
and εi is integral CFO.A simple algorithm shown in eq. 3.12 can be used to estimate
fractional CFO [5]. The CFO compensation show in eq. 3.13 can be done by rotating the received data with its corresponding angle.
30 1 * 0 max( ( )) max( ) 2 2 L f n i n i D i N N c n r r D D e p p -+ + + = - -= Ð = Ð
å
(3.12) 2 ' ( ) ( ) f j n N r n r n e p e = (3.13) The common used hardware implementation of fraction CFO estimation uses a CORDIC circuit. The hardware implementation of fraction CFO compensation uses a look-up table (LUT) with a complex multiplier. However, one modified CORDIC circuit is used for both CFO estimation and CFO compensation.3.2.2 CORDIC Cell Circuit Design
The rotation of a vector [xi-1 , yi-1] with angle θi is shown in Fig. 3.9. The
CORDIC is based on the rotation matrix in eq. 3.14. The equation can be modified as shown in eq. 3.15. 1 1 cos sin sin cos i i i i i i i i x x y y q q q q -é ù -é ù é ù = ê ú ê ú ê ú ë û ë û ë û (3.14)
Figure 3.9 Rotation in Cartesian coordinate system
1 2 1 1 tan 1 tan 1 1 tan i i i i i i i x x y y q q q -é ù é ù é ù = ê ú ê ú ê ú + ë û ë û ë û (3.15)
By using the simplification in eq. 3.16, a reduced form of eq. 3.15 is shown in eq. 3.17.
tan 2 i
i
31 1 2 1 1 2 1 2 1 1 2 i i i i i i i x x y y -é ù é ù= - é ù ê ú ê ú ê ú + ë û ë ûë û (3.17)
Based on eq. 3.17, the equation used for fractional CFO estimation is shown in eq. 3.18 and the compensation equation is shown in eq. 3.19 where zi-1 is the angle of vector
[xi-1 , yi-1]. 1 1 1 1 1 1 1 1
2
2
tan (2 )
1,
0
1,
0
i i i i i i i i i i i i i i i i ix
x
y
y
y
x
z
z
y
y
s
s
s
s
-- -- ---=
-=
+
=
--
³
ì
= í
<
î
(3.18) 1 1 1 1 1 1 1 12
2
tan (2 )
1,
0
1,
0
i i i i i i i i i i i i i i i i ix
x
y
y
y
x
z
z
z
z
s
s
s
s
-- -- ---=
-=
+
=
+
-
³
ì
= í
<
î
(3.19)In order to combine the two equations above, a parameter σ is added and a CORDIC cell with estimation and compensation is shown in eq. 3.20. Fig. 3.10 shows the CORDIC cell circuit diagram.
1 1 1 1 1 1 1 1 1 1
( )2
( )2
(
) tan (2 )
1,
0
1,
,
1,
0
1,
i i i i i i i i i i i i i i i i i i ix
x
y
y
y
x
z
z
y or z
estimation
y or z
compensation
s
s
s s
s
s
-- -- -- -- ---=
-=
+
=
--
³
ì
ì
=
í
=
í
<
î
-î
(3.20)32
Figure 3.10 Modified CORDIC cell
3.2.3 Angle Consideration of Estimation
At CFO estimation, the angle of a detected vector needs to be found. The possible range of the angle is from -πto π. However, the estimation angle can be reduced to π/2 by a mirror step. Thus, the estimation angle must be larger than π/2. The estimation angle depends on two factors: number of stages and sequence of elementary rotations. The number of stage is ten because CFO estimation needs high accuracy. The rule that must obey in deciding sequence of elementary rotations is shown in eq. 3.21.
1 1 1 1 2
tan (2 ) (tan (2- -i < - - +i ) tan (2+ - - +i ) ...)+ (3.21)
Under this constraint, Table 3.3 gives the optimum sequence of elementary rotations.
Table 3.3 Sequence of elementary rotations for estimation
stage
arctan
i=0
0.7854
i=1
0.4636
i=2
0.2450
i=3
0.1244
i=4
0.0624
33
i=5
0.0312
i=6
0.0156
i=7
0.0078
i=8
0.0039
i=9
0.0020
1.7413
3.2.4 Angle Consideration of Compensation
The constraint of compensation is that rotation angle must be larger than πbecause the angle of vector is possible in the range of -πto π.The sequence of elementary rotations must be modified under the constraint shown in eq. 3.21. The rotation angle can be larger if the number of i=0 increases. Table 4 show a sequence of elementary rotations which angle is larger than π.
Table 3.4 Sequence of elementary rotations for compensation
stage
arctan
i=0
0.7854
i=0
0.7854
i=0
0.7854
i=1
0.4636
i=2
0.2450
i=3
0.1244
i=4
0.0624
i=5
0.0312
i=6
0.0156
i=7
0.0078
3.3063
34
While the compensation accuracy of the sequence in table 3.4 is only 0.0078, the accuracy reduction will also result system performance degradation. In order to improve compensation without increasing hardware, a sequence of elementary rotation is proposed in table 3.5
Table 3.5 Proposed sequence of elementary rotations for compensation
stage
arctan
i=-3
1.4464
i=0
0.7854
i=1
0.4636
i=2
0.2450
i=3
0.1244
i=4
0.0624
i=5
0.0312
i=6
0.0156
i=7
0.0078
i=8
0.0039
3.1858
3.2.5 Multimode Circuit Design for Fractional CFO
Estimation and Compensation
A CORDIC based fractional CFO estimation and compensation circuit is shown in Fig. 3.11 and Fig. 3.12 shows the cascaded CORDIC stage. Considering the system clock constraint, the ten CORDIC stages is divided into three pipeline stages. First of all, the Max_c signal from frame detection goes through the ten CORDIC stages which are working in estimation mode. The initial angle used in estimation is zero. After
35
finishing the estimation, the received data from RAM is passing into ten CORDIC stages which are working in compensation mode. At this time, the initial angle is the output of phase accumulator. The phase accumulator is adjusted by the control signal which is different in different standards.
Figure 3.11 CORDIC based fractional CFO estimation and compensation circuit
Figure 3.12 Cascaded CORDIC stage
3.3 Integral CFO Estimation
3.3.1 Algorithm
The received data after fractional CFO compensation is shown in eq. 3.22. The maximum of integral CFO will be different in different standards. In IEEE 802.16d the Integral CFO is restricted in the range of -12 subcarrier spacing to 12 subcarrier
36 spacing. 2 ' ( ) ( ) i , {..., 12, 8, 4,0, 4,8,12,...} j n N r n s n e pe e = Î - - - (3.22)
The algorithm used to estimate Integral CFO is shown in eq. 3.23 [11]
64 64 ' ' 1 7 1 1 max( 1, 2, 3, 4, 5, 6, 7) 1 ( ) ( ),...., 7 ( ) ( ) i k k M M M M M M M M r n k p k M r n k p k e = = = =
å
+ =å
+ (3.23) Where p1, p2, p3, p4, p5, p6, p7 are a first 64 data samples of long preamble with different integral CFO. The p1 sequence has been influenced by integral CFO of -12 times of subcarrier spacing. The p2 sequence has been influenced by integral CFO of -8 times of subcarrier spacing. The p3 sequence has been influenced by integral CFO of -4 times of subcarrier spacing. The p4 sequence has not been influenced by integral CFO. The p5 sequence has been influenced by integral CFO of 4 times of subcarrier spacing. The p6 sequence has been influenced by integral CFO of 8 times of subcarrier spacing. The p7 sequence has been influenced by integral CFO of 12 times of subcarrier spacing.3.3.2 Circuit Design for Integral CFO Estimation
A match filter based integral CFO estimation is shown in Fig. 3.13. The sign of each received data is used for the sake of complexity reduction. The match filter circuit is shown in Fig. 3.14 and the reduced multiplier is shown in Fig. 3.15.the function of gate level selection is shown in table 3.6
37
Table 3.6 Gate level selection
selection Condition
0 Real_data = Real_p Imag_data=Imag_p 1 Imag_data= real_p Real_data=imag_p 2 Real_data = ~real_p Imag_data=~imag_p 3 Imag_data = ~real_p Real_data =imag_p
Figure 3.13 Integral CFO Estimation circuit
38
Figure 3.15 Reduced multiplier
3.4 Symbol boundary Detection
3.4.1 Algorithm
The purpose of symbol boundary detection is to find the ISI-free window for each symbol. A modified symbol boundary detection algorithm is proposed. The conventional cross correlation method shown in eq. 3.24 is used in step 1.
64 * 1 ( ) ''( ) ( ) SBD k M n r n k p k = =
å
+ (3.24)Where p sequence are the first 64 points of long preamble and r’’ are data samples after frequency correction. If the method in step 1 is used without any adjustment, the symbol boundary detection is possible to find the ISI window rather than ISI-free window. Fig. 3.16 shows the ISI effect caused by wrong symbol boundary detection when the signal in path 2 has maximum power.
39
In step 2, eq. 3.25 and eq. 3.26 express where the reference symbol boundary is. The response of MSBD(n) and MMSBD(n) is shown in Fig. 3.17 [7]
( ) ( ) ( ) SBD SBD SBD MM n =M n +M n D+ (3.25) arg max[ ( )] ref SBD n n = MM n (3.26)
The delay (D) is 128 for IEEE 802.16d and 64 for IEEE 802.11a/g. Eq. 3.27 is used to find out the correct symbol boundary detection if the signal with largest power is not on path 1.It searches the ten data samples in front of the reference symbol boundary and finds the data sample that is larger than a half of max(MSBD) with minimum timing
index. ' max( ) arg min[ ( ') ] 2 ' [ | 10 ] SBD SBD SBD n ref ref M n M n n n n n n = > Ì - £ £ (3.27)
40
3.4.2 Multimode Circuit Design for Symbol Boundary Detection
The multimode circuit for symbol boundary is shown in Fig. 3.18. If the MM_MAX is updated, the FFT position functional block will update simultaneously. The correct FFT data will be passed to the next stage when the counter_SBD reaches the predefined value.
41
Chapter4
Simulation and FPGA Emulation
4.1 Simulation Result and Performance Analysis
4.1.1 Simulation Setup
Fig. 4.1 shows the simulation setup for this section. The hardware we proposed will be substituted the ideal synchronization. The multipath channel presented in section 1.5 generates SUI channel impulse response and exponentially decaying channel impulse response, respectively. During the simulation, there is an assumption that AGC has been processed.
42
4.1.2 Frame Detection Performance
Fig. 4.2 shows the frame detection performance in IEEE 802.11a/g.The simulation condition is under transmitting 1000 packets and multipath channel with rms delay spread 50 ns. The suitable frame detection rate must be larger than 90% because the system PER must be lower than 10%. Thus, the SNR of suitable frame detection rate is about 2.5 dB.
Figure 4.2 Frame detection performance in 802.11a/g
Fig. 4.3 shows the frame detection performance in IEEE 802.16d. The simulation condition is under transmitting 1000 frames, SUI-3 multipath channel, qpsk modulation and bandwidth is 7 MHz. From Fig. 4.3, we can see that the SNR of suitable frame detection rate is about 9 dB because the system BER must be lower than 10-6.
43
Figure 4.3 frame detection performance in 802.16d
4.1.3 Fractional CFO Estimation Performance
The fractional CFO estimation Performance of IEEE 802.11a/g is shown in Fig. 4.3. The simulation condition is under maximum CFO value and multipath channel with rms delay spread 50 ns. The conventional method [4] described in Fig. 4.3 a two step estimation approach. The two step estimation uses an autocorrelation which length equals to 16 first, and then uses the autocorrelation which length is 64. The proposed method uses only one autocorrelation which length equal to 64. Actually the proposed method in IEEE 802.11a/g is exactly the method in IEEE 802.16d. The fractional CFO estimation performance is shown in Fig. 4.4. The simulation condition is under CFO of 5.75 times subcarrier spacing, SUI-3 multipath channel, qpsk modulation and bandwidth is 7 MHz. We can see that the performance in IEEE 802.16d is about the same the performance of other methods [8].
44
Figure 4.4 Fraction CFO estimation performance in 802.11a/g
45
4.1.4 Integral CFO Estimation Performance
The Integral CFO Estimation performance is shown in Fig. 4.5. The performance of frequency domain integral CFO estimation is better than the performance of time domain estimation under negative SNR. However, the performance is almost the same if SNR is larger than zero. In consideration of compensation, the hardware complexity of time domain approach must less than frequency domain approach.
Figure 4.6 Integral CFO Estimation performance in 802.16d
4.1.5 BER Performance in IEEE 802.16d
46
condition is under CFO of 5.75 times subcarrier spacing, SUI-3 multipath channel, 1/2 coding rate and bandwidth is 7 MHz. comparing Fig. 4.6 to table 4.1 ,we can find that the BER performance can conform to the system simulation constraint.
Table 4.1 System simulation constraint of IEEE 802.16d
modulation Coding rate Receiver SNR (dB)
BPSK 1/2 11.4 QPSK 1/2 14.4 3/4 16.2 16QAM 1/2 21.4 3/4 23.2 64QAM 1/2 27.7 3/4 29.4
47
4.1.6 BER Performance in IEEE 802.11a/g
The PER performance in IEEE 802.11a/g is shown in Fig. 4.7. The simulation condition is under maximum CFO value, multipath channel with rms delay spread 50 ns and 3/4 coding rate. comparing Fig. 4.7 to table 4.2 ,we can find that the PER performance can conform to the system simulation constraint of IEEE 802.11a/g.
Table 4.2 System simulation constraint of IEEE 802.11a/g
modulation Coding rate Receiver SNR (dB)
BPSK 1/2 9 3/4 10 QPSK 1/2 12 3/4 14 16QAM 1/2 17 3/4 21 64QAM 2/3 25 3/4 26
48
4.2 Hardware comparison
Table 4.3 shows the hardware comparison of fractional CFO estimation and compensation. The gate count of the proposed design is less than the reference design at least 46%.
Table 4.3 Hardware comparison of fractional CFO estimation and compensation
proposed
CORDIC +LUT or Sinusoid generator+
Complex multiplier[16]
Gate Count
62799.1
116816.5+LUT or Sinusoid generator
Table 4.4 shows the hardware comparison of synchronization circuit. By synthesizing to UMC 0.18um CMOS standard cell technology library with Synopsys Design Compiler, the gate count of synchronization circuit is about 124k
Table 4.4 Hardware comparison of synchronization circuit
Proposed WLAN & WiMax
[6] WLAN [4] WLAN [9] WiMax Frame Detection 58168 16032 22800 N/A
Fractional CFO Estimation and Compensation 6279 136339 10100 N/A Integral CFO Estimation
38147 none none N/A
Symbol boundary Detection
20411 8161 8800 N/A
49
4.3 FPGA Emulation
FPGA emulation plan is shown in Fig. 4.9. We transmits data to Xilinx FPGA via VeriComm Pro software. The VeriComm Pro software and the Xilinx FPGA is presented in Fig. 4.10. The FPGA synthesis report is provided in Fig. 4.11.The total equivalent gate count of design includes register file. In this design, four 12x256 bits of register file and four 12x300 bits of register file are used. Fig.4.12 shows the RTL simulation result and the FPGA emulation result.
Figure 4.9 FPGA emulation plan
50
Figure 4.11 FPGA synthesis report
51
Chapter5
Conclusions and Future Work
5.1 Conclusions
In the thesis, a multimode synchronization circuit is designed for both IEEE 802.16d and IEEE 802.11a/g systems. The performance of the multimode circuit can conform to the two receiver requirements. A modified absolute value approximation circuit (AVAC) that improves accuracy 2~3 times the accuracy of traditional method is provided. The fractional CFO estimator can have outstanding performance while the system is under IEEE802.11a/g mode. A modified CORDIC circuit for fraction CFO estimation and compensation is presented. After integral CFO estimation, the integral CFO compensation uses the same modified CORDIC circuit. The CORDIC circuit can be used other standards directly. The hardware of the multimode synchronization circuit is low and suitable for SOC integration. The multimode synchronization circuit has been verified by software simulation on Matlab platform and hardware implementation on FPGA with Virtex 4.
5.2 Future Work
There are still many non-ideal effects, including phase noise, IQ imbalance and power amplifier nonlinearity. In the presence of these non-ideal effects, the estimator and detector performance will degrade. Future work is to complete the multimode
52
synchronization circuit design in consideration of those non-ideal effects and then to complete the multimode receiver design by integrating channel estimator, equalizer and outer receiver.
53
Bibliography
[1] IEEE Std. 802.16. IEEE Standard for Local and Metropolitan Area Networks Part 16: Air-interface for Fixed Broadband Wireless Access Systems, 2004 [2] IEEE, “Wireless LAN Medium Access Control and Physical Layer
specifications: High-speed physical layer in the 5GHz band,” P802.11a/D7.0, July 1999
[3] V. Erceg, K.V.S Hari, M.S. Smith et al., “Channel models for fixed wireless applications,” Contribution IEEE 802.16.3c-01/29r1, Feb.2001
[4] C.S. Peng, OFDM Transceiver Design for Wireless Applications, Ph.D thesis, National Chiao Tung University, 2006
[5] J. Heiskala and J. Terry, OFDM Wireless LANs: A Theoretical and Practical Guide, Sams, 2002
[6] C.M. Chang, Design of 802.11a Basedband Transmitter and Synchronization, Master thesis, National Chiao Tung University, 2003
[7] Yanxin Yan; Tomisawa, M.; Yi Gong; Yong Liang Guan; Gang Wu; Choi Look Law, “Joint timing and frequency synchronization for IEEE 802.16 OFDM systems”, Mobile WiMAX Symposium, 2007. IEEE 25-29 March 2007
[8] Kim, Tae-Hwan; Park, In-Cheol, “Two-Step Approach for Coarse Time Synchronization and Frequency Offset Estimation for IEEE 802.16d Systems”, Signal Processing Systems, 2007 IEEE Workshop on 17-19 Oct. 2007
[9] C.N. Lin, Design of Symbol Boundary Detection and Carrier Frequency Offset Synchronization for WMAN Downlink, Master thesis, National Chiao Tung University, 2007
[10] P. B. Denyer and D. Renshaw, VLSI Signal Processing: A Bit-Serial Approach. Boston, MA: Addison-Wesley
54
[11] Y. C. Lei, “Construction of a Baseband Receiver for IEEE 802.16 OFDM Mode Subscriber Station ”, Master Thesis, National Taiwan University, 2005
[12] M. H. Wu, “A Reconfigurable Architecture for OFDM-based Wireless Communication Systems”, Master Thesis, National Taiwan University, 2005 [13] R. Van Nee and R. Prasad, OFDM Wireless Multimedia Communication, Artech
House, Boston, 2000
[14] Schmidl. T.M. and Cox, D.C, “Robust frequency and timing synchronization for OFDM,” IEEE Trans. on Communications, pp1613-1621,Dec 1997
[15] T. Pollet, M. Van Bladel and M. Moeneclay. ”BER sensitivity of OFDM systems to carrier frequency offset and wiener phase noise ”. IEEE Trans. Commun.,vol.43, pages:191-193, Feb/Mar/Apr 1995.
[16] C.C. Hsu, Realization of Synchronization for OFDM-Based Wireless LAN Sstem, Master thesis, National Chung Hsing University, 2005
55
Vita
姓名 : 楊士賢 性別 : 男 出生地 : 新竹市 生日 : 民國七十三年三月十五日 地址 : 新竹市竹光路一百一十七號 學歷 : 國立交通大學電子工程研究所碩士班 2006/09~2008/06 國立中興大學電機工程學系 2004/09~2006/06 新竹市立新竹高級中學 2001/09~2004/06論文題目 : CORDIC Based Multimode Synchronization Circuit Design for IEEE 802.16d and 802.11a/g systems


![Fig. 1.7 shows the PPDU frame format defined in IEEE 802.11a/g [2]. It includes the OFDM PLCP preamble, OFDM PLCP header, PSDU, tail bits, and pad bits](https://thumb-ap.123doks.com/thumbv2/9libinfo/8611849.190783/20.892.135.759.541.1064/ppdu-format-defined-includes-ofdm-preamble-header-psdu.webp)