國 立 交 通 大 學
電信工程學系
博 士 論 文
基於諧振與同調觀點之血液壓力波分析
Analysis of Blood Pressure Wave Based on
the Viewpoint of Resonance and Coherence
研究生:魏清泉
指導教授:吳霖堃
共同指導教授:羅佩禎
基於諧振與同調觀點之血液壓力波分析
Analysis of Blood Pressure Wave Based on the
Viewpoint of Resonance and Coherence
研究生:魏清泉
Student : Ching-Chuan Wei
指導教授:吳霖堃
Advisor : Lin-Kun Wu
共同指導教授:羅佩禎
Co-advisor : Pei-Chen Lo
國 立 交 通 大 學
電信工程學系
博 士 論 文
Submitted to Department of Communication Engineering
College of Electrical Engineering and Computer Science
National Chiao Tung University
in Partial Fulfillment of the Requirements
for the Degree of
Doctor of Philosophy
in
Communication Engineering
January 2006
Hsinchu, Taiwan, Republic of China
基於諧振與同調觀點之血液壓力波分析
國 立 交 通 大 學 電信工程學系 研究生: 魏清泉 指導教授 : 吳霖堃 共同指導教授 : 羅佩禎 摘要 在這篇論文中我們提出一個新的觀點來分析血液循環,也就是將血液循環系 統視為一個電訊號激發的機械振動系統,並且用一個以橫向振動為主的血液壓力 波方程式來描述血液循環時的諧振現象,接著我們把ECG與BPW(血液壓力波)視為 此系統的輸入與輸出,並探討它的頻域特性,首先我們發現對於健康的受測者, 其 ECG 與 BPW 的 功 率 頻 譜 有 相 當 大 的 重 疊 , 頻 譜 耦 合 係 數 (Spectral coupling coefficient)趨近於1,而心血管相關疾病的患者則有較大的差異,頻譜耦合係數 小於1,此乃因為健康者的動脈系統彈性極佳,能將心臟搏動的頻率變化完整地 耦合至動脈系統,也就是心臟與動脈系統發生諧振; 而心血管相關疾病的患者, 則因動脈系統彈性較差或其它阻力而無法完整地耦合心臟搏動的頻率到動脈系 統,其諧振特性較差; 另一方面,其三階頻譜(Bicoherence) 趨近於1,顯示對於 健康的受測者,其ECG與BPW有較強的相位耦合,而心血管相關疾病的患者其相位 耦合則較弱; 此外健康的受測者其轉移函數(Transfer function)也較心血管相關 疾病的患者有較平坦的曲線,這些結果都顯示健康者的動脈系統彈性較心血管相 關疾病的患者好。我們也建立此系統的頻域電路模型,並計算其諧振品質因素, 結果顯示健康的受測者有較高的諧振品質因素。 此外ECG 的頻率調變及振幅調變效應、血管壁的欠阻尼與過阻尼效應也被探 討,在輸入的電刺激信號與輸出的血管壁振動信號間,我們計算其同調函數 (Coherence function) ,因此我們可以計算輸入(心臟) 與輸出(動脈系統) 間同調及干擾的程度,前五個諧波的平均同調值被用來衡量同調的程度,實驗結果顯示 健康的受測者其平均同調值趨近於 1,同調的程度較心血管相關疾病的患者高, 也就是干擾的程度較小,根據上述這些觀念,我們得以建立一個血液循環的系統 模型。 最後我們研究靜坐前後對心血管循環系統時域特性的影響,我們觀察 BPW 中 P 波的上升斜率、T 波的高度、降中峽的高度、D 波的高度等參數,實驗結果 顯示實驗組(靜坐者)的 P 波的上升斜率、T 波及 D 波的高度皆較控制組明顯地 (P<0.05)增加而降中峽的高度明顯地減少,顯示經由靜坐的訓練能使心血管循環 系統的特性有明顯地改善。
Analysis of Blood Pressure Wave Based on the
Viewpoint of Resonance and Coherence
Department of Communication Engineering National Chiao Tung University
Student : Ching-Chuan Wei Advisor : Lin-Kun Wu
Co-advisor : Pei-Chen Lo
Abstract
In this dissertation, we presented a novel idea for analyzing blood circulation that is viewed as an electrically-driven, mechanical-pumping mechanism. Besides, a blood pressure wave equation (BPW)with radial dilation is used to describe the resonance effect in blood circulation. Considering the ECG (electrocardiograph) and BPW as the input and output signals of the system, we aim to apply the spectral analysis approach for evaluating the property of blood circulation from the viewpoint of resonance and coherence. First, the power spectrum of the ECG coincides well with that of the BPW for healthy subjects, but deviates significantly from the BPW’s for vascular patients. According to the results, we may infer that the artery wall of healthy subjects exhibits better elasticity of artery wall for healthy subjects than that of cardiovascular-related patients. Thus, the spectrum of ECG can be completely coupled to BPW’s. In other words, heart resonates with the arterial system. Second, bispectral analysis
demonstrates a strong phase coupling between ECG and BPW for the healthy subjects and a weaker coupling for subjects with vascular problems. Third, the transfer function for healthy subjects exhibits a flatter magnitude than that for patients. All the results demonstrate that healthy subjects possess better artery elasticity for healthy subjects than that for cardiovascular patients. In addition, we propose a resonance circuit model in frequency domain to characterize the behavior of blood circulation. The quality factor of a healthy model also reveals better resonance characteristic than the one of an abnormal model.
In addition, this thesis presents the results of investigating the FM (frequency modulation) and AM (amplitude modulation) effects on ECG, as well as the under-damping and over-damping effects in the blood circulation system are studied. Coherence function is used to measure the degree of BPW in resonance with ECG, from which perturbations of the system can be determined. System model based on the above concepts is accordingly established. The average of the first five peaks (S) is used to quantify the power coherence effect. The evaluated p-value (< 0.01) reveals that the distinction of power coherence between the healthy subjects and cardiovascular patients is significant. Consequently, we conclude that if the S approaches a value close to one, the output is almost completely attributed to the input. In the case, the system’s operation involves fewer perturbation signals so that the cardiovascular system will remain in a better condition. Conversely, if S is much below one, the cardiovascular system operates under high perturbation and tends to decay or become diseased.
Finally, we study the effect of Zen meditation on the characteristics of cardiovascular system, mainly based on the time-domain features of blood pressure
waveform. Four parameters derived from the BPW include the rising slope ( 1 1 t h ) of P
wave, the normalized height of T wave (
1 3
h h
), the normalized height of V valley3
(
1 4
h h
), and the normalized height of D wave (
1 5
h h
), where t1 and hi, i = 1, …, 5 are
quantitative features of the BPW waveform pattern. A larger value of
1 1
t h
reflects
better heart ejection ability and aorta compliance. A larger value of
1 3
h h
may infer an
arterial system with good elasticity. The decrease (increase) of
1 4
h h
parameter indicates the decrease (increase) of peripheral resistance of vessels. A larger value of
1 5
h h
indicates the better artery elasticity and aortic valve function. In comparison with
the control group, Zen-meditation practitioners have the post-meditation
1 1 t h , 1 3 h h , and 1 5 h h
increase more, while
1 4
h h
decrease more, with statistical significance (P<0.05). The observation allows us to infer that Zen meditation effectively improves some important characteristics relevant to the health condition of cardiovascular system.
誌謝
深深地感謝羅佩禎教授及吳霖堃教授的指導與協助,使得這篇論
文得以完成與呈現。同時也感謝與沈慧宇老師的討論,激發我的想法;
感謝黃瑞彬教授與劉裕永教授的協助;感謝生醫信號實驗室的夥伴們;
也感謝那些曾拒絕我的論文的編輯者,他們讓我修正了很多觀點;感
謝所有曾經與我同行的人。
最後,在寒冬的深夜裏,謝謝我摯愛的家人,麗卿、鵬倫、岳母與遠去的父親,你們的支持是我前進的動力。
TABLE OF CONTENTS Abstract (Chinese)………3 Abstract (English)……….5 Acknowledgements ………...8 TABLE OF CONTENTS ………..9 List of Figures………...11 List of Tables……….14
CHAPTER 1. INTRODUCTION………..15
1.1 Overview of Traditional Hemodynamics………..15
1.2 Viewpoint of this Research………..17
CHAPTER 2. RESONANCE AND COHERENCE………...21
2.1 Concept of Resonance and Coherence……….21
2.2 Mathematical Description………22
2.3 Signal Acquisition………25
CHAPTER 3. SPECTRAL-DOMAIN ANALYSIS………....31
3.1 Power Spectrum Analysis……….31
3.2 Bispectrum Analysis……….32
3.3 Transfer Function Analysis………...34
3.4 Experiment and Results……….35
3.5 Spectral-Domain Circuit Model……….36
CHAPTER 4. SYSTEM MODEL………....52
4.1 Modulated ECG……….52
4.2 Coherence Analysis………...53
4.3 Experiment and Results……….55
CHAPTER 5. BLOOD PRESSURE WAVE UNDER MEDITATION…………...61
5.1 Time-domain Features of BPW………..61
5.2 Experiment and results………...64
CHAPTER 6. CONCLUSION AND DISCUSSION…...………70
References ………...74
Personal Information ………...79
List of Figures
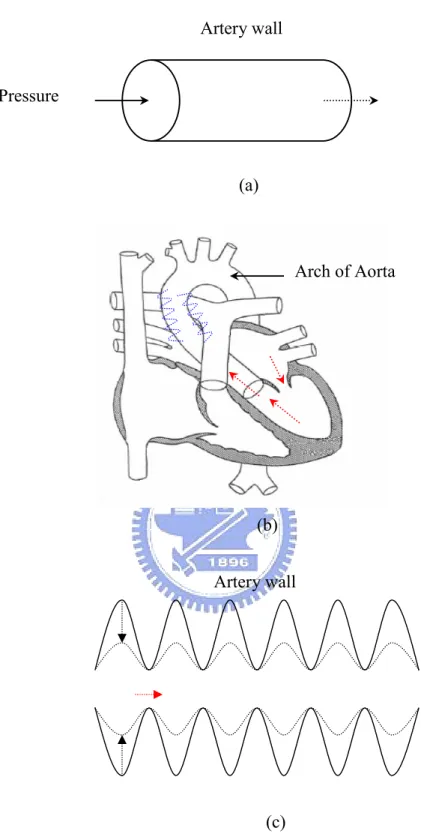
1. Fig.1. (a) From the viewpoint of traditional hemodynamics, the pressure imposed on blood vessel is along the tube. (b) The 180° bending at the arch of aorta transforming the kinetic energy of blood flow into elastic potential energy of artery wall is illustrated. (c) The pressure wave resulting from the elastic potential energy propagates along the artery; thus, the wall squeezes the low blood flow forward.
…………...………...19
2.
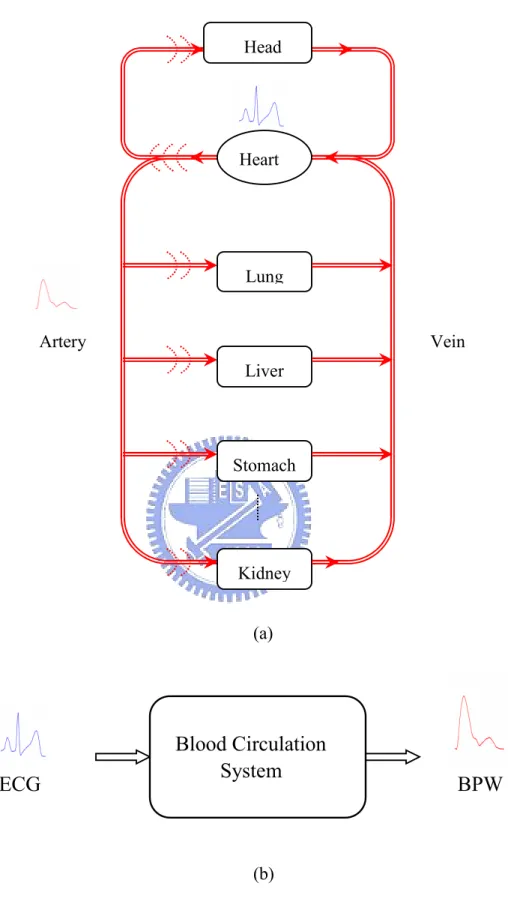
Fig. 2. (a) Schematic diagram of blood circulation system (b) The blood circulation is regarded as an electrical-driving, mechanical-pumping system………...203.
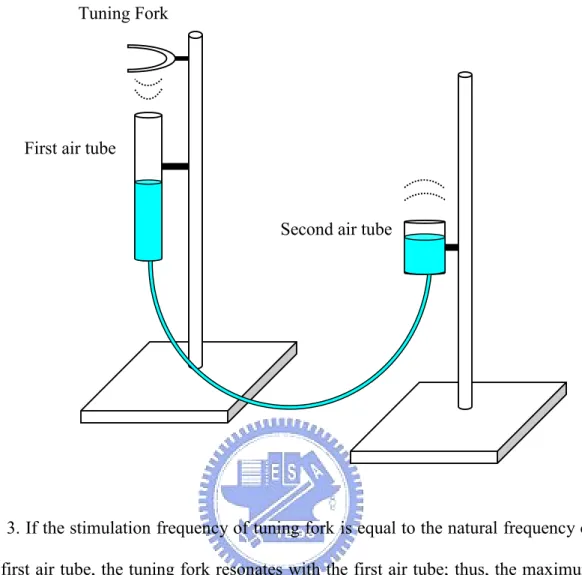
Fig. 3. If the stimulation frequency of tuning fork is equal to the natural frequency of the first air tube, the tuning fork resonates with the first air tube; thus, the maximum sound pressure wave of output is produced in the second air tube……….274.
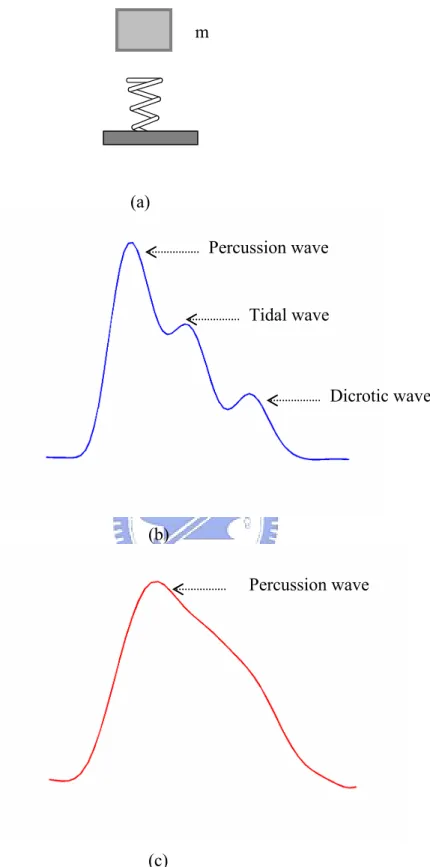
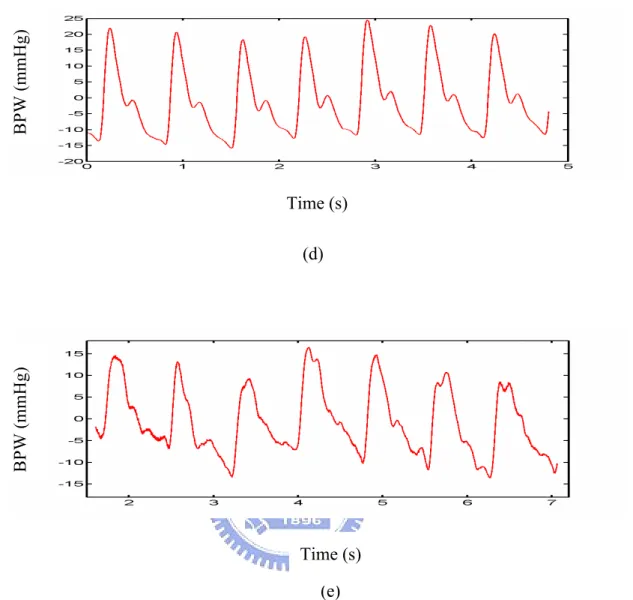
Fig. 4. (a) The vibration of artery behaves like the motion of spring with mass m. (b) The under-damped BPW waveform with three peaks (Percussion, Tidal and Dicrotic waves) is shown. (c) The over-damped BPW waveform with single peak (Percussion wave) is illustrated………28 5. Fig. 5 (a) The block diagram of the BPW detection instrument is illustrated. (b)The set up diagram of BPW detection instrument is shown. (c) The detection point at artery is shown. (d) A BPW of normal person is shown. (e) A BPW of patient isshown………...30
6. Fig. 6. Power spectral densities of ECG (solid curve) and BPW (dashed curve) for (a) a healthy subject, and (b) a cardiovascular-related patient……….42 7. Fig. 7. ECG bicoherence, BPW bicoherence, and ECG-BPW cross-bicoherence of (a) the healthy subject, and (b) the patient………...43
8. Fig. 8. Estimated transfer function of the healthy subject (solid curve) and the patient (dashed curve)………..44 9. Fig. 9. The results of analyzing 20 healthy subjects and 20 vascular patients are embedded in the three dimensional feature spaces: (correlation coefficient, the standard deviation of transfer function, and cross-bicoherence). Circles () represent the healthy subjects and asterisks () represent the patients………..45 10. Fig. 10. (a) The Windkessel model with four elements, (b) The spectral-domain circuit model, and (c) the serial equivalent circuit of Windkessel model with four elements are illustrated……….46
11. Fig. 11. The frequency response of the spectral-domain circuit model is simulated using various parameters to assess the resonance characteristics. (a)R11 R21 R31 R41 R51 0 and R12 R22 R32 R42 R52 10k(), (b) curve 1: R11 0, R21 0.01, R31 0.02, R41 0.03, R51 0.04(), curve 2: 01 . 0 11 R , R21 0.02 , R31 0.03 , R41 0.04 , R510.05 ( ), curve 3: 03 . 0 11 R , R21 0.04 , R310.05 , R410.06 , R51 0.07 ( ), curve 4: 05 . 0 11 R , R21 0.06 , R31 0.07 , R41 0.08 , R51 0.09 ( ), and k R R R R
R12 22 32 42 52 10 ( ) for all curves, (c) curve 1: R12 10k ,
k R22 ,1 R12 0.2k, R12 0.1k, R12 50(), curve 2: R12 10k, R22 0.8k, k R12 0.1 , R12 50, R12 30(), curve 3: R12 10k , R22 0.6k , R12 80, 40 12 R , R12 20(), curve 4: R12 10k , R22 0.4k , R12 60, R12 30 , 10 12
R (), and R11 R21 R31 R41 R51 0 for all curves………..48
12. Fig. 12. (a) The spectra of ECG and blood pressure wave are shown, where the peak in the range of 0 ~ 0.4 Hz is due to the modulation signals and the side peaks
around harmonics (sub-harmonics) are attributed to the inter-modulation effect. (b) The peak amplitude variation of the QRS complex wave of modulated ECG, which results from the AM modulation effect, is plotted with a dashed line……….57 13. Fig. 13. (a) The presented cardiovascular system model is plotted. (b) The schematic diagram of the spectra of original ECG, modulation signal and modulated ECG is illustrated……….58 14. Fig. 14. The coherence functions of a healthy subject and a cardiovascular patient are demonstrated………..59 15. Fig. 15. The statistical results of power coherence index S of twenty-two healthy subjects and twenty-two cardiovascular patients are demonstrated with box plot…..60 16. Fig. 16. Prototype of a normal blood pressure waveform (BPW)………..67 17. Fig. 17. The pre-meditation (solid curve) and post-meditation (dashed curve) BPW for an experimental subject……….68
List of Tables
1. Table 1. Statistical characteristics of correlation coefficient, cross-bicoherence, standard deviation of transfer function, and p-value for healthy and patient groups………...49 2. Table 2. The resonance quality factors (Q) of the subjects demonstrated in Fig. 6
are listed………...50 3. Table 3. The statistical results of resonance quality factor (Q) of twenty healthy
subjects and twenty vascular patients are illustrated………51 4. Table 4. The statistical results of four parameters (
1 1 t h , 1 3 h h , 1 4 h h , 1 5 h h ) and their variation percentages. P values are evaluated to show the statistical significance of discrimination between two groups………..69
CHAPTER 1. INTRODUCTION
1.1 Overview of Hemodynamics
The cardiovascular system is composed of the heart and blood vessels. They work together to form the blood-transporting system. Stimulated by ECG signal, the pumping of the heart constitutes the main force of oscillation, which thus forms a blood pressure wave (BPW) propagating along the arteries. With only 1.7 W power, an adult's heart pumps the blood to every part of the body, even up to the head, whose location is above the heart. Thus, there is no doubt that the cardiovascular system should develop a blood-transporting system with high efficiency to undertake the heavy load of blood transport.
In traditional hemodynamics, most studies such as Moens-Korteweg equation, Womersley equation, Windkessel model, etc., consider the blood flowing in longitudinal direction with static arterial wall (Fig. 1(a)), and the vibration of artery wall is just treated as a perturbation [1,2]. As a result, though the resonance effect had ever been proposed in blood circulation, McDonald supposed that resonance in arterial system is physically impossible due to the considerable damping of the reflected wave between reflection sites [1,2]. Actually, over 90% energy is stored in the vibration of arterial wall and less than 10% is stored in the longitudinal blood flow [1]. Traditional analysis ignored the potential energy caused by the transverse vibration of elastic arterial wall. It focuses concentrated on the kinetic energy generated by the axial momentum of blood flow. From the physiological viewpoint, the 180° bend at the arch of aorta converts the kinetic energy of blood flow into elastic potential energy of the artery wall as shown in Fig. 1(b). As a consequence, pressure wave originating from the transverse vibration of artery wall is generated,
that behaves like a transverse string wave (Fig. 1(c)).. Thus, resonance could be formed in transverse direction like an electromagnetic waveguide, and blood can flow in axial direction. Pressure wave transmission along artery makes energy transfer more efficient, that further reduces energy loss of making a turn. In addition, the vibration of artery wall squeezes the low axial blood flow so that the energy dissipated in viscosity is reduced. Thus, wave of BPW may propagate along axial direction in the arterial system [3].
Therefore, Wang et al. presented the concept of “resonance”in the arterial system to facilitate the blood flowing into the organ. They also found that individual spectral harmonic of BPW corresponded to each specific organ [5-7]. They have conducted several experiments to verify this model. Furthermore, they proposed a concept of
“frequency matching”to explain how organs were coupled with the heart [3]. They
presumed that when the heart rate approached the natural frequency of arterial system, the circulatory system would have an optimal output for the pressure pulse and, therefore, the highest blood flow. The phenomenon is called the frequency matching and, in such a case, the entire system operated in its resonant state. The natural frequency depends on the structural properties of arterial system, the physiological states of blood vessels and blood, as well as the boundary conditions at vascular junctions, which can be changed by pathological factors. Consequently, under the frequency matching condition (resonance), organs receive blood from the heart more efficiently that makes them stay in a better physiological condition. This concept suggests that the alterations in the natural frequency can diminish the coupling efficiency from the heart to the arterial system and cause various diseases. Therefore, the analysis of frequency as well as of the phase relationship between the heart beat and arterial oscillation becomes an essential issue.
In addition, researchers have found that a specific organ may closely correspond to a specific spectral harmonic of the BPW. For example, the kidney, renal artery, and aorta combined show a coupled oscillation that is analogous to the resonance circuits, and the kidney vascular system exhibits a resonant frequency at the second harmonic of the BPW [7]. Thus, the abnormal value of the second spectral harmonic of BPW often relates to diseases of the kidney. Moreover, research results have revealed that the Chinese herbal drugs and acupuncture, which act on some specific organ, can also cause an amplitude variation of a corresponding spectral harmonic of the BPW [8,9]. These results further support the link between spectral harmonics of BPWs and the status of organs. Moreover, the respective close relationships between the first, third, as well as fourth spectral harmonics of the BPW and the liver, spleen, and lung have also been reported and investigated [9]. In summary, investigating of the spectrum of BPWs is valuable. However, the criterion used to judge the normality or abnormality of the spectral harmonics of BPWs is statistical and not objective. Therefore, comparison with the source signal (ECG) of the blood circulation system helps to identify the status of the cardiovascular system or organs on the basis of the BPW.
1.2 Viewpoint of this Research
In this study, we analyze the complex blood circulation system from the macroscopic system viewpoint. it is the first attempt that the blood circulation is regarded as an electrically-driven, mechanical-pumping mechanism, as demonstrated in Fig. 2(a) and 2(b). The ECG of lead Ⅱ and the BPW of the radial artery detected at the wrist are assumed to be the input and the output signals of the system, respectively, on the basis of the physiological point of view. This viewpoint is also similar to a motor in which the driving signal is electrical and the output torque is a mechanical
power that pumps a fluid.
In frequency domain analysis, we investigate the input-output relationship using power spectrum, bispectrum, transfer function and quality factor. Also, we proposed a frequency domain equivalent circuit to model the blood circulation. In addition, due to the elasticity of arterial wall, the major function of the arterial system is to transport energy via its transverse vibration. Thus, transverse resonance similar to the electromagnetic waveguide is formed and artery wall coherently oscillates with the excitation source. By coherence function, we analyze the coherence relationship between input and output, and establish a system model for blood circulation on the basis of the resonance theory and coherence power transfer. Eventually, the experiment of twenty-two healthy subjects and twenty-two cardiovascular-related patients are performed and analyzed by the above methods.
As to the time-domain analysis, we utilize some parameters of BPW such as the rising slope of P wave, height of T wave, D wave and V valley (valley between T3
(a)
(b)
(c)
Fig. 1. (a) From the viewpoint of traditional hemodynamics, the pressure imposed on blood vessel is along the tube. (b) The 180° bending at the arch of aorta transforming the kinetic energy of blood flow into elastic potential energy of artery wall is illustrated. (c) The pressure wave resulting from the elastic potential energy propagates along the artery; thus, the wall squeezes the low blood flow forward.
Arch of Aorta
Artery wall Pressure
(a)
(b)
Fig. 2. (a) Schematic diagram of blood circulation system (b) The blood circulation is regarded as an electrically-driven, mechanical-pumping system.
ECG
BPW
Lung Liver Stomach Kidney Artery Vein Heart HeadBlood Circulation
System
CHAPTER 2. RESONANCE AND COHERENCE
2.1 Concept of Resonance and Coherence
In physics, it is well known that when an object is hit or disturbed, it tends to vibrate at a particular frequency or a set of frequencies known as the natural frequency, which is associated with one of the standing wave patterns. If another interconnected object pushes it with one of the natural frequencies, it will oscillate coherently with the interconnected object and achieve the largest vibration with the least resistance. This is known as “resonance”[10]. Briefly, resonance exhibits the
tendency of a system to absorb more oscillatory energy when the frequency of the oscillation matches the natural frequency of the vibration of the system (its resonant frequency) [3]. From the circuit viewpoint, as long as resonance occurs, the resistive elements, which will not cause frequency-dependent phase variation, are left in the circuit alone because of the cancellation between capacitive and inductive reactance [11]. Thus, the phase of output will be the same as that of input. In other words, the output will coherently oscillate with the input.
The phenomenon could be explained by a simple physical experiment demonstrated in Fig. 3. In Fig. 3, if struck by a rubber hammer, the tines of the tuning fork will vibrate back and forth and disturb the surrounding air medium; then the sound pressure wave is created. This mechanism is similar to the generation of the blood pressure wave resulting from heart beat. When the stimulated tuning fork forces air inside the first air tube with its natural frequency, which depends on the adjustment of the water level of the tube, the sound pressure wave achieves its maximum vibration, and resonance as well as coherent oscillation occur. Therefore, the maximum vibration pumps the water wave through the elastic tube and beats against the air in
the second tube. Then, a loud sound is produced. Conversely, if the tuning fork does not resonate with the first air tube, there will be no loud sound. The same theory could be applied to the heart pumping blood and blood circulation shown in Fig. 2(a).
Instead of air, blood is the medium for cardiovascular system. The heart is equivalent to the tuning fork, and the arterial system to the first air tube. In addition, because there are many arterioles distributed on organs, such as the lung, liver, heart, stomach, kidney, etc., the effect of these arterioles could be modeled as a cavity resonator similar to the second air tube. Therefore, provided that the heart resonates with the arterial system well, the organs will receive the maximum energy and coherently oscillate with the heart.
2.2 Mathematical Description
For arterial system, most of the energy originates from the transverse vibration of artery wall. The wall squeezes the blood, and via the equation of continuity of the fluid, the pressure wave drives a blood flow wave. The proposed pressure wave is governed by the following equation [4,12]
ext A F C z t z P t z kP t t z P R t t z P ( , ) 1 ) , ( ) , ( ) , ( 2 2 2 2 (1)
where P( tz, )is the difference between the internal fluid pressure Pi( tz, ) and the static pressure P0(z), i.e. P(z,t)Pi(z,t)P0(z), whfhf ,
A n C r r E k 0 0 2 , and ErzhT, in which
w
: density of arterial wall; h : thickness of the wall;
f
: density of the fluid that adheres to the wall ;
f
h : thickness of the fluid that adhere to the wall and moves radially together with the wall;
R: constant of viscosity for movement of the wall and the adherent fluid in the radial direction;
E E
En r : the sum of Young’s modulus in the radial and in the circumferential direction;
rz
E : the sum of Young’s modulus in the shear modulus of the wall;
T: tension along the wall per-unit circumferential length;
0
r : static radius of the tube;
A C : arterial compliance ( ) , ( ) ) , ( ( 2 t z dP t z r d ); ) , ( tz r : radius of artery.
Considering the pressure in cross-section, 2 (2, )
z t z P
will be equal to zero, and Eq. (1) is simplified as ext A F C t kP t t P R t t P 1 ) ( ) ( ) ( 2 2 . (2)
It is an equation of damped forced oscillation and can be viewed as the motion of a spring (spring coefficient = k) with an inertia element (mass =) as shown in Fig. 4(a). P(t) is related to the displacement of inertia element and the viscous damping force is proportional to the velocity (damping coefficient = R).
Under the assumption of electrically-driven mechanical-pumping system, Fext is related to ECG. Although the real ECG signal is quasi-periodic, it can be transformed into harmonic summations by the Fourier method. Then, we can consider Fext as a harmonically driving force and Eq. (2) is rewritten as
A C wt F t kP t t P R t t P cos( ) ) ( ) ( ) ( 0 2 2 (3)
where F is the amplitude of forcing function. The particular solution of Eq. (3) is0
also expected to be harmonic and assumed in the following form:
) cos( )
(t P0 t
Pp . (4)
By substituting Eq. (4) in to Eq. (3), the amplitude (P ) and phase angle () of the0 response can be expressed as [8]
2 2 2 2 / 1 2 2 2 0 ) 2 ( ) 1 ( 1 2 1 1 r r P n n st (5) and 2 2 1 tan n R , (6) where
n k : undamped natural frequency,
n R 2 : damping ratio,
A
st kC
F0
: deflection under the static force F , and0
n
r
.
From Eq. (5), we know that when the forcing frequency is equal to the undamped
natural frequency ( ) (i.e.n r1), the amplitude (P ) becomes maximum and the0
condition is called resonance. Damping reduces the amplitude for all values of the forcing frequency and particularly at resonance. For the healthy subjects, the spectral harmonics always coincide with that of BPW, so that we can consider the spectral harmonics of BPW as the natural frequencies of arterial system [11].
For the homogeneous solution of Eq. (3), we know that if R < 2 k (i.e. less damping), the system will be under-damped and generally stay in a healthy status with better artery elasticity. The waveform of BPW in such a system is shown in Fig. 4(b), where there are three peak waves (Percussion, Tidal and Dicrotic waves). It is noted that tidal wave occurs only in someone whose elasticity of artery wall is superior. On the other hand, if R > 2 k (i.e. more damping), the system will be over-damped and has worse artery elasticity. The BPW of such a system is demonstrated in Fig. 4(c), where there is only one peak wave (Percussion wave). Clinically, the patients of arteriosclerosis often show such a waveform pattern.
2.3 Signal Acquisition
The block diagram of the instrument for detecting the BPW is shown in Fig. 5(a) and the set up diagram is demonstrated in Fig. 5(b). The ECG of lead Ⅱ and the BPW of a radial artery non-invasively detected at the wrist (Fig. 5(c)) using piezo-electric
transducer were simultaneously recorded for 15 s and digitized at a sampling rate of 100 Hz. The 3 dB frequencies of the low-pass filter are 30 Hz for BPW and 50 Hz for ECG. The pressure detection system must consist of the pressure transducer, amplifier circuit, and A/D circuit, all of which operate with high linearity, broad bandwidth and fast response, to avoid distortion of the pulse waveform. Then we can obtain an accurate spectral distribution.
Fig. 3. If the stimulation frequency of tuning fork is equal to the natural frequency of the first air tube, the tuning fork resonates with the first air tube; thus, the maximum sound pressure wave of output is produced in the second air tube.
Tuning Fork
First air tube
(a)
(b)
(c)
Fig. 4. (a) The vibration of artery behaves like the motion of a spring with mass m. (b) The under-damped BPW waveform with three peaks (Percussion, Tidal and Dicrotic waves) is shown. (c) The over-damped BPW waveform with single peak (Percussion wave) is illustrated. Percussion wave Tidal wave Dicrotic wave Percussion wave m
(a) (b) (c) Pressure Transducer Artery Vibration Low Noise Amplifier Low Pass Filter A/D Converter Low Pass Filter
(d)
(e)
Fig. 5 (a) The block diagram of the BPW detection instrument is illustrated. (b)The set up diagram of BPW detection instrument is shown. (c) The detection point at artery is shown. (d) A BPW of normal person is shown. (e) A BPW of patient is shown. Time (s) B P W (m m H g) B P W (m m H g) Time (s)
CHAPTER 3. SPECTRAL-DOMAIN ANALYSIS
3.1 Power Spectrum Analysis
To investigate the different characteristics of the blood circulation system between two groups, a number of parameters were evaluated mainly using the frequency-domain methods. First, Fourier analysis was applied to characterize the quality of the BPW coupled with heart pumping (ECG). The power spectral density (power spectrum) was estimated from the averaged periodogram, i.e., Welch’s method, using a 500-sample window with an overlap of 400 samples.
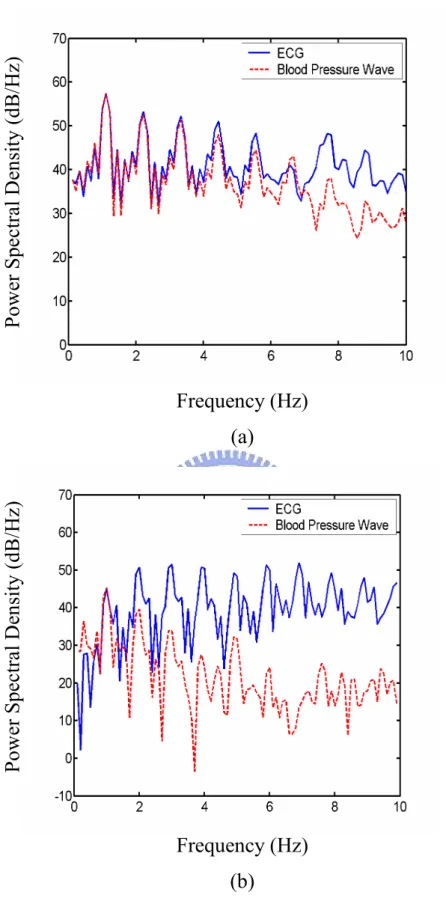
The degree of spectral coincidence is measured by the correlation coefficient or coupling efficiency () between the ECG’s power spectrum (Sxx) and the BPW’s
power spectrum (Syy); that is,
) , ( ) , ( ) , ( , yy yy xx xx yy xx yy xx S S C S S C S S C S S , (7)where C(Sxx,Sxx) is the auto-covariance of the power spectral density, Sxx, and C(Sxx,Syy)
is the cross-covariance of power spectral densities Sxxand Syy[13].
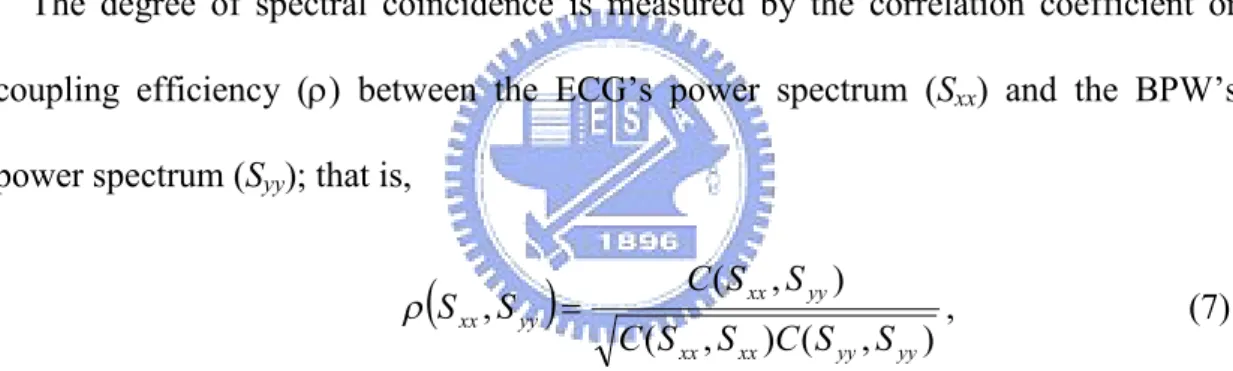
Figure 6 displays the power spectra (in dB scale) of the ECG and BPW for one normal, healthy subject (Fig. 6(a)) and one vascular patient (Fig. 6(b)). The spectral magnitudes of both the ECG and BPW are normalized to the same value according to the peak magnitude at the fundamental frequency, which is about 1.1 Hz for the healthy subject and 1.0 Hz for the patient. Apparently, the spectra of the ECG and BPW for the healthy subject coincide well for frequencies below 6 Hz, over which range more than 90% of the power is distributed. The correlation coefficient between
the ECG and the BPW estimated by Eq. (7) is approximately 0.98 in the frequency band from 0 to 20 Hz for the healthy subject. When most parts of the BPW’s power spectrum coincide with those of the ECG, that is, when the spectrum is coupled from the ECG to the BPW, we call this phenomenon the spectrum-coupled effect, which is similar to the frequency matching effect resulting from resonance. However, the spectra for the patient deviate widely except for the fundamental frequency. The correlation coefficient estimated by Eq. (7) is approximately 0.24. This suggests that the input-to-output (I/O) spectral relation is highly uncorrelated or out of resonance for abnormal blood circulation.
3.2 Bispectrum Analysis
As long as resonance occurs in an RLC circuit, the driving signal keeps the same phase as the output signal due to the cancellation of inductive and capacitive effects. Thus, to further investigate the phase-coupled effect between the ECG and the BPW, we evaluated the cross-bicoherence parameter on the basis of the bispectral analysis approach since the second-order spectrum (power spectrum) analysis disregarded the phase relations between frequency components [14,15]. The bispectrum B(f1, f2) of a
signal with Fourier transform X(f) is defined as: B(f1, f2)= X(f1) X(f2) X*(f1+f2). Huber
et al. used the bispectrum to investigate the EEG phase relation [16]. Jamesek et al. computed the cross-bispectrum between ECG and respiratory signals to study the coupling between cardiac and respiratory activities [17]. One major advantage of the bispectral approach is its ability to detect quadratic phase coupling. The interaction between two harmonic components of a process results in considerable spectral activities at the sum and difference of the two frequencies. It is the so-called
quadratic phase coupling, and it arises only among harmonically related components.
In practical applications, bicoherence defined as follows provides a normalized expression with a small variance:
) ( ) ( ) ( ) , ( ) , ( 2 1 2 1 2 2 1 2 1 f f P f P f P f f B f f bic , (8)
where B(f1, f2) is the estimate of the bispectrum, and P( f) is the estimate of the
power spectrum. The values of bicoherence lie between 0 and 1, with 0 (1) indicating the lowest (highest) degree of coupling [18,19].
In order to investigate the input-output relation, a cross-bispectrum is used to quantify the cross quadratic phase coupling, which is defined as
) ( ) ( ) ( ) , ( * 1 2 2 1 2 1 f W f X f Y f f f
BWXY , where W(f1) , X(f2) and Y(f1f2) denote the Fourier transform of three signals, W, X, and Y. Accordingly, the cross-bicoherence can be evaluated as follows
) ( ) ( ) ( ) , ( ) , ( 2 1 2 1 2 2 1 2 1 f f P f P f P f f B f f bicx Y X W WXY . (9)
For BWXY(f1, f2), a peak at the location (f1,f 2) indicates that the frequency component (f1f2) of Y is generated due to the quadratic phase coupling effect contributed by the f component in W and the1 f component in X. In our research,2
W is assumed to be the ECG signal, and X and Y are assumed to be the BPW [14,15]. In this study, we computed the average of cross-bicoherence values at significant frequency coordinates to measure the degree of cross quadratic phase coupling from
the ECG (input) to the BPW (output).
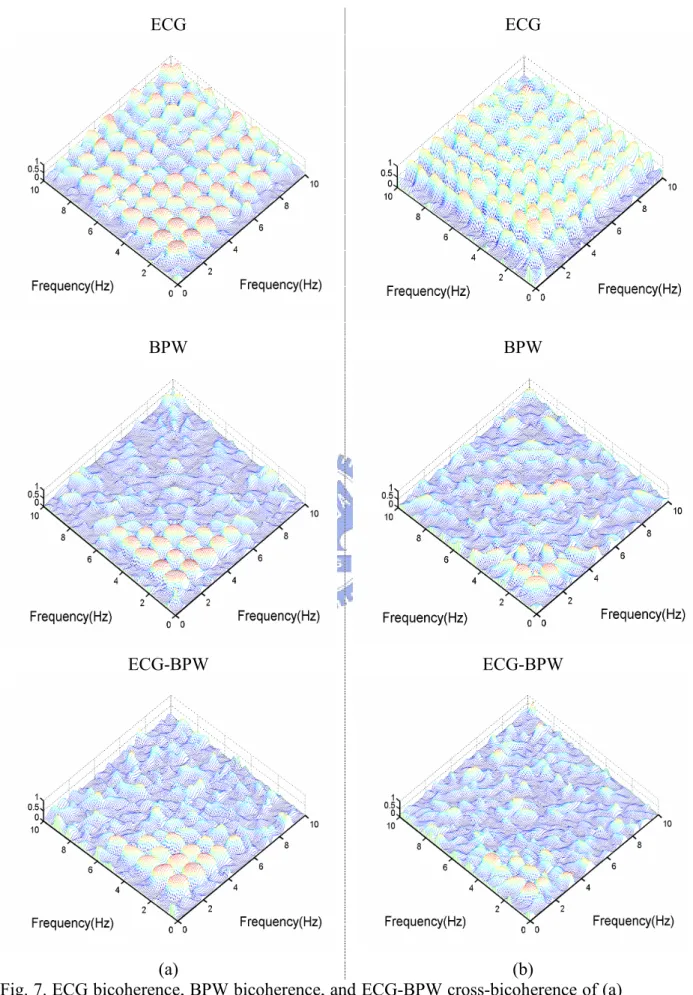
As illustrated in Fig. 7, ECG bicoherence plots for the normal and vascular subjects (the top row) both reveal a landscape of recurrent peaks at coordinates (f0, f0),
(2f0, f0), …, and (f0, 4f0), where f is the fundamental heartbeat frequency. However,0
considerable distinction between both subjects was observed in BPW bicoherence plots (the mid row). The BPW bicoherence for the patient shows an irregular distribution of peaks and a much weaker quadratic-phase coupling resulting from the poor resonant behavior of the cardiovascular system. In the healthy subject, the cross-bicoherence (the bottom row, Fig. 7(a) is characterized by an orderly alignment and robust peaks of magnitude 0.7 at coordinates (mf0, nf0), 1m, n 4. The
average value of cross-bicoherence measured at these frequency pairs is about 0.92. This implies that a strong cross quadratic-phase coupling between ECG and BPW is present at these low frequencies constituting the majority of the signal power. This also suggests that the “phase dependence”between input and output of the system is coupled. In comtrast, the average of the cross-bicoherence analyzed for the patient is about 0.59, with highly irregular shape, in the frequency range defined. Consequently, the bicoherence analysis infers a weaker cross quadratic-phase coupling between ECG and BPW for a diseased circulatory system.
3.3 Transfer Function Analysis
Finally, the frequency response of the circulation system model, under the assumption of linearity and time-invariance (LTI), can be expressed as the ratio
) ( ) ( ) ( f P f P f H XX XY , (10)
where PXX(f) and PXY(f) represent the auto power spectrum of the input and the cross
power spectrum of the input and output [13]. The units used for ECG and BPW in the evaluation are and mmHg, respectively. The function H(V ) denotes a transfer function corresponding to the “input-to-output transfer gain”measurement and reflecting the linear relation between ECG and BPW.
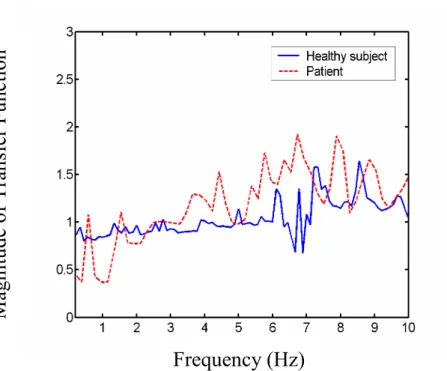
Figure 8 illustrates the magnitude of transfer function H(f) estimated by Eq. (10) and normalized by the mean value, based on a 500-sample Kaiser window and 400 points overlapped. Apparently, the response in Fig. 8 of this normal subject approximates a constant at frequencies below 6 Hz. This kind of flat response characterizes an LTI system with smooth energy transfer and low resistance. Thus, it is considered to be a system with good transmission efficiency from input to output in the corresponding frequency range. Nevertheless, the response for the patient in Fig. 8 exhibits severe fluctuation, indicating poor transmission efficiency or high resistance from input to output. The standard deviation of H(f) in the range 0-10 Hz is used to measure the system performance in frequency domain, which is 0.19 and 0.36, respectively, for the normal and abnormal subjects.
3.4 Experiment and Results
The study subjects were composed of two groups. The first group consisted of 20 subjects (11 males and 9 females, at the ages of 18 to 40) whose health checks were normal. The second group was composed of vascular patients (12 males and 8 females, at the ages of 36 to 55), among whom eight subjects had hypertension; seven subjects, atherosclerosis; and the rest, thrombus diseases. Before measurement, all subjects rested for about twenty minutes to obtain a steady pulse, because a changing heart rate,
e.g. because of physical exercise, leads to blood redistribution and yields an unreliable result. Although there are many possible reasons for changes in the natural frequency of the arterial system that result in the vessel or organ diseases, we confined our preliminary study to vascular-related diseases, such as hypertension, atherosclerosis, and thrombus diseases.
Table 1 summarizes the results from 20 healthy subjects and 20 vascular patients, including the correlation coefficient of power spectrum (0-20 Hz), the average of the cross-bicoherence ((mf0, nf0), 1m, n 4), the standard deviation of the transfer
function (0-10 Hz), and the p-value. In the group of healthy subjects, larger mean values of correlation coefficient and cross-bicoherence are derived from the distributions; however, a smaller mean value of transfer function deviation is obtained. Moreover, all p-values are lower than 0.01. We may thus declare that the difference between two groups is significant on the basis of the evaluation of these parameters.
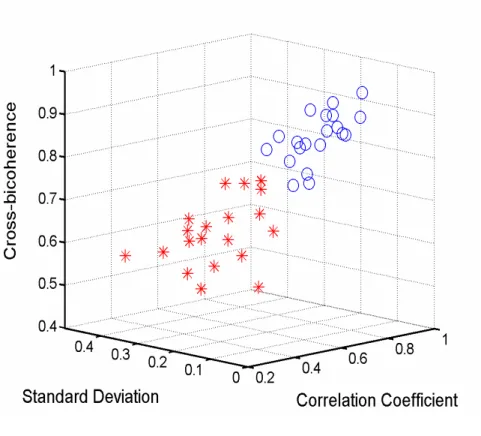
To evaluate the distribution of data set of each group, the results are embedded in the three dimensional feature spaces: (correlation coefficient, the standard deviation of transfer function, cross-bicoherence), as displayed in Fig. 9. Two distinct clusters of feature vectors are formed corresponding to the normal and abnormal groups.
3.5 Spectral-Domain Circuit Model
Some researchers discussed that most of the energy in blood circulation is transported by the transverse vibration of arterial walls. This mechanism makes
transverse resonance possible, although resonance along the longitudinal artery was
supposed to have failed according to McDonald [2]. In fact, the effect of transverse resonance has been found in electromagnetic waves propagating along a planar-plate
waveguide [20]. Because of zero impedance in the transverse direction (transverse resonance), the energy can be preserved in transverse direction; thus, the blood pressure wave can be carried a distance in the longitudinal direction. In the electromagnetic waveguide theory, different resonance modes correspond to the respective frequencies in the spectrum. Therefore, in order to survey the resonance effect in blood circulation, we have analyze and established a spectral-domain circuit model of the arterial system.
Starting from the conventional time-domain Windkessel model (Fig. 10(a)) which is used to represent the whole arterial system, the compliance (C) and inertance (L) are closely related to the capacitance and inductance in an electrical circuit, respectively [1,2]. Resistance R is connected in serial with L, and peripheral1
resistance R2 is connected in parallel with C. By circuit theory, one pair of capacitance and inductance generates only a single resonance frequency (i.e., a single peak frequency in the spectrum). The phenomenon is against the real spectrum of BPW, in which multiple resonance frequencies are observed. Therefore, we must make some modifications of the conventional Windkessel model to match the frequency-domain characteristics. The original Windkessel model with four elements is assumed to be a single resonator unit. This resonator is reproduced into five units, which are connected in parallel to simulate five major resonance frequencies constituting most of the energy of the BPW. If any other frequencies are indispensable, resonance units can be extended and connected in parallel. In addition, the resonance frequency of each resonator unit is assumed to be sufficiently separated so that it does not cause inter-coupling between resonators. In fact, almost all observed peaks in the power spectrum are discrete enough to support this assumption.
frequency f and the resonance quality factor (Q) may be derived as follows. First,0
the parallel circuit of R and C in Fig. 10(a) is transformed into the serial2 ' 2
R and C'
in Fig. 10(c). Then C' and ' 2 R can be derived as C R C C 2 2 2 ' 1 (11) 2 2 2 2 2 ' 2 1 R C R R , (12)
where is the angular frequency. When the imaginary part of the input impedance
of RLC serial circuit becomes zero, resonance occurs, and the resonance frequency is given by L C R L C R f 2 2 2 2 2 0 2 1 . (13)
Bandwidth (BW), defined as the frequency range between 3 dB points in the power spectrum, is derived as ' 2 ' 2 1 4 2 1 LC L R R BW . (14)
According to the theory of resonance circuits, the loaded Q of the Windkessel resonator with a narrow band, which is defined as the total stored energy (E ) dividedS
by the total energy loss (E ), may be approximated from Eqs. (13) and (14) asL
BW f E E Q L S 0 , (15)
where f is the resonance frequency and0 BW is the 3 dB bandwidth of the power spectrum [20]. Instead of calculating the parameters R ,1 R , L, and C of the model2
evaluate Q. In fact, once f is known from the spectrum, the relationship between L0
and C can be determined by Eq. (13). In the same manner, if BW is measured from the spectrum, the derivation of R and1 R depends on BW in Eq. (14). Therefore,2
0
f , BW, and Q are sufficient to characterize the model, and it is not necessarily essential to evaluate R ,1 R , L, and C. As a result, we obtain the quality of an2
individual resonator from its corresponding resonance band in the real spectrum. In summary, in the traditional Windkessel model with four elements, the overall compliance and inertance effects are merged and degenerated, respectively; therefore, to remain consistent with the practical spectrum, we decompose the traditional model into multiple resonance units with different resonant frequencies. The decomposed model is similar to the topology of blood circulation within the human body, where the heart pumps the blood to several major organs such as the liver, heart, spleen, lungs, and kidneys. Every organ can be considered to be connected in parallel with the aorta and behaves like a group of arterioles. From the viewpoint of a circuit, the organ also looks like a band-pass filter or a resonator which resonates with the heart [6].
In order to simulate the frequency response of the spectral-domain circuit model, we put in an AC current source with 1A amplitude to simulate blood flow. It is worth noting that the relation between blood flow and arterial pressure is assumed to be linear. To design the resonance frequencies of the model to match the real spectrum with 1 Hz fundamental frequency, by Eq. (13) we let L10.16(H), C1 0.16(F),
08 . 0 2 L (H), C2 0.08 (F), L3 0.053 (H), C3 0.053 (F), L4 0.04 (H), 04 . 0 4
C (F), L5 0.032(H), C5 0.032(F), the serial resistances (R ,11 R ,21 R ,31
41
R , and R ) be zero, and the parallel resistances (51 R ,12 R ,22 R ,32 R , and42 R )52
frequencies of approximate 1, 2, 3, 4, and 5 Hz, i.e., f , 2f , 3f , 4f , and 5f , respectively, where f is the beat frequency. The simulated frequency response from SPICE program is shown in Fig. 11(a). Note that increasing the serial resistances (R ,11
21
R , R ,31 R , and41 R ) decreases the amount of current flowing into the resonators,51
gradually broadening the resonance frequency band, and decreasing the Q value. This statement is illustrated in Fig. 11(b). Moreover, in Fig. 11(c) the decreasing parallel peripheral resistances (R ,12 R ,22 R ,32 R42 and R ) reveal similar results as in Fig.52
11(b). These results also indicate that only some specific resonance frequencies, which are integral harmonics of the fundamental heart frequency, are allowed to pass the arterial system. This agrees with the fact that the arterial system not only couples the energy from the heart but also merely resonates in the corresponding harmonic frequencies. Consequently, the proposed spectral-domain circuit model is well-suited for modeling the frequency behavior of blood circulation on the basis of resonance.
The equivalent resonance circuit (spectral-domain circuit model) is only used to describe the frequency matching effect (resonance) between the ECG and the BPW at several major harmonic frequencies, f ,0 2 f ,…0 5 f , where0 f is the fundamental0
heartbeat frequency. The sub-harmonic frequencies observed in Fig. 6(a) are caused mainly by the modulation effect of respiratory activity on the ECG, which then leads to a similar frequency variation in the BPW. Therefore, for healthy subjects with elastic artery walls, we observe a similar spectral distribution not only at major harmonics but also at sub-harmonics. Consequently, the transfer function is constant in the spectrum, yet there are several peaks in the simulated frequency response of the equivalent resonance circuit.
3.6 Measurement of Q Value
Taking as an example the spectra shown in Fig. 6, we observe that the frequency peaks of a patient are widen compared with those of a healthy subject. The Q values of the first five harmonics are evaluated using Eq. (15) and listed in Table 2. The result suggests that a healthy subject retains a higher Q value and a better resonance quality. Table 3 shows the statistical results of Q values for forty subjects reported in § 3.4. The higher mean Q in the healthy group further supports our conclusions in Table 2. Furthermore, the smaller P values (< 0.01) for five peak frequencies also indicate that the distinction between the two groups is significant and more obvious for higher-frequency peaks.
Fig. 6. Power spectral densities of ECG (solid curve) and BPW (dashed curve) for (a) a healthy subject, and (b) a cardiovascular-related patient.
Frequency (Hz)
(a)
Frequency (Hz)
(b)
P
ow
er
S
pe
ct
ra
lD
en
si
ty
(d
B
/H
z)
P
ow
er
S
pe
ct
ra
lD
en
si
ty
(d
B
/H
z)
ECG ECG BPW BPW ECG-BPW (a) ECG-BPW (b)
Fig. 7. ECG bicoherence, BPW bicoherence, and ECG-BPW cross-bicoherence of (a) the healthy subject, and (b) the patient.
Fig. 8. Estimated transfer function of the healthy subject (solid curve) and the patient (dashed curve).
Frequency (Hz)
M
ag
ni
tu
de
of
T
ra
ns
fe
r
F
un
ct
io
n
Fig. 9. The results of analyzing twenty healthy subjects and twenty vascular patients are embedded in the three dimensional feature spaces: (correlation coefficient, the standard deviation of transfer function, and cross-bicoherence). Circles () represent the healthy subjects and asterisks () represent the patients.
R2 L C R1 (a) L1 R12 C1 L2 R52 C2 L3 C3 L4 C4 L5 C5 R22 R32 R42 R11 R21 R31 R41 R51 (b) R2 ' C ' L R1 (c)
Fig. 10. (a) The Windkessel model with four elements, (b) The spectral-domain circuit model, and (c) the serial equivalent circuit of Windkessel model with four elements are illustrated.
Arterial system
Frequency (Hz) (b) C ur re nt M ag ni tu de (A ) C ur re nt M ag ni tu de (A ) Frequency (Hz) (a)
Fig. 11. The frequency response of the spectral-domain circuit model is simulated using various parameters to assess the resonance characteristics. (a)R11 R21 R31 R41 R51 0 and R12 R22 R32 R42 R52 10k(), (b) curve 1: R11 0, R21 0.01, R31 0.02, R41 0.03, R51 0.04(), curve 2: 01 . 0 11 R , R21 0.02 , R31 0.03 , R41 0.04 , R510.05 ( ), curve 3: 03 . 0 11 R , R21 0.04 , R310.05 , R410.06 , R51 0.07 ( ), curve 4: 05 . 0 11 R , R21 0.06 , R31 0.07 , R41 0.08 , R51 0.09 ( ), and k R R R R
R12 22 32 42 52 10 ( ) for all curves, (c) curve 1: R12 10k ,
k R22 ,1 R12 0.2k, R12 0.1k, R12 50(), curve 2: R12 10k, R22 0.8k, k R12 0.1 , R12 50, R12 30(), curve 3: R12 10k , R22 0.6k , R12 80, 40 12 R , R12 20(), curve 4: R12 10k , R22 0.4k , R12 60, R12 30 , 10 12
R (), and R11 R21 R31 R41 R51 0 for all curves. Frequency (Hz) (c) C ur re nt M ag ni tu de (A )
Table 1. Statistical characteristics of correlation coefficient, cross-bicoherence, standard deviation (S.D.) of transfer function, and p-value for healthy and patient groups.
Correlation coefficient
Cross-bicoherence Standard deviation of
transfer function Healthy subjects (Mean ± S.D.) Vascular patients (Mean ± S.D.) 1 . 0 821 . 0 00 110 . 0 542 . 0 056 . 0 828 . 0 075 . 0 619 . 0 035 . 0 206 . 0 054 . 0 301 . 0 p-Value ) 01 . 0 ( 10 742 . 3 10 ) 01 . 0 ( 10 570 . 6 13 ) 01 . 0 ( 10 661 . 8 8
Table 2. Resonance quality factors (Q) of subjects shown in Fig. 6 Resonance frequency f 2 f 3 f 4 f 5 f Healthy subject Vascular patient 5.5 5.3 11.1 8.0 16.5 10.5 22.3 11.1 28.1 22.3
Table 3. Statistical results for resonance quality factor (Q) of 20 healthy subjects and 20 vascular patients
Resonance frequency f 2 f 3 f 4 f 5 f Healthy subjects (Mean ± S.D.) Vascular patients (Mean ± S.D.) 5.68±0.39 5.38±0.14 10.59±0.81 9.77±0.75 15.45±0.82 13.99±1.67 20.65±1.65 18.19±2.47 27.35±1.61 24.19±2.31 p-Value ) 01 . 0 ( 10 17 . 2 3 ) 01 . 0 ( 10 93 . 1 3 ) 01 . 0 ( 10 21 . 1 3 ) 01 . 0 ( 10 74 . 6 4 ) 01 . 0 ( 10 24 . 1 5
CHAPTER 4. SYSTEM MODEL
4.1 Modulated ECG
Several influence factors, such as respiratory activity, autonomic nervous system, baroreceptor reflex, cardiac output, emotions, exercise, etc. are known to affect both the frequency and amplitude of ECG. Since ECG and influence factors are similar to a carrier and modulation signals, respectively, both the frequency and amplitude variations of ECG are essentially analogous to the frequency modulation (FM) and amplitude modulation (AM) effects in an electronic communication system.
Regarding AM effect, it is mainly caused by the respiration-induced amplitude modulation of ECG [21,22]. By the modulation theory of electronic communication we know that if the central frequency of carrier (original ECG) and AM modulation signal are f and0 f , respectively, the nonlinear inter-modulation effect between1
carrier and AM modulation signal will lead to the frequency peaks at f0 ,f1 f0 ,f1
1
0 2 f
f , f0 , …… etc. in the spectrum [23]. Consequently, there will be some2 f1 frequency components in the spectrum like harmonics, f ,0 2 f ,0 3 f ,…,0 f , 21 f ,1
1
3 f ,…, f0 ,f1 f0 ,f1 f0 ,2 f1 f0 , …… etc. Furthermore, because of the2 f1 spectral coupling effect, there will be a similar spectrum distribution for blood pressure wave [11]. For example, for a subject whose fundamental heart beat and respiratory frequency are 1.1 and 0.3 Hz, respectively, we could find the side peaks at 0.8 Hz (1.1-0.3) and 1.4 Hz (1.1+0.3) around the first harmonic (1.1 Hz), respectively as shown in Fig. 12(a). The strength of AM modulation is called the depth of modulation and defined as follows:
AM modulation depth = B A B A , (16)
where A and B is the maximum and minimum peak amplitude of QRS complex wave of modulated ECG [23]. The ECG of this subject is demonstrated in Fig. 12(b) and the dash line denotes the amplitude variation of the peaks of QRS complex wave. Using Eq. (16), the evaluated AM modulation depth is 3.27% (A=1.025 mV, B=0.96 mV).
The FM effect allows the frequency band of carrier signal to broaden due to the frequency swing. Clinically, the most frequently used method for the measurement of frequency swing of ECG is HRV (heart rate variability), and this approach has acquired some achievements [24-26]. We use another parameter defined as
BW f
Q 0 , (17)
to characterize the frequency swing effect of each spectral harmonic, where f is the0
central frequency of each harmonic and BW is the 3 dB bandwidth [11,23]. Larger (smaller) Q value indicates a smaller (larger) frequency swing. The calculated Q values for the first five harmonics are 5.5, 11.1, 16.5, 22.3, and 28.1 in sequence.
4.2 Coherence Analysis
For the cardiovascular system, blocked blood vessels, stiff arteries, high peripheral resistance, extruded blood vessel due to damage, blood turbulence, viscous damping, propagation disturbance of arterial pressure pulse, etc., are treated as interferences. They would affect both the blood flow toward its destination and the pressure pulse contour; therefore, they induce various cardiovascular-related diseases. These perturbation signals also interfere with the resonance and coherent oscillation between
the input and the output of the system. In fact, they are equivalent to the noises generated in transmission channel for electronic communication system.
In our research, the cardiovascular system is regarded as an electrically-driven mechanical-pumping system [11]. Thus, the modulated ECG and blood pressure wave are considered as the input and the output signals of the cardiovascular system, respectively. In other words, in such a system the electrical energy is transformed into mechanical power. Now, a cardiovascular system model described in Fig. 13(a) is established based on the concept of modulated ECG, power coherence and perturbation. Moreover, the spectra of modulated ECG including the inter-modulation effect are demonstrated in Fig. 13(b).
Instead of developing complex mathematical equations to characterize the system, we use the coherence function CXY( f), which represents the magnitude squared coherence between input signal X and output signal Y, to quantify the macroscopic effect of power coherence for the system. The function is defined as
power output Total input from only power Output ) (f CXY ) ( ) ( ) ( 2 f P f P f P YY XX XY (18)
where PXX( f) and PYY( f) are the power spectral densities of input and output, respectively, and PXY( f) is the cross power spectral density between input and output [13]. The coherence function always takes on a value in the interval
1 ) (
0CXY f , and with a value close to one, if the perturbation (noise) level is low. When the coherence function is far less than one, it indicates the presence of one or more of the following: (1) a disturbance affecting the output, (2) another input source, or (3) nonlinear relationship between input and output.
coherence and extract perturbations between ECG and BPW. Furthermore, the average S of coherence values at the first five harmonic peaks, which constitute most of the energy of the system, is defined as an index for measuring the degree of coherence of the system.
4.3 Experiment and Results
We evaluated the coherence function using the Hamming window with a 600-sample window and an overlap of 500 samples. The estimated coherence functions of a healthy subject and a cardiovascular patient are illustrated in Fig. 14. The fundamental heart frequencies f are 1.1 Hz and 1.35 Hz for the healthy subject0
and cardiovascular patient, respectively.
Some remarkable differences for the two subjects are summarized as follows: (1) The average S of coherence values for the first five harmonic frequencies is close
to one for the healthy subject, yet approximately 0.85 (<1) for the patient. This means that, for the healthy subject, the input power is coherently coupled to the output and the output is completely dominated by the input, particularly in the first five resonant frequencies (i.e. harmonic frequencies). However, for the patient, perturbations are generated and the output is not entirely determined by the input. In other words, the perturbation signals effectively affect the output.
(2) The bandwidth of coherence function for the first five harmonic peaks is more larger and regular for the healthy subject than that for the patient. This implies that, for the healthy subject, more frequency constituents of the system induce a high coherence value.
(3) The coherence function within the frequency range of slow-varying modulation signals (0.4Hz), in synchrony with respiratory rate, also exhibits a peak for both
the healthy subject and patient. This reveals that the power of such modulation signals is also coherently coupled to the output for both the healthy subject and the patient.
Moreover, the above results are observed not only in the two subjects but also in the experiment in which forty-four subjects participated.
The study subjects were composed of two groups. The first group consisted of 22 healthy subjects (12 males and 10 females, at the ages of 18 to 40) whose health checks are normal and without any reported cardiovascular disease. The second group was composed of 22 patients with cardiovascular-related diseases (13 males and 9 females, at the ages of 36 to 55). The disease patterns were not specified for the study of general effect of coherence function on cardiovascular system. Before the measurement, all the subjects were rested for about twenty minutes to get a steady pulse waveform. The statistical results are demonstrated in box plot in Fig. 15. For healthy subjects, the mean value of S (=0.97) is larger than that (=0.92) for cardiovascular patients. In addition, the small p-value (=7.92105 0.01) indicates
that the coherence values S of healthy subjects and cardiovascular patients are significantly different. Consequently, this index is appropriate for quantifying the coherence characteristic.
Fig. 12. (a) The spectra of ECG and blood pressure wave are shown, where the peak in the range of 0 ~ 0.4 Hz is due to the modulation signals and the side peaks around harmonics (sub-harmonics) are attributed to the inter-modulation effect. (b) The peak amplitude variation of the QRS complex wave of modulated ECG, which results from the AM modulation effect, is plotted with a dashed line.
P
ow
er
sp
ec
tr
al
de
ns
ity
(d
B
/H
z)
Frequency (Hz)
(a)
AM effect(Inter-modulation side peaks) Modulation signal FM effect
Time (s)
(b)
E
C
G
(m
V
)
1
f
0
f f1 2 f13 f1 f02f1f0f1f0 f0f1f02 f1
Fig. 13. (a) The presented cardiovascular system model is plotted. (b) The schematic diagram of the spectra of original ECG, modulation signal and modulated ECG is illustrated. Original ECG (Carrier) Modulated ECG AM and FM Modulation signals Cardiovascular system Blood Pressure Wave Perturbation signals (Noise) Modulator Original ECG Modulation signal Modulated ECG ‧‧ Modulator (a) (b)
Fig. 14. The coherence functions of a healthy subject and a cardiovascular patient are demonstrated.
Frequency (Hz)
C
oh
er
en
ce
fu
nc
tio
n
Fig. 15. The statistical results of power coherence index S of twenty-two healthy subjects and twenty-two cardiovascular patients are demonstrated with box plot.